
 ?Mathematical formulae have been encoded as MathML and are displayed in this HTML version using MathJax in order to improve their display. Uncheck the box to turn MathJax off. This feature requires Javascript. Click on a formula to zoom.
Abstract
Historic buildings are examples of spaces where daylight was used as a main source of light. A good balance between sufficient daylight and controlled heat gain or loss was achieved in historic buildings. In this research, four different Emirati forts and citadels located in the same climatic region are chosen to assess their daylight illuminance levels. The illuminance levels of the selected spaces of these forts are compared with each other and then compared with the Illuminating Engineering Society of North America (IESNA) standard to determine the lighting preference of the Emirati people against the universal standards. Findings reveal among the four investigated spaces two of them are above the required level of illuminance based on international standards for reading and writing tasks. These buildings are prototypes from which a window-to-floor ratio can be extracted as a good indicator for energy-saving criteria.
PUBLIC INTEREST STATEMENT
Improperly designed windows may cause fatigue, depression, and poor level of illumination in building interiors. The suitable location of the windows plays an important role for indoor daylight levels and distribution. In daylighting design concepts, daylight factor (DF) is the ratio of the interior lighting in the space to the exterior lighting. Spaces with an average daylight factor (ADF) above 2% can be considered daylit but supplementary artificial lighting is needed. When the ADF is above 5%, the rooms appears to be strongly daylit and daytime artificial electrical lightings are hardly needed. The use of daylight as the primary light source is an integral part of the sustainable design that leads to less dependence on artificial lighting and reduced electric energy consumption.
1. Introduction
For many centuries, daylight has been used as the primary source of light in different buildings. Occupants can enjoy a pleasant indoor environment with less artificial lighting if sufficient daylight is available with appropriate controls to avoid glare and excessive heat gain or loss. The use of daylight as the primary light source is an integral part of the sustainable design that leads to less artificial lighting consumption (Boyce et al., Citation2003). Moreover, daylight can reduce independence on artificial lighting (Robbins, Citation1986). Improperly designed windows may cause fatigue, depression, and poor level of illumination in building interiors (Al-Tamimi, Citation2015; Al-Tamimi & Fadzil, Citation2012; Wilson et al., Citation2002). Several design aspects, including opening and glazing the interior surface with appropriate use of color, would affect the quality of naturally illuminated indoor spaces (Baker & Steemers, Citation2002; Fontoynont, Citation1999; Tregenza & Wilson, Citation2011). The suitable location of the windows plays an important role for indoor daylight levels and distribution (International Energy Agency [IEA] and Solar Heating and Cooling Program [SHC], Citation2000; Illuminating Engineering Society of North America [IESNA], Citation2000; Carmody & Selkowitz, Citation1996).
Several studies have reported that daylighting can provide a cost-effective alternative to electrical lighting for commercial and institutional buildings (Ihm et al., Citation2009). Simulation results and measurement studies have reported that daylighting controls can result in significant lighting energy savings ranging from 30% to 77% (Doulos et al., Citation2008; Lee & Selkowitz, Citation2006; Li et al., Citation2006; Onaygil & Guler, Citation2003). The result shows better visual comfort and lighting consumption. Simulation tools have been widely used to assess the daylight performance of control strategies. Recent studies have compared the energy and the visual comfort performance of seven independent and integrated lighting and daylight control strategies (Shen et al., Citation2014). The results of the integration show many advantages, such as less lighting energy consumption.
In many countries, building regulations and codes set requirements related to the adequate amount of daylight to be introduced in indoor spaces. These requirements are based on the average daylight factor (DF) and minimum window sizes as percentage of the window area to the floor area. A cross-cultural difference in lighting preferences is the main challenge since standards sometimes cannot be universally applied to different cultural contexts (Davis et al., Citation2007). By knowing the context culture of the people, a designer can start understanding the preferences of the users. As reported by Guerin and Mason (Guerin & Mason, Citation1993), interior designers need to be culturally sensitive to face design challenges worldwide.
This study aims to investigate the daylight contribution to the well-being in these spaces by looking back in time when people only rely on daylight where there was no interference of artificial light. The measured data have been compared with the international standards based on human needs to perform specific tasks (reading and writing), and this will give us a precise judgment on people’s need for light, and will help in setting proper Emirates standards based on window-to- floor ratio that can be referred to in the future for designing well illuminated spaces in UAE environment and based on Emirate people preferences.
2. Indicative phase
The indicative phase of the study focuses on the background information of the selected forts. Four forts located in the United Arab Emirates (UAE) have been selected for this study, and their locations and historical background are detailed as follows.
2.1. Historical background of the selected forts
2.1.1. Al Muwaiji palace
From a coin excavated on the site, the earliest evidence on the date of Qasr Al Muwaiji’s construction was 1897. This shows that this impressive structure has watched over the oasis of Al Muwaiji for around 100 years. The palace is a square enclosure of thick walls from mud, with towers in the corner and a grand entrance gate (Figure ).
Figure 1. Exterior view of the fort
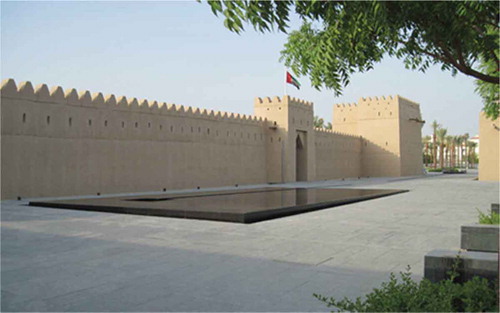
This fort is a symbolic historical monument that represents the history and political succession of the Al Nahyan family. It was built in the time of Sheikh Zayed bin Khalifa the first by his son, Sheikh Khalifa bin Zayed bin Khalifa. In 1946, Sheikh Zayed bin Sultan Al Nahyan was appointed ruler’s representative in Al Ain and moved to Qasr al Muwaiji. The fort became his diwan and his family home. His eldest son, Sheikh Khalifa bin Zayed Al Nahyan, was born at Qasr al Muwaiji two years later in 1948 and spent much of his youth there, learning from his father. [20–22].
2.1.2. Al Ain palace
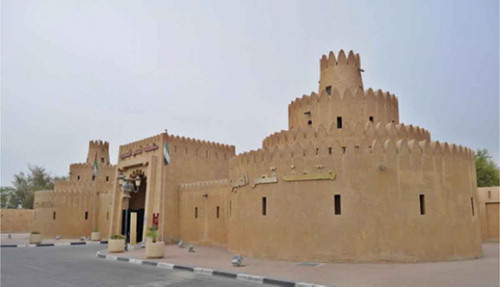
Al Ain Palace, as shown in Figure , is located on the western side of the Al Ain Oasis and is one of the Al Ain residences of the late Sheikh Zayed bin Sultan Al Nahyan, the founding father and first president of the United Arab Emirates. The palace provides a glimpse into the life of the ruling family and the culture of the local community before the union in 1971. Dating back to 1937, Al Ain Palace was built in the traditional architectural style of Al Ain. The palace is significant for its close association with the life and story of Sheikh Zayed bin Sultan Al Nahyan during his twenty years as ruler’s representative in Al Ain. It stands witness to the great transformations that Al Ain went through from the middle of the last century and contains elements of the city’s traditional architecture.
The contrast of design elements with traditional Emirati influences can be seen throughout the property. The structure of the museum is a conglomeration of courtyards that merge the official and private use of the facilities in one complex. Each of these areas was built and restored using locally sourced and environmentally friendly building materials, including clay, adobe and plaster stones, as well as palm tree elements for roofing rooms, ceilings, doors, and windows. In 1998, the palace was restored and enlarged. The long corridor near the entrance, the administrative area, and the Al Nahyan family tree wall feature were added at this time [23].
Figure 2. Exterior view of Al Ain palace
2.1.3. UAQ fort
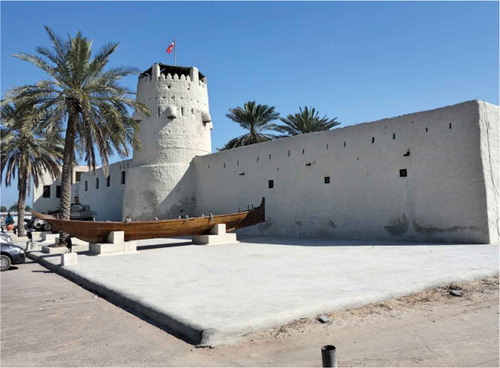
Umm Al Quwain (UAQ) Fort, as shown in Figure and sometimes also called Fort Al Ali, lies in the center of the city with the same name, in the Emirate of Umm Al Quwain in the UAE. Umm Al Quwain Fort was built in 1786 by Sheikh Rashid I bin Majid Mu’alla. It had to protect the town and harbor and was used as the sheikh’s residence and a seat of his government [24].
Umm Al Quwain Fort kept its role as the sheikh’s residence and seat of government up until 1969. After that, it turned into a police station. In 2000, it opened as a museum after a restoration. Facing the sea on one side and the creek on the other, the fort has a rectangular ground plan with one round corner tower and a larger round tower in the west wall [25].
Figure 3. Exterior view of UAQ fort
2.1.4. Ajman fort
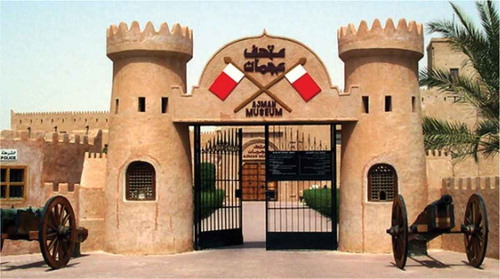
Located in the center of Ajman, next to the gold and traditional souq, with a fascinating collection of artifacts housed in a beautifully restored fort, Ajman Museum, as shown in Figure , is one of the most visited historical attractions in the UAE. It is the emirate’s foremost museum illustrating life as it once was. The 18th-century fort served as the ruler’s residence until 1970 before it was converted into a museum a decade later.
Figure 4. Exterior view of Ajman fort
2.2. Climatic information
The seven emirates of the UAE are mainly characterized by a hot climate. Each emirate has its own climate based on its location. However, it does not differ clearly as UAE is a small region country. Summer days in the UAE start from May to October. Temperatures vary from 35°C to 45°C, where the humidity can increase till 90% in the coast region. Hot and dusty winds, known as shamal, blow from the red sea toward the land. These dry winds mix with humid air, forming a catalyst that amplifies the hot weather. On the other hand, the winter season starts from November to April. Temperatures range between 24°C and 28°C throughout the day. The climate data for Ajman and Umm Al Quwain, and the climate data for Al Ain are reported by the websites as follow [26;27].
3. Investigative phase
The investigative phase of the study focuses on the measurements of the interior and the exterior illumination and data collection of the spaces from the chosen forts. The standard unit of illuminance is lux (lx), measured in lumens per square meter (lm/m2). The Illuminating Engineering Society of North America (IESNA) standard has been used in this research (Eissa et al., Citation2010). Different activities have different illuminance requirements, and the illuminance range used for this research is 200–300 lx, which represents the adequate level of illuminance for performing visual tasks of high contrast or large sizes (reading and writing).
3.1. Selected spaces
The interior illumination measurements were carried out in selected spaces (living spaces) at the four chosen forts. The details of the spaces and the measurement procedures are described in the following subchapters.
3.2. Measurement procedures
All illuminance level measurements took place in the living spaces (Emirati Majlis). The Emirati Majlis were used for different functions, and the tasks that required illuminance were reading and writing. These tasks were usually performed sitting, so the working plane was taken at a height of 40 cm from the floor level. The following experimental procedures were followed in all selected spaces of the forts:
Space geometry was measured and recorded
A grid of (40 cm × 40 cm) was marked on the ground using cotton strings
Light meters were placed on a height of 40 cm to comply with the required height of the working plane
Readings were taken using light meters from at the intersection points of the grid
Exterior illuminances were also measured at the same time, and the average was taken for further calculation
4. Measurements
The illumination readings have been performed using the TES-1336 illuminance meter which is a highly accurate meter. The analytical phase of this research involves collecting the measured data and analyzing them. The average illuminances, the daylight factors, and the window-to-floor ratios were then calculated for all the measured spaces.
4.1. Fieldwork results of Al Muwaiji fort
The interior measurement was performed in the Majlis as shown in Figure using the appropriate grid as described above. The detail of the space with the opening dimension is given in Table . Two light meters at 40 cm above the floor level were used to read the level of the interior illumination (Figure ). The outside illumination was taken using the light meter as shown in Figure .
Figure 5. Selected space (Majlis) for Muwaiji fort
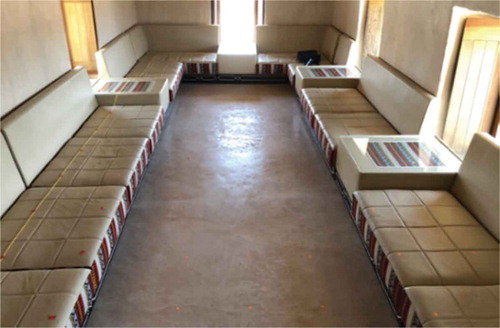
Figure 6. Inside measurement using two light meters
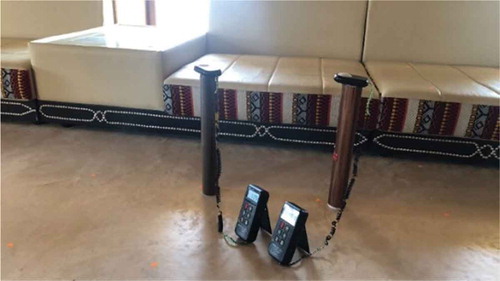
Figure 7. Measurement of the outside illuminance
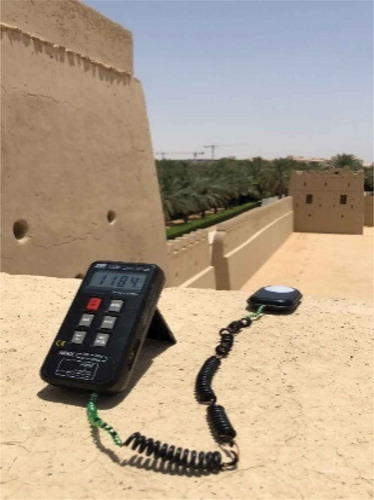
Table 1. Area and opening dimensions
Through the analysis of the isolux curves as shown in Figure , it was found that the illumination level is unevenly distributed within the entire space and the illumination levels are widely varied from more than 600 lx to less than 100 lx in some locations within the space. Figure shows the three-dimensional daylight distribution in the space. The results clearly show that the highest range of the illuminance levels is close to the windows, and as we move toward the center of the space, the illuminance levels gradually drop. Since the door is adjacent to another room, we can notice that the space close to the door has low illumination readings.
Figure 8. Isolux plot of Al Muwaiji palace
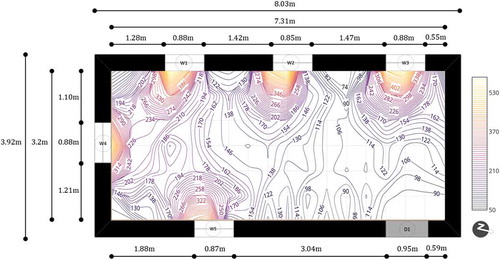
Figure 9. 3-D daylight distribution in the space
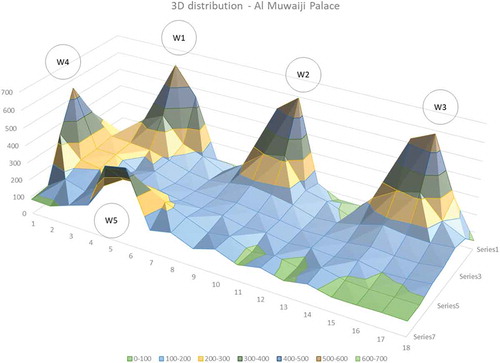
Table summarizes the measurement data obtained for the selected space of Al Muwaiji Palace. Indeed, the daylight factor of the space is less than 2%, and the average illuminance within the space is 179 lx, which is considered a low level of illuminance compared with the minimum standard to perform visual tasks that requires a minimum of 200 lx.
Table 2. Summary of the measurement data
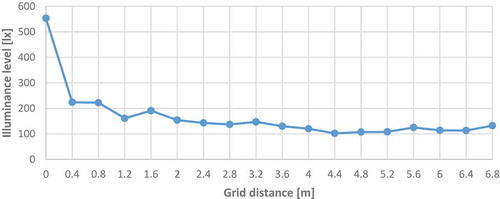
The illuminance level against the distance from W4 within the length of the space in the middle is shown in Figure . Indeed, the illumination level drops from 553 lx close to W4 to around 100 lx within the length of the space.
Figure 10. Illuminance level against the distance from W4
4.2. Fieldwork results of Al Ain palace
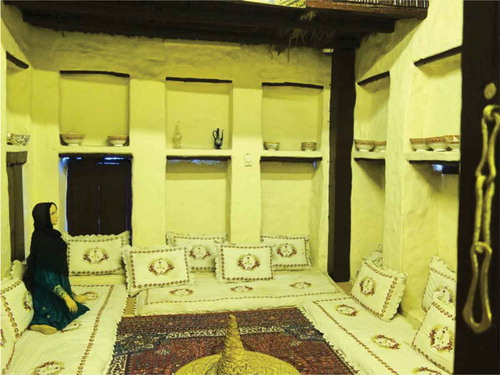
The main living room “Majlis” which is located at the northern side of the palace, overlooking to a big courtyard in the front, as shown in Figure , was investigated. The windows open from the north to the south sides. The south-side windows open to a shaded area by a distance of 3.8 m. The area and the opening dimensions of the space are shown in Table .
Figure 11. Selected space (Majlis) for Al Ain fort
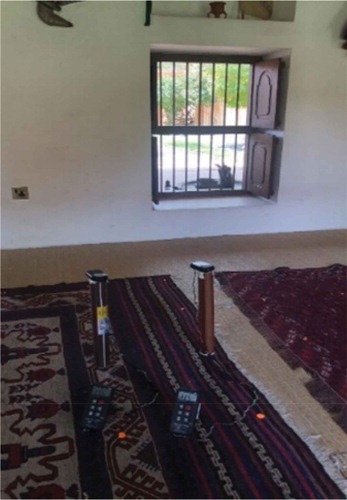
Table 3. Area and opening dimensions
Analysis of the isolux, as shown in Figure , reveals that the illumination level is unevenly distributed within the entire space, and the illumination levels are widely varied from more than 2000 lx to less than 100 lx in some locations within the space. Figure shows the three-dimensional daylight distribution in the space. The results clearly show that the highest range of illuminance levels are close to the windows, and as we move toward the center of the space, the illuminance levels gradually drop. We notice that W5, W6, W7, and the door have low levels of illumination because of the existence of a shading on the south side of the space, which is around 3.8 meters long.
Figure 12. Isolux plot of Al Ain fort
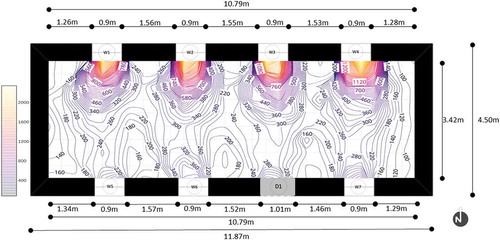
Figure 13. 3-D daylight distribution in the space
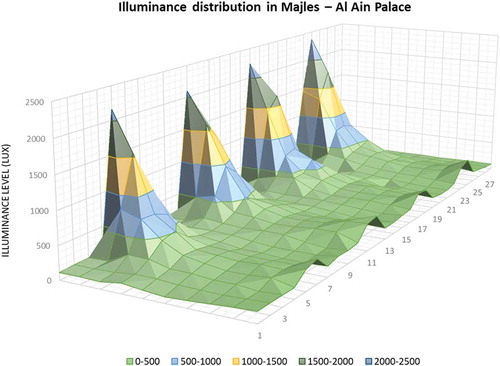
Table summarizes the measurement data obtained for the selected space of Al Ain palace. Indeed, the daylight factor of the space is 3.33%, and the average illuminance within the space is 350.8 lx, which is considered higher than the average required level of illuminance to perform visual tasks based on the IESNA standard.
Table 4. Summary of the measurement data
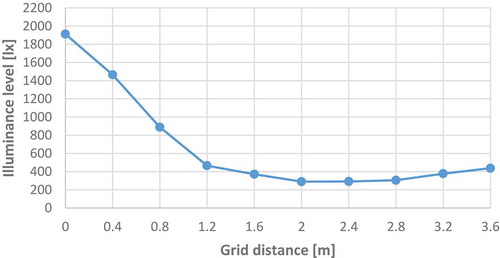
Figure shows the gradient change of the illumination level inside the space at the cross-section of the opposite openings (W2-W6). The maximum level of illumination is found in the north façade of the space around 2000 lx and drastically changes across the width of the space till 1.6 m, and then the variation of light is almost insignificant through the remaining distance till a slight increase of light at the opposite openings. The effect of those openings on the amount of light coming through them is very small because of the shade effect on the south wall of the space.
Figure 14. Illuminance level against the distance cross-section of W2–W6
4.3. Fieldwork results of UAQ fort
The investigated space is the ladies Majlis as shown in Figure . This room lies on the upper floor, and it faces the internal courtyard. From the other direction, it is also characterized by the originality of Arabic habits and traditions. The area and opening dimensions of the space are shown in Table 5.
Figure 15. Selected space (Majlis) for UAQ fort
Analysis of the isolux, as shown in Figure , reveals that the illumination level is unevenly distributed within the entire space, and the illumination levels are widely varied from more than 2000 lx near W4 and W5 to low levels in some locations within the space. Figure shows the three-dimensional daylight distribution in the space, and the results clearly show that the highest range of the illuminance levels are close to W4 and W5, and as we move toward the center of the space, the illuminance levels gradually drop.
Figure 16. Isolux plot of UAQ fort
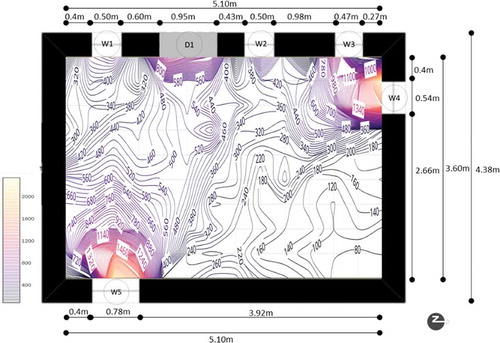
Figure 17. 3-D daylight distribution in Majlis
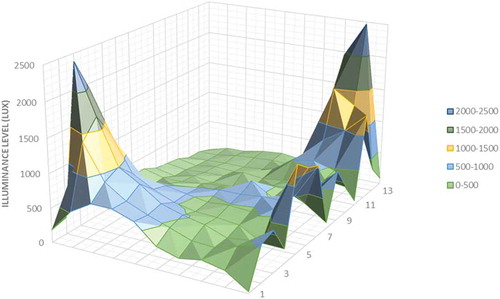
Table summarizes the measurement data obtained for the selected space of UAQ fort. Indeed, the daylight factor is the highest among the investigated spaces and reaches 4.48%, and the average interior illuminance is 470.66 lx, which is considered higher than the average required level of illuminance to perform visual tasks based on the IESNA standard.
Table 5. Area and opening dimensions
Table 6. Summary of the measurement data
4.4. Fieldwork results of Ajman Museum
The interior measurement was performed in the Majlis as shown in Figure using the appropriate grid. The detail of the space with the opening dimension is given in Table .
Figure 18. Selected space (Majlis) for Ajman fort
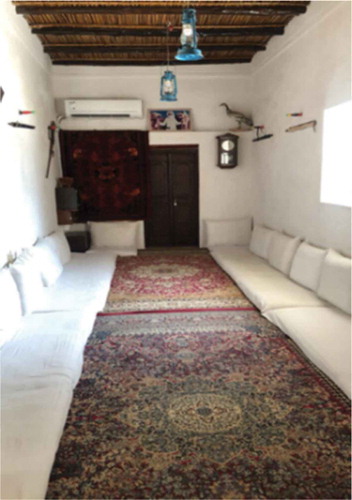
Table 7. Area and opening dimensions
Analysis of the isolux, as shown in Figure , reveals that the illumination level is unevenly distributed within the entire space, and the illumination levels are widely varied from more than 1500 lx in the vicinity of W1 to less than 50 lx in some corners of the space. Figure shows the three-dimensional daylight distribution in the space, and the result clearly shows that the highest range of the illuminance levels are within W1, and as we move toward the center of the space, the illuminance levels gradually drop.
Figure 19. Isolux plot of UAQ fort
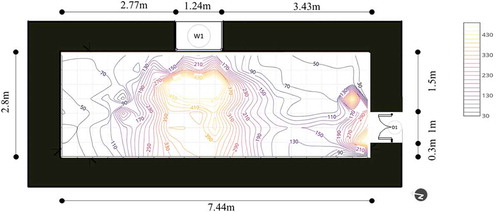
Figure 20. 3-D daylight distribution in Majlis
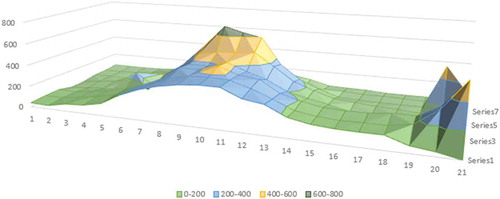
Table summarizes the measurement data obtained for the selected space of UAQ fort. Indeed, the daylight factor is the investigated space is below 3%, and the average interior illuminance is 182.46 lx, which is considered lower than the minimum required level of illuminance to perform visual tasks based on the IESNA standard.
Table 8. Summary of the measurement data
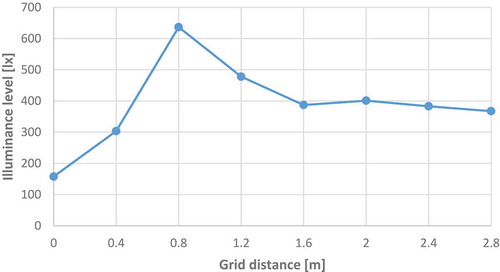
Figure shows the change of illuminance level from W1 within the depth of the space. Because of the high position of the window within the thick wall, the maximum illuminance (600 lx) is shifted from the wall by a distance of 0.8 m. Then the illuminance level decreases to around 400 lx at 1.6 m, and then kept constant for the rest of the distance.
Figure 21. Illuminance level against the distance from the window
5. Results and discussion
The diagnostic phase of the research focuses on the examination of the measured data. The average lighting level in each space is obtained and then compared with the standard lighting level. The comparison between the lighting levels in the spaces is obtained using three major parameters: (1) average illuminance, (2) daylight factor, and (3) window-to-floor ratio. The three previous parameters were calculated out of collected data:
Average illuminance (lx)
From the illuminance values measured using light meter from the chosen spaces, an average value is calculated. The average value is then compared between the spaces.
(b) Daylight Factor (DF)
DF is defined as the ratio of interior illuminance on a horizontal surface (Eint) to the exterior illuminance on a horizontal surface (Eext) given by EquationEquation 1(1)
(1) .
where Eint is the average interior illuminance and Eext is the exterior illuminance
(c) Window to Floor Ratio (%)
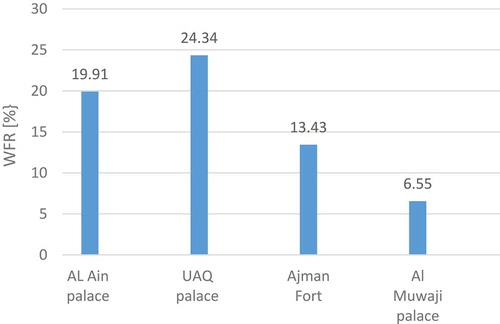
The average illuminance for all spaces is shown in Figure . One can see that the spaces selected for Al Ain Palace and UAQ Palace have high average illuminance of 351 lx and 471 lx, respectively. On the other side, the selected spaces for Ajman Fort and Al Muwaiji Palace present relatively low average illuminance of 182 lx and 179 lx, respectively. The two spaces of Ajman Fort and Al Muwaiji Palace are below the minimum required level of 200 lx based on the IESNA standard. It is clear that the daylight factor (DF) is related to the illuminance levels in the selected spaces, and as shown in Figure , the DF is the highest for UAQ Palace (4.48%) and the lowest for Al Muwaiji Palace (1.59%). Window-to-floor ratio (WFR) is a good indicator of the daylight level inside the spaces. Indeed, as shown in Figure , the result represents the same tendency as indicated by the DF. The maximum WFR is associated with the space of UAQ Palace (24.34%), and the lowest WFR is obtained for the space of Al Muwaiji Palace (6.55%).
Figure 22. Average illuminance for all spaces
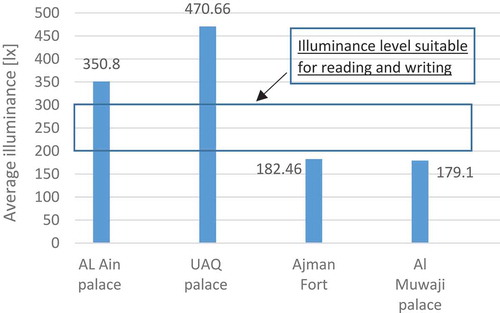
Figure 23. Daylight factor for all spaces
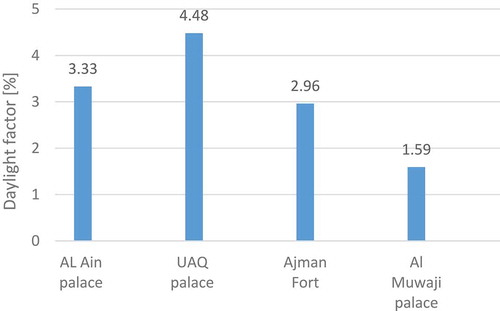
Figure 24. Window-to-floor ratio (WFR) for all spaces
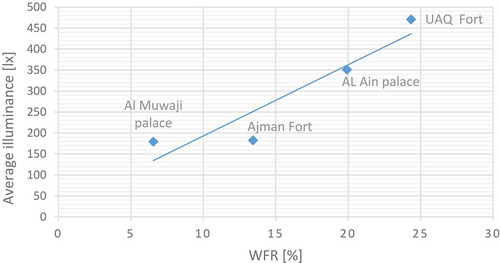
In addition to the above investigated parameters, a correlation between the average illuminance and the WFR for all spaces is plotted and shown in Figure . Indeed, the interior surfaces for each space associated with the type of finishing and colors have a huge impact on the internal reflections and on the level of illuminance for reading in each space. This correlation shows a small deviation from the average line for all spaces, which indicates that the selected spaces have similar attributes with regard to surface luminance and the comparison between the spaces is valid and the internal reflections do not affect the measured data.
Figure 25. Correlation between the average illuminance and the WFR for all spaces
6. Conclusion
The objective of this research is to investigate the daylight levels in old UAE forts by looking back in time when people only rely on daylight where there was no interference of artificial light during daytime. The measured data were compared with the international standards based on human needs to perform reading and writing tasks.
Indeed, the level of illuminance of the two selected spaces of Al Ain palace and UAQ palace, are above the required level of illuminance based on the IESNA standard for reading and writing tasks. However, the two spaces of the two remaining castles, Ajman fort and Al Muwaiji palace are found to have low illuminance levels, even below the minimum of 200 lx required by the IESNA standard. These two castles went through several deep renovation and restoration stages for several years. Indeed, Ajman fort and Al Muwaiji palace, which were initially built in the late eighteenth century and late nineteenth century, respectively, were restored in the late twentieth century. The most recent phase in a series of restorations at Muwaiji palace took place in the 1970s. But even before this, the fort was constantly repaired and renewed which may have a significant impact on the level of the daylight received inside spaces of the castle. The simulation approach which will be done as a future step of this study will allow us to get more significant data and be able to compare between the four forts considering the original design of the spaces and the castles.
This study is a preliminary approach to generalize the setting of UAE daylight standard based on window-to-floor ratio that can be used in the future to design well-illuminated similar spaces in the UAE. This study should be extended to other forts and castles in the UAE, and the measurement should be extended for different periods during the year. These findings are useful to architects and building designers to effectively address the light needs of UAE society.
Additional information
Funding
Notes on contributors

M. Khoukhi
Maatouk Khoukhi is an Associate Professor in Energy and Building Engineering Systems at United Arab Emirates University. He received his PhD in Mechanical Engineering from Tohoku University (Japan). He has developed expertise in building energy systems, building science, and building insulation materials. He has published more than 100 journal and conference papers. The total budget of his projects exceeds 5 Million USD.
A.M. Gomez
Engr. Ariel M. Gomez, MENG-EE, REE is a building electrical system designer and currently an Instructor in College of Engineering at United Arab Emirates University. He is presently actively involved in UAEU’s Summer Undergraduate Research Experience (SURE) program for exposing under graduate students to research works.
S. Al Kaabi
Shamma Al Kaabi, Worood Shbeikat & Heba Amairi are graduate students from Architectural Engineering Department at United Arab Emirates University.
References
- Al-Tamimi, N. A. (2015). Toward sustainable building design: Improving thermal performance by applying natural ventilation in hot–humid climate. Indian Journal of Science and Technology, 8(28), 1–19. https://doi.org/10.17485/ijst/2015/v8i28/83620
- Al-Tamimi, N. A., & Fadzil, S. F. S. (2012). Energy efficient envelope design for high-rise residential buildings in Malaysia. Architectural Science Review, 55(2), 119–127. https://doi.org/10.1080/00038628.2012.667938
- Baker, N., & Steemers, K. (2002). Daylight design of buildings – A handbook for architects and engineers. Routledge (February 1, 2002)
- Boyce, P., Hunter, C., & Owen, H. (2003). The Benefits of daylight through windows. (Literature review report) Lighting Research Center, Rensselaer Polytechnic Institute.
- Carmody, J. S., & Selkowitz, H. L. (1996). Residential windows - A guide to new technologies and energy performance. W.W. Norton & Company.
- Davis, L., Wang, S., & Lindridge, A. (2007). Culture influences on emotional responses to on-line store atmospheric cues. Journal of Business Research, 61(8), 806–812. https://doi.org/10.1016/j.jbusres.2007.08.005
- Doulos, L., Tsangrassoulis, A., & Topalis, F. (2008). Quantifying energy savings in daylight responsive systems: The role of dimming electronic ballasts. Energy and Buildings, 40(1), 36–50. https://doi.org/10.1016/j.enbuild.2007.01.019
- Eissa, H., Ferwati, S., & Khoukhi, M. (2010). Investigation of daylight adequacy for functional needs in old Omani forts. Final report for Internal Grant Project, IG/ENG/CAED/09/01. Internal Report.
- Fontoynont, M. (1999). Daylight Performance of Buildings. James and James.
- Guerin, D. A., & Mason, B. C. (1993). An experiential framework for international interior design education. Journal of Interior Design, 18(1–2), 51–58. https://doi.org/10.1111/j.1939-1668.1993.tb00072.x
- IEA (International Energy Agency), and SHC (Solar Heating and Cooling Program), (2000). A source book on daylighting systems and components. Final report of IEA SHC, energy conservation in buildings and community systems, Task 21. Lawrence Berkeley National Laboratory.
- IESNA (Illuminating Engineering Society of North America). (2000). The IESNA lighting handbook. reference and application (9th ed.). The IESNA.
- Ihm, P., Nemri, A., & Krarti, M. (2009). Estimation of lighting energy savings from daylighting. Building and Environment, 44(3), 509–514. https://doi.org/10.1016/j.buildenv.2008.04.016
- Lee, E. S., & Selkowitz, S. E. (2006). The New York times headquarters daylighting mockup: Monitored performance. Energy and Buildings, 38(7), 914–929. https://doi.org/10.1016/j.enbuild.2006.03.019
- Li, D. H. W., Lam, T. N. T., & Wong, S. L. (2006). Lighting and energy performance for an office using high frequency dimming controls. Energy Conversion and Management, 47(9–10), 1133–11145. https://doi.org/10.1016/j.enconman.2005.06.016
- Onaygil, S., & Guler, O. (2003). Determination of the energy saving by daylight responsive lighting control system with an example from Istanbul. Building and Environment, 38(7), 973–977. https://doi.org/10.1016/j.buildenv.2008.04.016
- Robbins, C. L. (1986). Daylighting Design and Analysis. Van Nostrand Reinhold Company.
- Shen, E., Hu, J., & Patel, M. (2014). Energy and visual comfort analysis of lighting and daylight control strategies. Building and Environment, 78, 155–170. https://doi.org/10.1016/j.buildenv.2014.04.028.
- Tregenza, P., & Wilson, M. (2011). Daylighting: Architecture and lighting design. Routledge.
- Wilson, M., Walker, J. H., Santamouris, M., & Jaure, S. L. (2002). Design process for energy efficient new and refurbished housing. University of North London.