
Abstract
At present, plant-based hard capsule such as hydroxypropyl methylcellulose (HPMC) has a high demand in drug delivery application but the production process is expensive with limited reactant supply. κ-carrageenan has been used as a gelling agent in HPMC hard capsule production. This study aims to develop gum Arabic (GA)-κ-carrageenan biocomposite, a potential material to produce hard capsule. The GA-κ-carrageenan biocomposite films were prepared at different κ-carrageenan weight ratios of 33% (GC33), 50% (GC50) and 67% (GC67) at constant concentration of polyethylene glycol and alginate. The control films of GA film and κ-carrageenan film were compared. The film and hard capsule formed from GC67 shows the highest tensile strength and capsule loop of 36.21 MPa and 34.11 N, respectively at 1058 mPa.s solution viscosity at 300 rpm shear rate. The hard capsule disintegrated at 7.30 min. The addition of GA is compatible to make the hard capsule surface smoother. Thus, this biocomposite has the potential to be developed for future hard capsule.
PUBLIC INTEREST STATEMENTS
Hard capsule is a versatile form of drug and nutraceutical formulation delivery. Present gelatin hard capsule has some drawbacks such as rapid release, which may cause gastric irritation and consumer concern of animal-based products. This work developed plant-based hard capsule from seaweed and gum Arabic to overcome the gelatin hard capsule drawbacks. Seaweed extract, κ-carrageenan is a renewable, cheap, and abundant material, which can customize the drug release time. This newly developed material is a potential prospect for vegetarian hard capsule product. It may fulfil and stabilize the hard capsule market demand in the global pharmaceutical industry.
1. Introduction
Hard capsule is a versatile oral drug delivery, which is mainly from gelatin source using the dip-coated technology. Gelatin can be porcine or bovine source (Karim & Bhat, Citation2008; Morrison et al., Citation1999; Yap & Gam, Citation2019). However, an awareness issue in the gelatin source and its status for some consumers such as Bovine Spongiform Encephalopathy (BSE) and religious dietary (Mutalib et al., Citation2015; Sha et al., Citation2018). All gelatin hard capsules are required to have the certification of BSE free (Sherry Ku et al., Citation2010). Many development works were conducted to replace of the gelatin-based hard capsule with plant-based hard capsule to resolve this issue. Consuming the plant-based hard capsule has the benefit to reduce the risk of BSE infection in human. Exploration of new plant material with strong cellulosic fiber from different plant materials such as Dracanea reflexa (Manimaran et al., Citation2019), Tridax procumbens (Vijay et al., Citation2019), Kenaf fiber (Khan et al., Citation2019) in the development of hard capsule is progressing. In their work, the extracted fibers demonstrated good tensile property as reinforced biocomposite due to its cellulose and hemi cellulose contents.
A new plant-based hard capsule was investigated from polysaccharide sources such as Hydroxypropyl methylcellulose (HPMC) (Al-Tabakha, Citation2010; Sherry Ku et al., Citation2010), modified starches (Bae et al., Citation2008; Ezan et al., Citation2017), pullulan (Sakata & Otsuka, Citation2009) and carrageenan (Abu Bakar & Adam, Citation2017; Hamdan et al., Citation2018) as the alternative source of material have also been done. As hard capsule, HPMC has the problem of large gap between the body and cap part, which causes leakage of the encapsulated drug (Sherry Ku et al., Citation2010). Starch hard capsules are usually produced by blending starch with other gelling agents such as HPMC (Zhang et al., Citation2013) and carrageenan (Bae et al., Citation2008) to promote gel formation. Pullulan hard capsule on the other hand has a lower mechanical strength (Vuddanda et al., Citation2017).
Seaweed maybe used as food packaging for example, a thin sheet of dry seaweed is an excellent sushi wrapper (Børresen, Citation2014). The food wrapping application can be further explored and developed from seaweed such as hard and soft capsule application for pharmaceutical product. Red seaweed Kappa carrageenan (κ) extract has been widely applied as a gelling agent in gelatin-free hard capsules production (He et al., Citation2017). The extracts may also be found from green seaweeds such as ulvans, brown seaweeds such as alginates and red seaweeds such as carrageenans (Zia et al., Citation2016). Seaweed has a valuable source of biological active compound (Chye et al., Citation2017).
κ- carrageenan is extracted from red seaweed mainly comes from two different species which are Eucheuma cottonii and Kappaphycus alvarezii extract (Jiao et al., Citation2011). κ-carrageenan consists of D-galactose residues linked alternately to 3-linked-β-D-galactopyranose and 4-linked-β-D-galactopyranose units (Prajapati et al., Citation2014). κ-carrageenan has one sulfate group per disaccharide repeating unit with 20% of ester-sulfate content and an average relative molecular mass above 100 kDa (Zia et al., Citation2016). Due to its excellent gelling ability, κ-carrageenan is commonly used as the gelling agent in the hard capsule production (Li, Ni, et al., 2014). Some studies were conducted by incorporating κ-carrageenan with other composite of natural polysaccharides such as chitosan, alginates and grapefruit seed to produce edible films (Paula et al., Citation2015; Tavassoli-Kafrani et al., Citation2016) and biodegradable food packaging (Kanmani & Rhim, Citation2014). An interaction between carrageenan and isovanillin was modeled to understand their molecule electronic surface potential and enthalpy in the physical crosslinking in the biocomposite for the hard capsule application. Hydroxyl (isovanillin)-sulfate (carrageenan) and aldehyde (isovanillin)-hydroxyl (carrageenan) points demonstrated strong hydrogen bonds at lengths of 1.74–1.79 Å (Adam et al., Citation2020).
Gum Arabic (GA) consists of galactose (40% of residues), arabinose (24%), rhamnose (13%) and glucuronic acid (23%) (Espinosa-andrews et al., Citation2007). It was found in plant based as a polysaccharide acid rich in calcium, magnesium, and potassium salts (Islam et al., Citation1997). GA has a complex structure and long chain with more than one different repeating monosaccharide units (Lopez-Torrez et al., Citation2015). Besides, it was used as an emulsifier (Y. Liu et al., Citation2014), tablet-coating agent (Lu et al., Citation2003) and as crosslinker in scaffold development (Sarika et al., Citation2014). GA is also suitable for edible film formation. However, it must be mixed with other materials such as protein (Li, Zhu, et al., 2014), starch (Apandi et al., Citation2013), and alginate (Tsai et al., Citation2017) to form edible film. This is because pure GA film exhibits brittleness problem (Jamaludin et al., Citation2017) and can crack easily. Thus, this work is to investigate the GA and semi refined κ-carrageenan (SRC) biocomposite film to improve the morphology and mechanical properties of the hard capsules, to seek its potential in the application of hard capsule.
2. Materials and methods
2.1. Materials
GA used was supplied by TIC Gum Co., Ltd. SRC was purchased from Takara Sdn Bhd, Sabah. Alginate and Polyethylene glycol (PEG 400) as plasticizer were purchased from Sigma Aldrich, Malaysia.
2.2. Raw material characterizations
Elemental composition and molecular weight analysis carbon, hydrogen, nitrogen, and sulfur (CHNS) elemental composition of GA and SRC was determined using fully automated PerkinElmer 2400 Series II CHNS/O Elemental Analyzer. About 2 mg were weighed in clean containers and introduced into the analyzer. The samples undergo oxidative decomposition and the subsequent reduction of nitrogen and sulfur oxides with the production of elemental gases as the final products: carbon dioxide (CO2), water (H2O), elemental nitrogen (N2), and sulfur dioxide (SO2). The concentration of each element in the sample was calculated automatically using the software supplied with the CHNS/O analyzer. The elemental composition of a sample is expressed in terms of the weight percent of each element in the compound.
Inductively Coupled Plasma with Mass Spectrometry (ICP-MS) on raw material samples using ICP-MS Spectrometer; Brand Agilent, Model 7500A. Due to the sample is in powder form, the sample preparation was carried out by using Ultrawave Digestor Instrument (Single Reaction Chamber Microwave Digestion System). Small amount (< 0.5 g) of sample were digested with 6 mL of nitric acid and 2 mL hydrogen peroxide in closed Teflon vessels. The temperature and pressure were controlled automatically using a computer interface. Once the digestion is completed, the samples were allowed to cool, and then diluted with high-purity water and ready for the ICP-MS analysis.
The molecular weight of GA and SRC was determined using gel permeation chromatography, GPC- Agilent 1260 A. The solution was prepared by dissolving 0.5 g of sample in 100 mL of ultra- pure water and stirred for an overnight to ensure that the sample was fully dissolved. The test solution was filtered using 0.45 mm nylon filter (Whatman, 13 mm). The mobile phase was water at a flow rate of 1 mL min−1.
2.3. Fourier transform infrared (FTIR) spectroscopy
FTIR spectra of GA, SRC, and biocomposite films were recorded on Fourier Transform Infrared Spectroscopy (FTIR) (Thermo Nicolet). About 4 mg of the dried samples were mixed with KBr powder (with the ratio of 1:10). Hydraulic press was used to form the sample pellets under 500 kg/cm2 pressure and placed on the sample disc. FTIR spectra were collected with 32 scans, and the spectral range is between 400 and 4000 cm−1 with 1 cm−1 interval.
2.4. Preparation of biocomposite solutions and biocomposite films
The biocomposite solutions were prepared by dissolving 6 g GA powder in 200 mL deionized water and heated at 70 °C under continuous stirring for 1 h. The SRC was added into the GA solution and mixing continued for another 2 h. Then, 0.5 g alginate and 1.5 g PEG 400 were added into the biocomposite solution and the solution was continuously stirred for 1 h. The GA and SRC biocomposite solutions were prepared to obtain a biocomposite solution with different mass ratios of SRC to GA, which were 33% w/w (GC33), 50% w/w (GC50) and 67% w/w (GC67), respectively. Hard capsules were prepared by dipping stainless steel mold pins (size 1) into the solutions and then drying at 37 °C. The hard capsules samples were labeled with GC33, G50, and GC67 for SRC composition of 33, 50, and 67% w/w. Controlled films were also prepared similar under similar conditions.
2.5. Solution Viscosity measurement
Viscosity of the solution was measured by a rotational rheometer equipped with LCT 25 4000010 geometry. For each tests, 16.5 mL of solution was poured into the Brookfield rheometer (Rheo 3000, USA) sample compartment of cup and bob type prior to the measurement. The sample then was analyzed using a programmed speed of 300 revolution per minute (rpm) of shear rate with 100 MPoints at constants 40 °C triplicate.
2.6. Hard capsule and film characterization
2.6.1. Mechanical properties of hard capsule and films
Tensile strength
The tensile strength of films was determined using Electronic Universal Testing Machine (VEW 260E, Victor, Malaysia), with 500 N load cell. The method was in accordance to ASTM D882-12 and crosshead speed of 50 mm min−1. Samples were cut into strip (20 × 100 mm) strips and thickness of films was determined as average of five random positions of the film samples using a Vernier callipers. Tensile machine was operated with initial grip separation of 80 mm, and crosshead speed of 50 mm/min (Hamdan et al., Citation2018).
Capsule loop
The capsule loop test was conducted by using CT3 Texture Analyzer (Brookfield, USA) with a capsule loop tensile fixture (TA-CLT) and was loaded with a 50 kg load cell. The capsule was mounted onto the pair of rods. The probe travels upwards with target value of 5.0 mm at a speed of 0.50 mm/s until the hard capsules were pulled apart and the applied force was recorded.
2.6.2. Thermal properties
Differential scanning calorimetry (DSC) measurements were carried out by a Q2000 DSC (TA instrument, USA). Approximately 3 mg of film samples were weighed into aluminum pan, and the thermal scan was run from 30 to 350 °C at a heating rate of 10 °C/min. Dry nitrogen was used as the purge gas at a flow rate of 50 mL/min. Thermal data were determined at least by triplicate on each sample. Meanwhile thermo-gravimetric analysis (TGA) was performed on a TGA-1 (Mettler Toledo Instrument) from room temperature to 600 °C with a heating rate of 10 °C/min under a nitrogen atmosphere.
2.6.3. X-ray diffraction (XRD)
XRD patterns of GA film, SRC film and biocomposite films were measured by a Rigaku Miniflex X-Ray Diffractometer equipped with a multichannel detector by the use of a Cu Ka1(k = 0.15406 nm) monochromatic X-ray beam. All the samples were measured within 2θ range of 3 to 60 degrees.
2.6.4. Surface morphologies
Scanning Electron Microscopy (SEM) was performed on hard capsule samples to study its surface morphology. It was conducted at an accelerating voltage of 10 kV on CARL ZEISS EVO50 Scanning Electron Microscope. The hard capsule samples were coated with a thin platinum layer before measurement to avoid charging effect due to electron accumulation for clear scanning.
2.6.5. Disintegration test
The disintegration test (DT) was carried out using the Distek Evolution 6100 (Belgium), at 50 rpm paddle speed with 37 ± 2 °C of 600 mL of deionized water accordance to U.S Pharmacopeia standard. Hard capsule was filled with lactose as placebo and assistance in the disintegration process. Disintegration time was recorded once lactose was released into the water.
2.7. One-way analysis of variance (ANOVA)
The Analysis of variance (ANOVA) was used to calculate the confidence level p-value with the testing null analysis (Ho) and alternative analysis (Hi) for solution viscosity, hard capsule thickness, capsule loop, tensile strength, and disintegration time of GC33, GC50, and GC67 sample formulation. The level of significance α = 0.05 was set for comparison of rejection value.
3. Results and discussion
3.1. Raw material characterizations
The elemental analysis shows the C, H, N, S compositions of GA are 40.693% (C), 5.927% (H), 0.100% (N), and 0.351% (S). The molecular weight of GA is 102.631 kDa at 8.6 min using gel permeation chromatography. The molecular weight of SRC was not determined because there was no any peak detected by the GPC analyzer. This may be due to the prepared concentration of SRC solution was too low during the measurement. Weight composition of 31.23% (C), 6.18% (H), 1.033% (N) and 2.483% (S) were analyzed from SRC. ICPMS analysis characterized the inorganic chemical elements such as sodium, and potassium of GA and SRC. GA has the highest amount of sodium and the lowest of potassium, which are 455,569.28 mg/L and 149.57 mg/L respectively, while SRC has less potassium at 65,909.09 mg/L and sodium at lower 4504.70 mg/L. The higher content of sodium in the GA contributes to its high solubility in water compare to SRC. Solubility of material decreased with the increase of the potassium content (Rhim, Citation2012). This is because the presence of potassium ions in SRC solution contributes to the double helix formation to form gel or viscous solution (Campo et al., Citation2009).
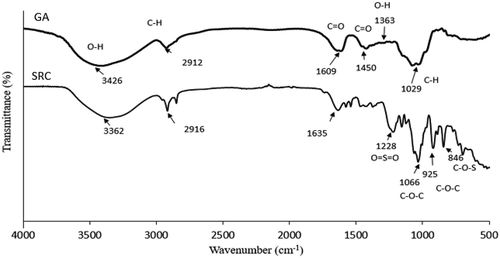
Fourier Transform Infrared Spectroscopy (FTIR) was carried out to identify and confirm the functional group in GA and SRC (Figure ). FTIR trend shows a broadband range from 3600 to 3000 cm−1, which represents the stretch of bonded hydroxyl (OH) (Selvakumaran & Muhamad, Citation2015). A band range of 3200–3600 cm−1 is attributed to the stretching of hydroxyl group of carrageenan and water (Husna et al., Citation2019). Band in the range of 3000 to 2700 cm−1 and 1800 to 1500 cm−1 describes the stretching of C-H bonds and the carbonyl groups (C = O), respectively (Nayak et al., Citation2012). κ-carrageenan has the finger-print region peaks at 1228, 925 and 846 cm−1, which attributed to the ester sulfate group (O = S = O), 3,6-anhydrogalactose (C-O-C), and galactose-4-sulfate (C-O-S), respectively (Ili Balqis et al., Citation2017; Sun et al., Citation2018). The peak at 1066 cm−1 was assigned to the stretch of the C-O-C glycosidic linkage. Abad et al. (Citation2003) has reported that glycosidic linkage in κ-carrageenan can be found at band range of 1010 to 1080 cm−1. The glucuronic acids of GA has specific vibrations at 1450 and 1363 cm−1 due to the C = O symmetric stretching and—OH bending, respectively (Bajpai & Kumari, Citation2015). Meanwhile, a broad band at around 1029 cm−1 represents the alkene C-H bend. The hydrogen bonding donor and acceptor of functional groups in both GA and SRC can improve the uniformity and compatibility of GA-SRC mixture to form the interaction in biocomposite film.
Figure 1. FTIR trends of gum Arabic (GA) and semi refined κ-carrageenan (SRC).
3.2. GA and SRC biocomposite films and hard capsule
In Figure , the increased amount of SRC from 33 to 67% has increased the solution viscosity to 1058 mPa.s at 300 rpm of shear rate at probability of rejection p-value = 0.0043 using level of significance α = 0.05. The higher viscosity increased the hard capsule thickness up to 0.115 mm at probability of rejection p-value = 0.0515. The incorporation of SRC did change the hard capsule thickness, but not significantly. A similar result was observed with other composite film such as carrageenan/grapefruit seed extract film (Kanmani & Rhim, Citation2014). The addition of 67% of SRC in the formulation produced a desirable thickness of the hard capsule. Based on this viscosity result, the solution with viscosity value above 600 mPa.s lead to the ability of the dipping bar to be dipped into the solution and formed the hard capsule. A simple test has been conducted to investigate the trend and behavior of aqueous carrageenan and GA solutions also the both mixture. It was observed that aqueous carrageenan (for CF sample) and gum arabic-κ-carrageenan (for GC33, GC50, GC67) demonstrated a non-Newtonian fluid trend. For aqueous GA solution (for GF sample), the viscosity reading could not be measured (0 mPa.s) for shear rate from 0 to 200 s−1. This unique property of GA solution is due to the presence of Arabinogalactan molecule in each GA molecule structure (Da Silva et al., Citation2015). The high water solubility and low viscosity properties of GA solution results in a high demand of GA as stabilizer in the food and drinks industry applications (Stephen & Churms, Citation2006). The addition of SRC in the GA solution showed an improvement in its rheology property, which are its solution viscosity and gelling properties.
Figure 2. Solution viscosity and hard capsule thickness at the different of SRC concentration.
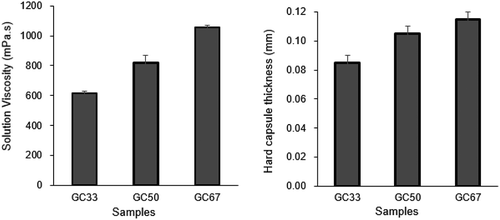
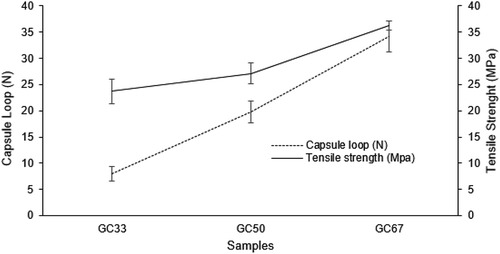
Figure shows the tensile strength and capsule loop results of the films and hard capsules, respectively. Tensile strength of SRC film is 25.51 MPa. However, the tensile strength of GA film was not able to be measured due to the brittleness of the formed film. The increased of the SRC in the GA solution showed the increased of the tensile strength, the capsule loop, and low brittleness of the biocomposite films. The tensile strength of GC33, GC50, and GC67 are 23.70 MPa, 27.12 MPa, and 36.21 MPa, respectively, while the capsule loop of GC33, GC50, and GC67 are 7.93 N, 19.83 N and 34.11 N, respectively. Both tensile strength and capsule loop have p-value of 0.00125 and 0.000072 values, respectively, at α = 0.05 from ANOVA test. Similar trend of the tensile strength was observed due to the effect of the increment in the material concentration has also been reported in manufacturing of agar-based film (Arham et al., Citation2016). The increased of the tensile strength is probably due to the interaction formation between two material components of GA and SRC film in the biocomposite film production.
Figure 3. Capsule loop and tensile strength of GC33, GC50 and GC67.
3.3. Thermal properties of mixed hard capsules
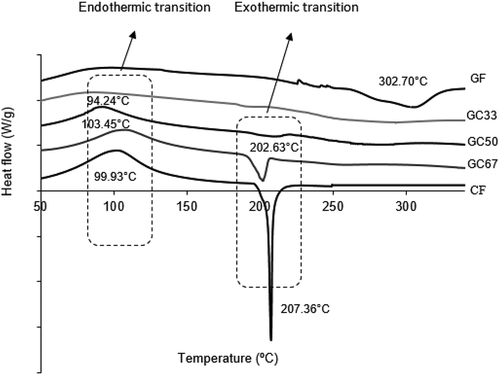
Figure shows the differential scanning calorimeter (DSC) thermogram of GF, CF, and the hard capsules with the addition of SRC, alginate and PEG 400 which are GC33, GC50, and GC67. The first exothermic peak may be associated with SRC degradation as demonstrated by Ili Balqis et al. (Citation2017). Meanwhile the second exothermic peak is contributed by the GA decomposition at a higher temperature, which is above 300 ºC as reported similarly by Zohuriaan and Shokrolahi (Citation2004). The changes of endothermic and exothermic transition trends of biocomposites were observed with the increased of the SRC weight percentage. The broad endothermic peak temperatures of GC50 and GC67 appeared clearly at 94.24 °C and 103.45 °C, respectively, as a similar trend of sample CF endothermic peak. These broad endothermic transitions correspond to the water desorption due to the hydrophilic nature of SRC (J. Liu et al., Citation2018). The DSC trend for GF demonstrated a broad exothermic peak at 302.70 °C. The exothermic peak temperature of GC67 shifted to 202.63 °C when the biocomposite was added up to 67% w/w of SRC. The exothermic peak of GC67 sample was found to be less sharp than CF. The change in the thermogram trend may be caused by the changes of the molecule structures in the GA and SRC biocomposite films.
Figure 4. DSC trend of GF, C33, GC50, GC67 and CF.
Thermal stability of biocomposite films from two polysaccharides investigated using TGA thermogram and DTG curves as shown in Figure . TGA thermogram shows a weight-decreasing pattern of the biocomposite films. DTG curve represents the peak at temperature with the maximum weight loss during thermal biocomposite film decomposition (Tmax). Thermal analyses show two significant thermal events for all the formulations (Figure ). The first stage of weight loss occurred at around 100 °C, which represents water evaporation, and bonded water through hydrogen bonds (Martins et al., Citation2012). The second stage at 200 to 450 °C with maximum peaks in the DTG curve (Figure ) is related to polysaccharide decomposition (Zohuriaan & Shokrolahi, Citation2004).
Figure 5. A) TGA and b) DTG trends of GF, GC33, GC50, GC67 and CF.
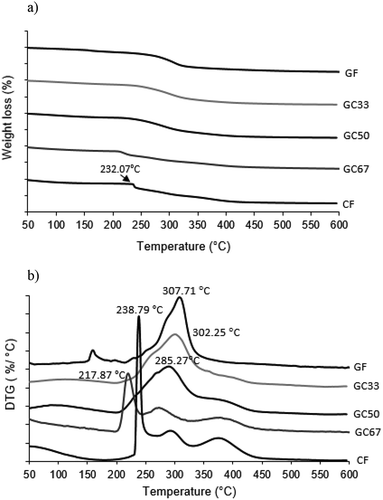
TGA trends of all samples demonstrate a similar trend except for GC67 and CF. Three samples including GF, GC33, and GC50 began to decompose rapidly at 200 ºC and completed at approximately 450 ºC with the final constant residue in the range of 24.21 to 25.95%. The weight loss during the thermal degradation of GF, GC33, and GC50 were 60.92, 60.98, and 60.99%, respectively. The lowest weight loss during the major film decomposition of GC67 was 53.69% with the final residue of about 30.79%. The DTG trend shows control sample, GF has the highest Tmax, which is 307.71 °C. In contrast, GC67 has the lowest Tmax value, which is 217.87 °C. After the incorporation of SRC, decomposition temperature was slightly decreased. The Tmax of the biocomposites and control films from DTG curves, were 302.25, 285.27, and 238.79 °C for GC33, GC50, and CF, respectively. These results imply that the addition of SRC altered the thermal stability of biocomposite films, whereby biocomposite film become less stable compared to the GF sample.
3.4. Solid state analysis
Figure shows the XRD graphs of the individual components of GA film, SRC film and biocomposite films. The results show that GF has different structures when compared to CF and biocomposite films. The XRD pattern for GF shows a broad peak with two narrow peaks at 2θ = 20.80º and 23.18°. These two peaks indicate that GA is partially crystalline in nature with dominant amorphous phase (Kaith et al., Citation2015). XRD pattern for CF illustrates the first broad band, and the second minor peak was observed at 2θ from 20° to 30°. It may be attributed to the κ-carrageenan-based film as demonstrated in previous studies (Azizi et al., Citation2017; Rhim & Wang, Citation2014; Selvakumaran & Muhamad, Citation2015). The presence of sharp peak at 2θ = 29.80° is probably due to inorganic salts such as potassium chloride (KCl) present in the κ-carrageenan films (Martins et al., Citation2012) and it is in agreement with the ICPMS analysis.
Figure 6. XRD pattern of gum Arabic film, semi refined κ-carrageenan film, and biocomposite films.
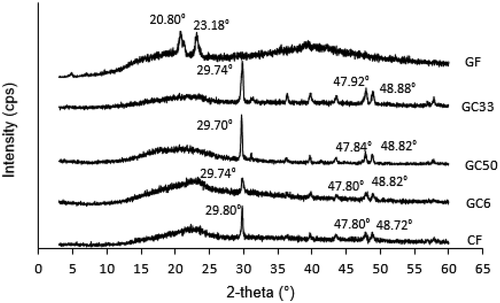
A change in XRD pattern of biocomposite films was observed when SRC was added. The two sharp peaks at 2θ of 20.80º and 23.18° disappeared. The broad amorphous band and a narrow peak were observed in the biocomposites XRD patterns. XRD patterns of all biocomposites demonstrated a broad peak at 23° and a narrow peak in the range of 2θ from 29.70° to 29.80º. It has followed some low diffraction peaks intensity at 2θ ranging from 47.80° to 48.88º. Characteristic peaks of GF completely changed due to the rearrangement of the polymer network and interrupted the interactions between the polymers. This suggests the formation of new biocomposite of GA and κ-carrageenan molecules as in agreement in the FTIR analysis.
3.5. FTIR analysis of samples
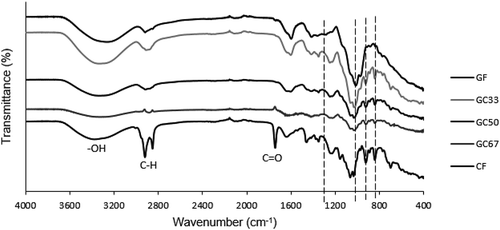
Figure shows the FTIR spectra of GF, GC33, GC50, GC67 and CF films. The bands at 1605 and 1743 cm−1 describe the stretching of the C = O in the D-galactose of GA and κ-carrageenan (Sun et al., Citation2018). The C-O stretching is from 1037 cm−1 (primary alcohol) to 1040 cm−1 (secondary alcohol) in κ-carrageenan and GA. Incorporation of SRC in biocomposite films, some new bands were observed between 400 cm −1 to 1034 cm−1 and 1240 cm −1 in the FTIR spectra of GC33, GC50 and GC67 biocomposite films. These bands are corresponding to sulfate ester, glycosidic linkages, 3,6-anhydrogalactose and galactose-4-sulfate ester in κ-carrageenan (Ili Balqis et al., Citation2017). The changes of polymer structures with the addition of SRC affected the mechanical properties of biocomposite films. Interaction between the functional groups of κ-carrageenan and GA may be due to van der Waals forces and hydrogen bonding. The changing of peak intensity and broadness of region 3200–3600 cm−1 for OH, 1635 cm −1 for NH and 1700–1800 cm−1 for C = O regions could be observed. They are the regions are the region of hydrogen bonding donor and acceptors. This suggests the hydrogen bonding formation in the biocomposite involved the hydrogen bond donor and acceptor in GA and SRC.
Figure 7. FTIR spectra of GF, GC33, GC50, GC67, and CF.
3.6. Surface morphology
Table presents the surface morphologies and hard capsule produces from the different weight ratios. From Table , GC50 and GC67 hard capsules show a rigid shape and translucent in appearance. GC33 is a flexible or stiff film when SRC amount is less. The surface morphology of GA film shows the smooth surface with some cracks. The presence of cracks on the GA film surface morphology is due to its brittleness property. In the biocomposite formulation, the interaction of more than two components and the polymer chain arrangement in the film matrix can influence the morphology result (Iahnke et al., Citation2015). The smooth surface without any phase separation on the biocomposite film shows the compatibility between the two materials when they were mixed uniformly (Zhang et al., Citation2013). In Table , the SRC film surface morphology suggests a rough surface due to its entanglement behavior. The CF film became entangled due to the water loss rapidly from CF film after the drying process. The addition of SRC into the GA film has changed the smooth surface to be a rough surface. In Table , it was determined that the samples started to disintegrate is less than 7.30 min through DT at probability of rejection p-value = 0.0493 using level of significance α = 0.05. In comparison to Hamdan et al. (Citation2018), the capsule carrageenan-cellulose nanocrystal started to disintegrate in less than 7.7 min. Addition of GA was able to reduce the disintegration time of carrageenan polymer of hard capsule biocomposite as GA is more soluble in water in comparison to carrageenan in water.
Table 1. Surface morphology for the various films at the different of SRC ratio
4. Conclusions
This study concludes that GA and SRC biocomposite is suitable and has the potential for the hard capsule application. The compatibility of GA and SRC composite was demonstrated by the increment of the viscosity solution at 67% of SRC addition (GC67). This reflects the molecular interaction between GA and SRC to produce homogeneous and viscous biocomposite solution with the dipping ability to form hard capsule. The thermal property trends of the biocomposites such as heat transitions and TGA were shifted to the lower temperature, similar to the SRC film trend. However, the film surface of bicomposite becomes rough when the contents of the SRC increased.
Supplemental Material
Download MS Word (28.6 KB)Acknowledgements
All authors would like to thank you to E-science fund research grant, project number 02-01-16-SF0086 from Universiti Malaysia Pahang.
Supplementary material
Supplemental data for this article can be accessed here.
Additional information
Funding
Notes on contributors
Fatmawati Adam
Fatmawati Adam is an Associate Professor in Universiti Malaysia Pahang of Chemical and Process Engineering Technology Faculty. Her research interests include advanced material, extraction process, environmental engineering, molecular modeling and crystallization process.
Jurida Jamaludin
Jurida Jamaludin is currently pursuing her master degree in Universiti Malaysia Pahang of Chemical and Process Engineering Technology Faculty.
Siti Hana Abu Bakar
Siti Hana Abu Bakar is currently pursuing her PHD degree in Universiti Malaysia Pahang of Chemical and Process Engineering Technology Faculty.
Ruwaida Abdul Rasid
Ruwaida Abdul Rasid is a Senior Lecturer in Universiti Malaysia Pahang of Chemical and Process Engineering Technology Faculty. Her research interests include renewable energy technologies, and process modelling and simulation, mathematic modelling and alternative fuel.
Zulkafli Hassan
Zulkafli Hassan is a Professor in Universiti Malaysia Pahang of Chemical and Process Engineering Technology Faculty. His research interests include oil and gas production technology and renewable energy from biomass.
References
- Abad, L. V., Relleve, L. S., Aranilla, C. T., & Rosa, A. M. D. (2003). Properties of radiation synthesized PVP-kappa carrageenan hydrogel blends. Radiation Physics and Chemistry, 68(5), 901–17. https://doi.org/10.1016/S0969-806X(03)00164-6
- Abu Bakar, S. H., & Adam, F. (2017). Determination of physical crosslink between carrageenan and glyoxylic acid using density functional theory calculations. Malaysian Journal of Analytical Sciences, 21(4), 979–985. https://doi.org/org/10.17576/mjas-2017-2104-25
- Adam, F., Hamdan, M. A., Hana, S., Bakar, A., Yusoff, M., & Jose, R. (2020). Molecular recognition of isovanillin crosslinked carrageenan biocomposite for drug delivery application for drug delivery application. Chemical Engineering Communications, 1–12. https://doi.org/10.1080/00986445.2020.1731802
- Al-Tabakha, M. M. (2010). HPMC capsules : Current status and future prospects. Journal of Pharmacy & Pharmaceutical Sciences, 13(3), 428–442. https://doi.org/10.18433/J3K881
- Apandi, N. A. A., Razak, N. A. S. A., Masri, M., Yusoff, S. F., & Lazim, A. M. (2013). A preliminary study on gum arabic as a binder in preparation of starch based edible plastic. International Journal of Advanced Science Engineering Information Technology, 3(2), 50–52. https://doi.org/10.18517/ijaseit.3.2.301
- Arham, R., Mulyati, M. T., Metusalach, M., & Salengke, S. (2016). Physical and mechanical properties of agar based edible film with glycerol plasticizer. International Food Research Journal, 23(4), 1669–1675. https://doi.org/10.17605/OSF.IO/5WKBJ
- Azizi, S., Mohamad, R., Abdul Rahim, R., Mohammadinejad, R., & Bin Ariff, A. (2017). Hydrogel beads bio-nanocomposite based on Kappa-Carrageenan and green synthesized silver nanoparticles for biomedical applications. International Journal of Biological Macromolecules, 104(December), 423–431. https://doi.org/10.1016/j.ijbiomac.2017.06.010
- Bae, H. J., Cha, D. S., Whiteside, W. S., & Park, H. J. (2008). Film and pharmaceutical hard capsule formation properties of mungbean, waterchestnut, and sweet potato starches. Food Chemistry, 106(1), 96–105. https://doi.org/10.1016/j.foodchem.2007.05.070
- Bajpai, S. K., & Kumari, M. (2015). A green approach to prepare silver nanoparticles loaded gum acacia/poly (acrylate) hydrogels. International Journal of Biological Macromolecules, 80, 177–188. https://doi.org/10.1016/j.ijbiomac.2015.06.048
- Børresen, T. (2014). Seaweed as aquatic food. Journal of Aquatic Food Product Technology, 23(3), 207. https://doi.org/10.1080/10498850.2014.897214
- Campo, V. L., Kawano, D. F., Da Silva, D. B., & Carvalho, I. (2009). Carrageenans: Biological properties, chemical modifications and structural analysis – A review. Carbohydrate Polymers, 77(2), 167–180. https://doi.org/10.1016/j.carbpol.2009.01.020
- Chye, F. Y., Ooi, P. W., Ng, S. Y., & Sulaiman, M. R. (2017). Fermentation-derived bioactive components from seaweeds: Functional properties and potential applications. Journal of Aquatic Food Product Technology, 27(2), 1–21. https://doi.org/10.1080/10498850.2017.1412375
- Da Silva, B. C., De Oliveira, M., Ferreira, J. G. L., Sierakowski, M. R., Simas-Tosin, F. F., Orth, E. S., & Riegel-Vidotti, I. C. (2015). Polyelectrolyte complexes from gum arabic and gelatin: Optimal complexation pH as a key parameter to obtain reproducible microcapsules. Food Hydrocolloids, 46, 201–207. https://doi.org/10.1016/j.foodhyd.2014.12.022
- Espinosa-andrews, H., Ba, J. G., Cruz-sosa, F., & Vernon-carter, E. J. (2007). Gum arabic - Chitosan complex coacervation. Biomacromolecules, 8(4), 1313–1318.https://doi.org/10.1021/bm0611634
- Ezan, S., Abidin, S. Z., & Adam, F. (2017). Synthesis and characterization of modified Sago Starch films for drug delivery application. Australian Journal of Basic and Applied Sciences, 11(3), 176–181.
- Hamdan, M. A., Adam, F., & Mohd Amin, K. N. (2018). Investigation of mixing time on Carrageenan-Cellulose Nanocrystals (CNC) hard capsule for drug delivery carrier. International Journal of Innovative Science and Research Technology, 3(1), 457–461.
- He, H., Ye, J., Zhang, X., Huang, Y., Li, X., & Xiao, M. (2017). κ-Carrageenan/locust bean gum as hard capsule gelling agents. Carbohydrate Polymers, 175, 417–424. https://doi.org/10.1016/j.carbpol.2017.07.049
- Husna, K., Hamid, A., Amnin, W., Yahaya, W., Alia, N., Mohd, Z., … Mohd, A. (2019). Semi ‐ refined carrageenan film incorporated with α ‐ tocopherol : Application in food model. (February), Journal of Food Processing and preservation, 43(5), 1–11. https://doi.org/10.1111/jfpp.13937
- Iahnke, A., Costa, T. M. H., De Oliveira Rios, A., & Flôres, S. H. (2015). Residues of minimally processed carrot and gelatin capsules: Potential materials for packaging films. Industrial Crops and Products, 76, 1071–1078. https://doi.org/10.1016/j.indcrop.2015.08.025
- Ili Balqis, A. M., Nor Khaizura, M. A. R., Russly, A. R., & Nur Hanani, Z. A. (2017). Effects of plasticizers on the physicochemical properties of kappa-carrageenan films extracted from Eucheuma cottonii. International Journal of Biological Macromolecules, 103, 721–732. https://doi.org/10.1016/j.ijbiomac.2017.05.105
- Islam, A. M., Phillips, G. O., Sljivo, A., Snowden, M. J., & Williams, P. A. (1997). A review of recent developments on the regulatory, structural and functional aspects of gum arabic. Food Hydrocolloids, 11(4), 493–505. https://doi.org/10.1016/S0268-005X(97)80048-3
- Jamaludin, J., Adam, F., Abdul Rasid, R., & Hassan, Z. (2017). Thermal studies on arabic gum - carrageenan polysaccharides film. Chemical Engineering Research Bulletin, 19, 80-86. https://doi.org/10.3329/cerb.v19i0.33800
- Jiao, G., Yu, G., Zhang, J., & Ewart, H. S. (2011). Chemical structures and bioactivities of sulfated polysaccharides from marine algae. Marine Drugs, 9(2), 196–233. https://doi.org/10.3390/md9020196
- Kaith, B. S., Sharma, R., Sharma, K., Choudhary, S., Kumar, V., & Lochab, S. P. (2015). Effects of O 7 þ and Ni 9 þ swift heavy ions irradiation on polyacrylamide grafted Gum acacia thin fi lm and sorption of methylene blue. Vaccum, 111, 73–82. https://doi.org/10.1016/j.vacuum.2014.09.020
- Kanmani, P., & Rhim, J.-W. (2014). Development and characterization of carrageenan/grapefruit seed extract composite films for active packaging. International Journal of Biological Macromolecules, 68, 258–266. https://doi.org/10.1016/j.ijbiomac.2014.05.011
- Karim, A. A., & Bhat, R. (2008). Gelatin alternatives for the food industry: Recent developments, challenges and prospects. In Food Science and Technology, 19(12), 644–656. https://doi.org/10.1016/j.tifs.2008.08.001
- Khan, A., Vijay, R., Singaravelu, D. L., Arpitha, G. R., & Sanjay, M. R. (2019). Extraction and characterization of vetiver grass (Chrysopogon zizanioides) and kenaf fiber (Hibiscus cannabinus) as reinforcement materials for epoxy. Integrative Medicine Research, 9(1), 773–778. https://doi.org/10.1016/j.jmrt.2019.11.017
- Li, C., Zhu, W., Xue, H., Chen, Z., Chen, Y., & Wang, X. (2014). Physical and structural properties of peanut protein isolate-gum Arabic films prepared by various glycation time. Food Hydrocolloids, 43(January2015), 322–328. https://doi.org/10.1016/j.foodhyd.2014.06.003
- Li, L., Ni, R., Shao, Y., & Mao, S. (2014). Carrageenan and its applications in drug delivery. Carbohydrate Polymers, 103, 1–11. https://doi.org/10.1016/j.carbpol.2013.12.008
- Liu, J., Wang, H., Wang, P., Guo, M., Jiang, S., Li, X., & Jiang, S. (2018). Films based on k-carrageenan incorporated with curcumin for freshness monitoring. Food Hydrocolloids, 83, 134–142. https://doi.org/10.1016/j.foodhyd.2018.05.012
- Liu, Y., Hou, Z., Yang, J., & Gao, Y. (2014). Effects of antioxidants on the stability of β-Carotene in O/W emulsions stabilized by gum arabic. Journal of Food Science and Technology, 52(6), 3300–3311. https://doi.org/10.1007/s13197-014-1380-0
- Lopez-Torrez, L., Nigen, M., Williams, P., Doco, T., & Sanchez, C. (2015). Acacia senegal vs. Acacia seyal gums – Part 1: Composition and structure of hyperbranched plant exudates. Food Hydrocolloids, 51, 41–53. https://doi.org/10.1016/j.foodhyd.2015.04.019
- Lu, E.-X., Jiang, Z.-Q., Zhang, Q.-Z., & Jiang, X.-G. (2003). A water-insoluble drug monolithic osmotic tablet system utilizing gum arabic as an osmotic, suspending and expanding agent. Journal of Controlled Release, 92(3), 375–382. https://doi.org/10.1016/S0168-3659(03)00371-7
- Manimaran, P., Saravanan, S. P., Sanjay, M. R., Siengchin, S., Jawaid, M., & Khan, A. (2019). Characterization of new cellulosic fiber : Dracaena reflexa as a reinforcement for polymer composite structures. Integrative Medicine Research, 8(2), 1952–1963. https://doi.org/10.1016/j.jmrt.2018.12.015
- Martins, J. T., Cerqueira, M. A., Bourbon, A. I., Pinheiro, A. C., Souza, B. W. S., & Vicente, A. A. (2012). Synergistic effects between κ-carrageenan and locust bean gum on physicochemical properties of edible films made thereof. Food Hydrocolloids, 29(2), 280–289. https://doi.org/10.1016/j.foodhyd.2012.03.004
- Morrison, N., Clark, R., Chen, Y., Talashek, T., & Sworn, G. (1999).Gelatin alternatives for the food industry physical chemistry and industrial application of Gellan Gum. In Physical chemistry and industrial application of Gellan Gum (Vol. 114, pp. 127–131). Heidelberg: Springer - Verlag. https://doi.org/10.1007/3-540-48349-7_19
- Mutalib, S. A., Muin, N. M., Abdullah, A., Hassan, O., Wan Mustapha, W. A., Abdullah Sani, N., & Maskat, M. Y. (2015). Sensitivity of polymerase chain reaction (PCR)-southern hybridization and conventional PCR analysis for Halal authentication of gelatin capsules. LWT - Food Science and Technology, 63(1), 714–719. https://doi.org/10.1016/j.lwt.2015.03.006
- Nayak, A. K., Das, B., & Maji, R. (2012). International journal of biological macromolecules calcium alginate/gum Arabic beads containing glibenclamide : Development and in vitro characterization. International Journal of Biological Macromolecules, 51(5), 1070–1078. https://doi.org/10.1016/j.ijbiomac.2012.08.021
- Paula, G. A., Benevides, N. M. B., Cunha, A. P., De Oliveira, A. V., Pinto, A. M. B., Morais, J. P. S., & Azeredo, H. M. C. (2015). Development and characterization of edible films from mixtures of κ-carrageenan, ι-carrageenan, and alginate. Food Hydrocolloids, 47, 140–145. https://doi.org/10.1016/j.foodhyd.2015.01.004
- Prajapati, V. D., Maheriya, P. M., Jani, G. K., & Solanki, H. K. (2014). Carrageenan: A natural seaweed polysaccharide and its applications. Carbohydrate Polymers, 105, 97–112. https://doi.org/10.1016/j.carbpol.2014.01.067
- Rhim, J. W. (2012). Physical-mechanical properties of agar/κ-carrageenan blend film and derived clay nanocomposite film. Journal of Food Science, 77(12), N66-73. https://doi.org/10.1111/j.1750-3841.2012.02988.x
- Rhim, J. W., & Wang, L. F. (2014). Preparation and characterization of carrageenan-based nanocomposite films reinforced with clay mineral and silver nanoparticles. Applied Clay Science, 97–98, 174–181. https://doi.org/10.1016/j.clay.2014.05.025
- Sakata, Y., & Otsuka, M. (2009). Evaluation of relationship between molecular behaviour and mechanical strength of pullulan films. International Journal of Pharmaceutics, 374(1-2), 33–38. https://doi.org/10.1016/j.ijpharm.2009.02.019
- Sarika, P. R., Cinthya, K., Jayakrishnan, A., Anilkumar, P. R., & James, N. R. (2014). Modified gum arabic cross-linked gelatin scaffold for biomedical applications. Materials Science & Engineering. C, Materials for Biological Applications, 43, 272–279. https://doi.org/10.1016/j.msec.2014.06.042
- Selvakumaran, S., & Muhamad, I. I. (2015). Evaluation of kappa carrageenan as potential carrier for floating drug delivery system: Effect of cross linker. International Journal of Pharmaceutics, 496(2), 323–331. https://doi.org/10.1016/j.ijpharm.2015.10.005
- Sha, X., Zhang, L., Tu, Z., Zhang, L., Hu, Z., & Li, Z. (2018). The identi fi cation of three mammalian gelatins by liquid chromatography-high resolution mass spectrometry. LWT - Food Science and Technology, 89, 74-86. https://doi.org/10.1016/j.lwt.2017.10.001
- Sherry Ku, M., Li, W., Dulin, W., Donahue, F., Cade, D., Benameur, H., & Hutchison, K. (2010). Performance qualification of a new hypromellose capsule: Part I. Comparative evaluation of physical, mechanical and processability quality attributes of Vcaps Plus®, Quali-V®and gelatin capsules. International Journal of Pharmaceutics, 386(1–2), 30–41. https://doi.org/10.1016/j.ijpharm.2009.10.050
- Stephen, A. M., & Churms, S. C. (2006). Chapter 1 introduction. In A. M. S. G. O. P. P. A. Williams (Ed.), Food polysaccharides and their application (2nd ed., pp. 1–93).Taylor & Francis.
- Sun, G., Liang, T., Tan, W., & Wang, L. (2018). Rheological behaviors and physical properties of plasticized hydrogel films developed from κ-carrageenan incorporating hydroxypropyl methylcellulose. Food Hydrocolloids, 85(May), 61–68. https://doi.org/10.1016/j.foodhyd.2018.07.002
- Tavassoli-Kafrani, E., Shekarchizadeh, H., & Masoudpour-Behabadi, M. (2016). Development of edible films and coatings from alginates and carrageenans. Carbohydrate Polymers, 137, 360–374. https://doi.org/10.1016/j.carbpol.2015.10.074
- Tsai, F.-H., Kitamura, Y., & Kokawa, M. (2017). Effect of gum arabic-modified alginate on physicochemical properties, release kinetics, and storage stability of liquid-core hydrogel beads. Carbohydrate Polymers, 174, 1069–1077. https://doi.org/10.1016/j.carbpol.2017.07.031
- Vijay, R., Singaravelu, D. L., Vinod, A., Sanjay, M. R., Siengchin, S., & Jawaid, M. (2019). International journal of biological macromolecules characterization of raw and alkali treated new natural cellulosic fi bers from Tridax procumbens. International Journal of Biological Macromolecules, 125, 99–108. https://doi.org/10.1016/j.ijbiomac.2018.12.056
- Vuddanda, P. R., Montenegro-Nicolini, M., Morales, J. O., & Velaga, S. (2017). Effect of plasticizers on the physico-mechanical properties of pullulan based pharmaceutical oral films. European Journal of Pharmaceutical Sciences, 96, 290–298. https://doi.org/10.1016/j.ejps.2016.09.011
- Yap, B. K., & Gam, L. (2019). Di ff erentiation of bovine from porcine gelatin capsules using gel electrophoresis method. Food Chemistry, 274(March2018), 16–19. https://doi.org/10.1016/j.foodchem.2018.08.111
- Zhang, L., Wang, Y., Liu, H., Yu, L., Liu, X., Chen, L., & Zhang, N. (2013). Developing hydroxypropyl methylcellulose/hydroxypropyl starch blends for use as capsule materials. Carbohydrate Polymers, 98(1), 73–79. https://doi.org/10.1016/j.carbpol.2013.05.070
- Zia, K. M., Tabasum, S., Nasif, M., Sultan, N., Aslam, N., Noreen, A., & Zuber, M. (2016). A review on synthesis, properties and applications of natural polymer based carrageenan blends and composites. International Journal of Biological Macromolecules, 96, 282–301. https://doi.org/10.1016/j.ijbiomac.2016.11.095
- Zohuriaan, M. J., & Shokrolahi, F. (2004). Thermal studies on natural and modified gums. Polymer Testing, 23(5), 575–579. https://doi.org/10.1016/j.polymertesting.2003.11.001