
Abstract
In this age of advanced technology, every university has a website to endorse their programs and encourage students around the world to join one of their faculties. However, universities give less attention to meet the users’ demands for visually attractive websites that satisfy their emotions. This study proposes a Kansei Engineering approach based on human emotion to identify elements of website design that are emotionally appealing to 18–37 year-old students in Turkish universities. A total of 22 Kansei words and 9 sample websites of Turkish universities were selected for the study. The sample consisted of 172 students, who were asked to evaluate the selected websites using Kansei words. A five-point semantic differential scale was used to evaluate the relationship between website elements and the Kansei words. The multivariate statistical methods factor analysis and partial least squares regression were used to implement the Kansei approach. The results displayed that Kansei Engineering methodology and multivariate statistical analyses played a key role in designing an attractive website in order to satisfy student’s emotions. It also showed that a pleasant university website should have top menu, small header size, logo on the left side and so on.
PUBLIC INTEREST STATEMENT
These days the main target of any university is a technologically advanced group of people; therefore, the first impression of your university will be your website. University website has diverse roles, it is a source of information of alumni, it is a hub of currently active students, it is also a source of academic research. Therefore, a university website design must be impressive in students feeling, it must be visually aesthetic and user’s friendly.
İt is from this background that we tried to investigate the relationship between students Kansei and the visual design of university websites. The findings displayed criteria of visually attractive university website includes white header background color, logo on the left side, large font size of the title and others. However, the final design of emotionally pleasant university website must be based on the combination of results from statistical analyses and creativity of website designer.
1. Introduction
Websites have become increasingly important as a communication medium of universities. In today’s world, every university wants to attract more attention, mainly towards students around the globe, through the creation of a website. To encourage and maintain visibility, most universities are establishing websites with a good design in terms of functionality and usability, but they may not be doing enough to meet users’ expectations and feelings.
The assumptions of many academic websites are based on the fact that users spend a few minutes in order to find maximum information, irrespective of whether they like the website or dislike it, which means that the primary emotional responses of the users are completely ignored. While universities are prioritizing functionality and usability, the users are, on the other hand, demanding emotionally interesting websites and this is where the major challenges arise. Norman (Citation2004) stated that there was a critical need for methodologies and procedures supporting the incorporation of emotional facets into product design, and that this emotional design should address the complex emotional relationships connecting objects to individuals (Norman, Citation2004).
The first impression of a website is an important factor of grasping the user’s attention and feelings (Lindgaard et al., Citation2006). The assumptions of designers are that users will enjoy features on the website, but this does not always happen. A vast majority of website users move from one website to another if the website does not attract their attention at first sight. If users feel unsatisfied with the website, they will abandon it and turn to others (Parush et al., Citation2005).
On the other hand, one of the most important features of quality website design is the visual design A well-designed website attracts the user’s attention and feelings while badly designed websites frustrate visitors. Poorly designed websites provide little value no matter how easy the website is to use and how clearly the information is organized. According to Song et al. (Citation2012) website design is a composite procedure that involves multiple technologies and knowledge, and one of the most important skills of website designers is to produce a functional site that also captures the user’s desired emotions and pleasure (Song et al., Citation2012).
Based on human needs Song et al. (Citation2012) have described a pyramid of priorities for website design (see Figure ) (Song et al., Citation2012). Functionality is the fundamental core property of a product. Without functionality, it is impossible to use the product at all. According to Song et al. (Citation2012), the second fundamental core of human needs from a product is usability, being able to use a product easily and in an understandable way that prevents the user from becoming frustrated (Song et al., Citation2012).
Figure 1. Hierarchy levels of human needs (Song et al., Citation2012).
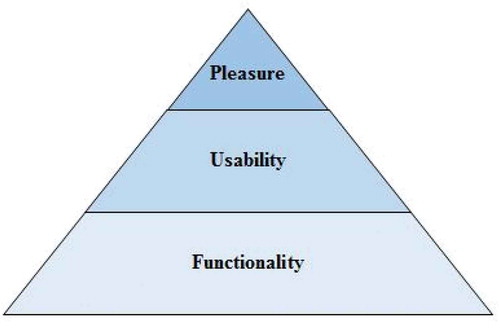
The third and final level of expectation of users from a product is pleasure, namely the emotions and feelings that products give users. Functionality and usability of a product are not aspects of deciding how pleasurable products are to use (Jordan, Citation1998). Jordan defines the pleasure in the product as “the emotional and hedonic benefits associated with product use”.
A website that brings positive emotions to users must meet all three levels. However, the first two levels (functionality and usability) can be easily improved, but the level of pleasure is difficult to achieve. Song et al. (Citation2012) made an attempt to introduce emotion in website design through the Kansei Engineering approach (Song et al., Citation2012).
The structure of this study is organized as follows. Section 2 consists of a literature review related to university website design. Section 3 presents the definition and types of Kansei Engineering. Section 4 describes the methodology of the research, the research instrument and procedure, the questionnaire design, the data collection method. Section 5 describes the statistical methods used, factor analysis and partial least squares regression. Finally, Sections 6 and 7 give concluding remarks and recommendations for website design.
2. Literature review
Turkey is located within the first 20 countries in terms of the number of universities in the world (www.webometrics.info) (RWWU, Citation0000). Every day, new universities are opened in Turkey, most of them constituting state universities, while others have foundation university status (The first university website in Turkey was created in 1993 for Middle East Technical and Bilkent Universities. Later, universities such as Ege, Boğaziçi and Istanbul Technical Universities followed. Nowadays, 206 universities in Turkey have their own websites (www.yok.gov.tr) (Council of Higher Education, Citation0000). These universities are continuing to use their web pages effectively as a visual communication tool, especially with students and other users.
The functional structure of Turkish university web pages has been studied in the literature. For example, university web page usability was measured according to five factors by Mentes and Turan (Citation2012) (Mentes & Turan, Citation2012). In another study, it is possible to see the accessibility of the university website (Kurt, Citation2011).
It is possible to come across case studies of the main departmental web page designs in both Turkish and foreign literature. In Turkey, it is possible to see website designs for the departments of English and Tourism studied by Zengin et al. (Citation2011) and Kaslı and Avcıkurt (Citation2008) (Zengin et al., Citation2019). Song et al. (Citation2012) designed a prototype website for the Engineering Management Department of the Technical University, Denmark, using the Kansei Engineering approach for the design process.
Thus, although there are some publications related to website design for some countries in the world, there are no publications specifically for Turkish universities. For example, a study of university website using Kansei Engineering was conducted by (Noori et al., Citation2015). In this study, the websites of 12 universities in Iran were examined and the websites with the best web portal application were determined (Noori et al., Citation2015). Another university web design study was performed by Bakaev et al. (Citation2016), who made an emotional analysis of students in an experimental study of 21 websites of German and Russian universities (Bakaev et al., Citation2016). They showed that two cultural groups differed in emotional perspectives for university website design with Kansei Engineering results. The Kansei approach, which is one of the product design approaches used in web page design, is covered in the following section.
2.1. The current work
The purpose of this study is to explore the relationship between student’s emotions and visual design of university websites by using Kansei Engineering type 1, also known as category classification and multivariate statistical analyses. Many published papers discuss functionality and usability of university website; however, only little consideration is given to the visual design; therefore, this study presents detailed example about requirement of an eye-catching website. Visually pleasant university websites can reinforce institutional credibility, enhance student’s satisfaction, and save time and money particularly in the developing countries where availability of internet is difficult. In this work, Kansei approach is used in the design of the website as in the work of the Song et al.
2.2. The Kansei approach
Emotions play an important role in product design process. There are several qualitative and quantitative methods to include emotions in this process. Kansei Engineering, which is a quantitative method, is used in product and service design by using customer emotions based on questionnaires. Its main purpose is to discover in what way some features of a product transmit certain emotions to its users (Almagro & Mazore, Citation2012). The Kansei approach is considered a technology that connects people’s emotions and feelings into product design in order to produce products that satisfy users’ expectations. Prof. Nagamachi at Hiroshima University founded Kansei Engineering in the 1970s after he identified that companies are interested to quantify the user’s impression of their products (Nagamachi, Citation2016). The term “Kansei” is a Japanese word that is used to indicate human feelings and impressions towards a particular product, artifact, or surroundings (Nagamachi, Citation2011). According to Lokman et al. (Citation2008), it is very difficult to translate the term to other languages because it is deeply related to Japanese culture—however, Lokman described a situation or mental state in which sentiments and feelings are harmonized (Lokman et al., Citation2008).
Kansei integrates Kansei and Engineering to grasp human emotions and feelings towards an existing product design, or one under development, in order to produce products that users will enjoy and be satisfied with. The purpose of Kansei is to exhibit the Kansei value of products that prompts emotional responses.
There are six different types of Kansei which have been proven and tested and the last three are very complex (Nagamachi, Citation1995). We will explain each type in a summarized way without giving extensive details.
2.2.1. Kansei type 1—category classification
This kind of Kansei involves using expressions known as Kansei words (KWs) that have links to the product. Kansei words are generally adjectives or verbs representing emotions, and then coded as five-point semantic differential (SD) scales (Schütte, Citation2002, Citation2005; Schütte et al., Citation2004).
2.2.2. Kansei type 2—Kansei Engineering system
The Kansei Engineering System is a computer-aided method of mapping people’s Kansei to the product properties. The information is stored in a database linking Kansei words with the properties of the product that were analyzed (Gaspar et al., Citation2013).
2.2.3. Kansei types 3—hybrid
This type is known as hybrid since it is a combination of both Kansei Engineering (Hsiao & Wang, Citation2012) and the use of a computer-assisted system (Hsiao & Wang, Citation2012).
2.2.4. Kansei types 4—mathematical
Mathematical Kansei Engineering, also known as Kansei Engineering modeling, constructs a mathematical model in order to assess the human feelings and perceptions using a series of Kansei words.
2.2.5. Kansei type 5—virtual
Virtual is an advanced technology capable of constructing a virtual space and provides an experience that is not possible to have in the real world. The main characteristics of Kansei type 5 are that the constructed space is adapted to the feelings of the users.
2.2.6. Kansei type 6—collaborative
This is a type of Kansei in which designers from different places work together in order to design a product via the internet. Each designer offers his/her idea about how the new product will look like; then, designers discuss and finally propose a new product design (Nagamachi, Citation2002).
3. Research methodology
3.1. Objectives of the study
To develop an attractive university website, students’ feelings must be given priority. The question asked in this study is: how can a university website in Turkey be made desirable from the point of view of emotion?
To answer this question, the relationship is investigated between the visible appearance of different websites and students’ feelings towards them. As part of this objective, the most influential KWs relating to website designs are selected, and these KWs are related to the design categories of the websites. Finally, categories are proposed that have the strongest positive influence on students.
3.2. Research instrument and procedure
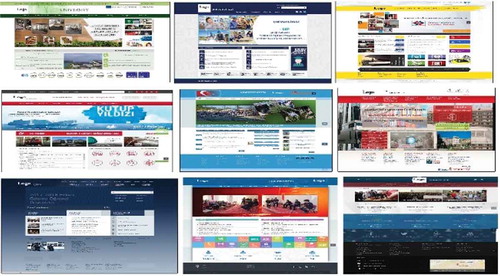
Initially, we manually selected the top 150 Turkish Universities based on the 2016 Ranking Web of World Universities (www.webometrics.info), which included both public and private universities (RWWU, Citation0000). Based on their visible appearance differences we selected nine websites (eight public universities and one private university) shown in Figure . These websites have a wide variety of homepage designs in terms of layout, colors and pictures.
Names and logos of the universities were removed from the website pages to avoid bias in the respondents’ emotional responses of the websites. The selected websites have an English version that is not different from the Turkish language version, but the native language was not changed (Jama, Citation2017).
Figure 2. Snapshots of websites used for the Kansei survey.
3.3. Collection of Kansei words
A total of 76 words that describe the visual design of websites were initially collected from magazines, users, designers and internet sources. These words were then reduced to 22 words by the taking into account the opinions of several experts in website design, such as graphics designers and computer programmers, and according to the literature as well as a pilot study.
3.4. Questionnaire design
A questionnaire was prepared to investigate the students’ preferences towards the nine selected websites. The 22 KWs were expressed as five-point semantic differential scales, with endpoints described by opposite adjectives. For example, the Kansei word “organized” defines a scale with extremes from “organized” to “messy”. In addition, four demographic questions were included: gender, age, academic year and the universities to which each student belonged to. All these questions were multiple choice.
3.5. Data collection method
In this study, non-probability sampling is used; we decided that convenience sampling was the easiest, cheapest, and the least time-consuming way to do our survey and to get more information within a short period. The target population of the study was the students who participated in the national Students Colloquium. The respondents came from seven different universities across Turkey and judging nine selected university websites. The students have different backgrounds in terms of education, gender and their major field of study.
We distributed 200 questionnaires and 172 of them were completed, while others were not returned or had more than 5% missing data. Before the students started filling in the questionnaire, we gave each student a brief introduction to KWs and website images and explained the five-point scales. Finally, SPSS 23 and XLSTAT software were used for the data analysis.
3.6. Limitation of the survey
This study was carried out under the limitations stated below.
One of the limitations is that during the evaluation, participants of the study did not interact with the websites; their evaluation was only based on visual design perception. For this reason, the result should only be interpreted in the context of visual impression.
Another limitation is that even though all students were active users of websites, most of them were not knowledgeable about website design. But they all had the capability and experience to evaluate their impression towards the appearance of websites.
Finally, we used non-probability sampling, specifically convenience sampling.
4. Statistical methods and analysis
Many multivariate statistical techniques are available for use in a Kansei Engineering study, specially Kansei Engineering modelling. For example, factor analysis (FA), used as a dimension reduction technique, and partial least square (PLS) regression, which can reveal the relationship between the KWs and variables related to the designs of the websites. A brief summary of these methods, as used in this study, follows.
4.1. Factor analysis
Factor analysis is a multivariate statistical technique used to reduce a large number of correlated variables to a smaller number of latent variables called factors, with minimum loss of information (Harman, Citation1976; Johnson & Wichern, Citation2007). Factor analysis takes two forms, confirmatory factor analysis and exploratory factors analysis.
Exploratory factor analysis, also called principal component analysis, is widely used in Kansei Engineering. This method was used here to reduce the large set of Kansei words into groups of similar words and this reduced the number of required variables (Mamaghani et al., Citation2014). This reduced set of KWs was then used in the next step of the analysis. In this application the factors were rotated to simple structure using varimax rotation with Kaiser normalisation (Johnson & Wichern, Citation2007).
4.2. Partial least squares regression
Partial least squares regression, developed by Hernan Ole Andreas Wold in 1975 is a popular multivariate statistical tool used to estimate relationships between variables (M. Nagamachi, Citation2011; Wold, Citation1975). PLS regression is designed to tackle the problem in multiple regression analysis when there are many inter-correlated predictor variables. PLS regression considers linear combinations of these variables as predictors, in a similar way as the method known as regression on principal components, thereby avoiding problems of possible collinearities.
In Kansei Engineering studies, Partial Least Square regression is used to model the relations between KWs (Y) which are response variables and the predictor variables, which are website design variable (X) in our case (Lokman et al., Citation2008). Thus, PLS reveals the impact of design categories on each of the Kansei words, showing the biggest positive values and biggest negative values for each design category (Lokman et al., Citation2009).
4.3. Analysis results
According to the factor analysis based on varimax rotation, Factor 1 has an eigenvalue of 20.16 and explains 91.7% of the total variance of the data, which represents the majority of the main factor contribution and captures the dominant effect of KWs. Factor 2 has an eigenvalue of 1.06, which is greater than 1, explaining 4.8% of the data, thus the first two factors explain 96.5% of total variability variance of the data. The remaining factors have smaller contributions, with eigenvalues less than 1 (which is the conventional cut-off value); thus, we restrict ourselves to a two-factor solution.
The rotated factor matrix in Table indicates the correlations between the variables (KWs) and the rotated factors F1 and F2. After varimax rotation table, each variable loads highly on one factor and loads less on the other factor.
Table 1. Factor loadings after varimax rotation
From Table we can identify that KWs such as “colorful”, “interesting”, “eye-catching”, “exciting”, “informative”, etc., load highly on factor 1; therefore, they can be grouped as an “aesthetic” or “visual attractiveness” factor. On the other hand, KWs such as “plain”, “orderly”, “elegant”, “organized”, etc., load highly on factor 2, so they can be grouped as a “personality” factor.
Figure 3. Scores of the nine websites on factors F1 and F2. Total variance explained is 96.5%.
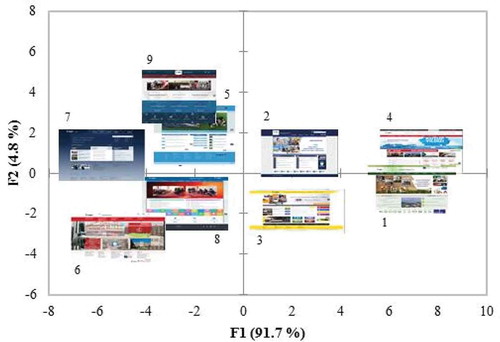
Figure shows the relationship of the nine websites with the factors. We can see that the websites are separated in this figure. Website 4 has the highest overall ratings of all participants and the second highest rating is website 1 followed by websites 1 and 2. However, website 7 on the left corner has the lowest ratings of all participants followed by the other websites.
Finally, we can conclude that the first four websites have a stronger positive impact on students’ Kansei, i.e. greater than average, and the last five websites have a stronger negative influence in students’ Kansei, i.e. less than average.
In the website design context, design elements are the different parts of the websites that are generally used by website designers and understood by the website users such as header background, logo, title font, header, footer, etc.; therefore, these items are divided into different categories. As illustrated in Table items are specific characteristics of each design elements such as header background color, location of the logo, title font size, and top menu existence and so on, while the categories are attributes of each item. For example, the header background color of a website is white, dark blue, orange, blue or grey. The location of the logo of website is on left, centre or right. As indicated in Table , 14 different items were spotted based on the attributes of the websites. Therefore, every single website was examined according to the 14 items in Table .
Table 2. Classification of items/categories
Table illustrates the categories were coded as dummy variables, with values of either 1 or 0. For example, the header background color, the value 1 means, that website 1 has a white header background color and the logo of that website located on the left side of the page, similarly website 2 has a dark blue header background color, while its logo located on the left side of the page. In order to propose an attractive website, we would examine the relationship between the students Kansei and websites using categories as independent variables. We used 41 categories from 14 different variables as predictors in Table . We selected all the other items using a similar process. Only partial results are shown in Table .
Table 3. Sample of the categories identified from websites
Table 4. The PLS regression results for three categories
After identifying, the dependent and independent variables, the next step is to use PLS by examining the relationship between the KWs that have the highest loadings in Table and the 14 design elements/items in Table . For purposes of simplicity, the words with the three highest loadings on each factor were chosen. In factor 1, candidate words were Colorful (0.917), Interesting (0.844) and Eye-catching (0.822), and in factor 2, the words Plain (0.967), Orderly (0.855) and Elegant (0.843).
Table demonstrates how the selected items/categories influence students’ responses on each of the six Kansei words. Categories with positive score values in each item have a strong positive influence on student’s Kansei and those with negative score values have a negative effect. For example, both white and orange colors have positive impact on students feeling. However, we selected white color for the header background color, because white has the strongest positive effect on student’s Kansei (feeling) towards websites compared to the orange color. In addition, blue, grey, and dark blue colors have a negative influence on student’s Kansei towards websites but here we are not considering negative influence; instead, we are looking for to choose only the items that have strongest positive influence, which is white color.
Approaching to the second item (location of the logo) of the data analysis in Table we can see that logo on the left side has the strongest influence on student’s Kansei for the website. For example, the dependent variable colourful has a value of 0.046, interesting has 0.024, eye-catching has a value of 0.034, while plain, orderly, and elegant has 0.003, 0.024, and 0.019 respectively. Meanwhile, logo on the right side and centre has a negative impression on student’s feeling. Considering the third item, which is the size of the text of the title, in Table , it is clear that both small and medium title font have a negative impact on student’s perceptions towards website but large font has a positive effect on student’s Kansei. Therefore, the title font size of a university website must be large.
From the results in Table , for each item, the strongest positive category is chosen. Nevertheless, if two or more categories have same values their mean and variance of the parameters are calculated regarding the Kansei words, and the category with the highest mean value is preferred. If there are categories with similar mean values, the category that has smallest variance is selected.
The purpose of calculating mean values and variances is because the category which has a higher mean value has a very high positive impact on student’s Kansei towards websites and the lower variance implies that the influence on Kansei words is balanced. Based on the statistical results from Table , the category “white” was picked for the header color of the website, the category “left” was selected for the location of the logo and finally, the category “large” was preferred to be chosen for title font size. We made further analysis in each category and results are summarized in Table .
Table 5. Chosen positive effect for 14 categories based on the PLS regression results
Notice that a website with higher score does not necessarily indicate all of its categories were designed in a proper style, and accurately designed. The purpose and philosophy of the university, and the designer’s creativity skills are also considered to be important factors when designing visibly an attractive website.
5. Conclusion, recommendations, and future work
5.1. Conclusion
The study begins with the collection of nine sample websites based on their limited physical appearances and 22 pairs of Kansei words related to the visual design of the sample websites were collected. To evaluate student’s Kansei, the study proposes a 5-point semantic differential scale, and finally, Kansei words and the sample websites were put together side-by-side on one page. The target population of the study was Turkish students studying at universities in Turkey, and 172 students from seven Turkey universities, between the ages of 18 to 37 years participated in the study. Male (88) and female (84) students have an approximately equal proportion to the participation in the study.
To investigate student’s Kansei towards website of the sample universities and explore categories of websites that highly influence student’s feelings we used exploratory factor analysis and partial least squares regression. Factor analysis was performed to determine the number of factors, the structure of the Kansei words, and the relation between student’s Kansei responses and the sample website. The Factor analysis displayed that the KWs are structured as two factors. The first two factors explained 96.5% of the total variance of the data.
In addition, we performed PLS regression to inspect the relationship between Kansei words and website items/categories and to interpret student’s Kansei responses to website design. Some of the categories that this study recommended are included, white header color, logo on the left side of the website, and small font title has a positive impact on student’s perceptions towards the website.
5.2. Recommendations
The study recommends the Information Technology (IT) professionals, particularly web designers, researchers, and universities, to carefully choose webpage categories before designing it. According to the statistical outcome of the study, web designers and universities should select a white color as a header background, the logo should be on the left side, and university title font must be large font not small and medium when designing an academic website. To design a visibly attractive website that elicited student’s Kansei, the header size of the website should be small and the footer size must be large. Some of the other major recommendations of the study are included in Figure .
Footer color should be yellow
Web page must have a top menu button
Main body background color of the web page should be white
The main font color must be blue, white and green
There must 11 and more pictures on the website including small, medium and large pictures. six and more small, 2 and more large, and 5 and more small, large and medium pictures, respectively.
There should not be a video button on the website.
Compared these results to others, which are relevant to website design in Kansei Engineering application, Song et al. (Citation2012) found KWs like dynamic, exciting, bright, modern, beautiful, enjoyable, and well-structured highly influenced emotions (Song et al., Citation2012). Song and his friends also recommended that an emotional website should have medium header size, dark red header background color, medium title font size, and large footer size.
These results are based on statistical analyses. However, even though they are statistically significant it is irrational to have a mixture of these categories. Practically it is impossible to clearly see blue, white and green fonts with white body background color.
Furthermore, a university website with too many pictures may appear to be undesirable to some people. For all these details, the final design would be a combination of outcome from Factor Analysis and Partial Least Squares regression and other considerations including creativity and experiences of the web designer.
Figure 4. Proposed universal design of an attractive university website.
5.3. Future work
In this study, evaluation was only based on visual design perception. Therefore, in order to expand the scope of the study and methods used, further research will be performed by allowing participant to directly interact with the web pages. Even though, the application of Kansei Engineering type 1 (category classification) and statistical analyses seen to provide solution to designing a visually pleasant website, the effectiveness of the design we proposed in our study (Figure ) has not been tested. We will deal with these issues in our future work.
Additional information
Funding
Notes on contributors
Saed Jama Abdi
Saed Jama Abdi had a bachelor degree in Mathematics and Statistics and master’s degree in Applied Statistics from University of Hargeisa/Somalia in 2011 and Anadolu University, Eskisehir/Turkey in 2017, respectively.
He is currently working as Statistics lecturer at Admas University and New Generation university college campuses in Hargeisa/Somalia. He previously participated Correspondence Analysis and Related Methods Conference, Stellenboch/South Africa in February 2019, and International Conferences on Computational and Statistical Methods in Applied Science, Turkey in November 2017, were he presented academic papers. His research area of interest is Multivariate Statistical Analyses, such as Factor Analysis, Principal Component Analysis, Regression Analysis, and Kansei Engineering.
References
- Almagro, M. L., & Mazore, X. T. (2012). Statistical methods in Kansei Engineering: A case of statistical engineering. Quality Reliability Engineering International, 28(5), 568–14. Volume 28, Issue 5. https://doi.org/10.1002/qre.1434
- Bakaev, M., Gaedke, M., & Heil, S. (2016). Kansei engineering experimental research with university websites. Chemnitzer Informatik-Berichte, 1–24.
- Council of Higher Education. Turkish Council of Higher Education.http://www.yok.gov.tr/en
- Gaspar, E., Claus, V. R. M., da., F. S., Knapik, L., & Marcos, A. V. (2013). Kansei engineering: Types of this methodology. In S. Fukuda (Ed.), Emotional engineering. 2 (pp. 127–147). Springer.
- Harman, H. H. (1976). Modern factor analysis (3rd ed.). The University of Chicago Press.
- Hsiao, H., & Wang, W. W. (2012). Fuzemotion as a backward kansei engineering tool. International Journal of Automation and Computing, 9(1), 16–23. https://doi.org/10.1007/s11633-012-0611-y
- Jama, A. S. (2017). University website design with multivariate statistical techniques in kansei engineering. Unpublished Master Thesis. Anadolu University.
- Johnson, R. A., & Wichern, D. W. (2007). Applied multivariate statistical analysis (6th ed.). Prentice-Hall.
- Jordan, P. W. (1998). Human factors for pleasure in product use BBB. Applied Ergonomics, .29(1), 25–33. https://doi.org/10.1016/S0003-6870(97)00022-7
- Kaslı, M., & Avcıkurt, C. (2008). An investigation to evaluate the websites of tourism departments of universities in Turkey. Journal of Hospitality, Leisure, Sport and Tourism Education, 17(2), 77–92. https://doi.org/10.3794/johlste.72.194
- Kurt, S. (2011). The accessibility of university web sites: The case of Turkish universities. Universal Access in the Information Society, 10(1), 101–110. https://doi.org/10.1007/s10209-010-0190-z
- Lindgaard, G., Fernandes, G., Dudek, C., & Brown, J. (2006). Attention web designers: You have 50 milliseconds to make a good first impression. Behaviour & Information Technology, 25(2), 115–126. https://doi.org/10.1080/01449290500330448
- Lokman, A. M., Noor, N. L. M., & Nagamachi, M. (2008). Kansei database system for emotional interface design of e-commerce website. The fourth international cyberspace conference on ergonomics (Cyberg 08), (Online Conference) pp.1–13.
- Lokman, A. M., Noor, N. L. M., & Nagamachi, M. (2009). Expertkanseiweb: A tool to design kansei website. In International conference on enterprise information systems (pp. 894–905). Springer.
- Mamaghani, N. K., Rahimian, E., & Mortezaei, S. (2014). Kansei engineering approach for consumer’s perception of the ketchup sauce bottle. In International Conference on Kansei Engineering and Emotion Research. Keer, Linköping. http://dqi.id.tue.nl/keer2014/programme.php
- Mentes, T., & Turan, A. H. (2012). Assessing the usability of university websites: An empirical study of Namık Kemal University. The Turkish Online Journal of Educational Technology, 11(3), 61–69. https://eric.ed.gov/?id=EJ989199
- Nagamachi, M. (1995). Kansei engineering: A new ergonomic consumer-oriented technology for product development. International Journal Industrial Ergonomics, 15(1), 3–11. https://doi.org/10.1016/0169-8141(94)00052-5
- Nagamachi, M. (2002). Kansei engineering in consumer product design. Ergonomics in Design: The Quarterly of Human Factors Applications, 10(2), 5–9. https://doi.org/10.1177/106480460201000203
- Nagamachi, M. (2011). Kansei/affective engineering and history of Kansei/affective Engineering in the world. Kansei/Affective Engineering. CRC Press.
- Nagamachi, M. (Ed.). (2016). Kansei/affective engineering. CRC press.
- Noori, F., Zadeh, S. S., & Kazemifard, M. (2015). Designing a university web site by considering users’ emotion and using Kansei engineering. In International conference of cognitive. Institute for Cognitive Science Studies.
- Norman, D. A. (2004). Emotional design: Why We Love (or Hate) everyday things. Basic Civitas Books.
- Parush, A., Shwarts, Y., Shtub, A., & Chandra, J. M. (2005). The impact of visual layout factors on performance in web pages: A cross-language study. Human Factors: The Journal of the Human Factors and Ergonomics Society, 47(1), 141–157. https://doi.org/10.1518/0018720053653785
- Ranking web of world universities. http://www.webometrics.info.
- Schütte, S. T. W. (2002). Designing feelings into products: Integrating kansei engineering methodology in product development. Licentiate Thesis, Linköpings Universites Printings, The Institue of Technology. 946.
- Schütte, S. T. W. (2005). Engineering emotional values in product design: Kansei engineering in development. Doctorate Thesis, Linköpings Universites, The Institue of Technology.
- Schütte, S. T. W., Eklund, J., Axelsson, J. R. C., & Nagamachi, M. (2004). Concepts, methods, and tools in kansei engineering. Theoretical Issues in Ergonomics Science, 5(3), 214–231. https://doi.org/10.1080/1463922021000049980
- Song, Z., Howard, T. J., Achiche, S., & Özkil, A. G. (2012). Kansei engineering and web site design. In Computers and information in engineering conference. Volume 2: 32nd Parts A and B (Vol. 2, pp. 591–601).
- Wold, H. (1975). Path models with one or two latent variables. In Quantitative sociology (pp. 307–357). Seminar Press.
- Zengin, B., Arikan, A., & Dogan, D. (2011). Opinions of english major students about their departments'. Contemporary Educational Technology, 2(4), 294-307. https://doi.org/10.30935/cedtech/6060
- Zengin, B., Arikan, A., & Doğan, D. (2019). Opinions of english major students about their departments1 websites. Contemporary Educational Technology, 2(4), 294–307. https://doi.org/10.30935/cedtech/6060