
 ?Mathematical formulae have been encoded as MathML and are displayed in this HTML version using MathJax in order to improve their display. Uncheck the box to turn MathJax off. This feature requires Javascript. Click on a formula to zoom.
Abstract
Geographical Information System (GIS) is a powerful tool for representing huge data and producing an actual visualization of subsurface information and parameters in the form of 3D scenes that can be used by the geotechnical engineers in the design of footing and foundation. This paper focuses on producing digital geotechnical maps for the main geotechnical parameters that can be used in the preliminary design stage. Considerable data of 164 borehole logs presenting a 17,000 km2 (i.e. Wasit province, south of Baghdad, Iraq) are collected, analyzed, tabulated in an excel sheet, and used as input data to create the digital maps. The studied parameters are bearing capacity, shear strength, coefficient of consolidation, compressibility parameters, and groundwater levels. The results show that the GIS technique is a great tool to visualize the geotechnical parameters that can be easily used directly in the assessment of the site investigation reports and even in the foundation design. The digital values of the bearing capacities, shear strength, and compressibility parameters are clearly visualized and accurately replicate the soil layers of the study area. However, other geotechnical parameters are needed to further consider it in more digital maps.
PUBLIC INTEREST STATEMENT
Geographical Information System (GIS) is a powerful tool for representing huge data and producing an actual visualization of subsurface information and parameters in the form of 3D scenes that can be used by the geotechnical engineers in the design of footing and foundation. This paper focuses on producing digital geotechnical maps for the main geotechnical parameters that can be used in the preliminary design stage. Considerable data of 164 borehole logs presenting a 17,000 km2 (i.e. Wasit province, south of Baghdad, Iraq) are collected, analyzed, tabulated in an excel sheet, and used as input data to create the digital maps. The studied parameters are bearing capacity, shear strength, compressibility parameters, and groundwater levels. The results show that the GIS technique is a great tool to visualize the geotechnical parameters that can be used in the assessment of the site investigation reports. The preliminary assessment of the site investigation report can be accomplished for any project based on the digital maps.
1. Introduction
The soil site investigation is one of the main important steps before the construction of infrastructures. It includes a collection of disturbed and undisturbed specimens at different depth levels under the ground surface and many geotechnical tests are performed to these specimens to determine different parameters that are widely and commonly used by a geotechnical designer to select proper footing and foundation design.
In geotechnical practice, the traditional procedure for data collection in situ can be a laborious job. Existing historical data sources in the form of hard, electronic and paper copy, such as maps, site investigation reports, manuals and even photos which can be integrated with Less time may be spent using GIS digital mapping platform as a tool to improve the efficiency and effectiveness (Player, Citation2006).
Geological and geographical engineers produced a new technique to collect, store, manage, retrieve, visualize, and analyze all types of site investigation data. Digital maps and other graphic information can be displayed using the GIS for analyzing, presenting, and producing the right vision for the designer.
This type of technique was used widely around the world for the last two decades. In Faisalabad, the second-largest in the eastern province of Punjab, 200 km south of Pakistan capital, Islamabad, the GIS technique is proved by investigating the allowable bearing capacity and the foundation information simply regarding the foundation types for different structures (Kamal et al., Citation2016). In Toshka city, new valley governorate, south of Egypt, the expansive soil and the swelling characteristics of the clays for the soil strata have been considered and different digital GIS maps were created (Labib & Nashed, Citation2013).
Data of 464 boreholes are collected and tabulated using an excel sheet and the GIS software is used to investigate the allowable bearing capacity of Al-Najaf and Al-Kufa city, southwest of Baghdad, Iraq (Al-Maliki et al., Citation2018). Geo-hazard warning system including the rainfall prediction is modeled and tested using the functions of the GIS system (Al-Maliki et al., Citation2018).
The hazard warning system is implemented using GIS technology to determine the warning dissemination due to disaster and risk assessment is also evaluated (Ghosh et al., Citation2015). The functionality is to be modular in architecture having GIS-graphical user interface (GUI), input, understanding, rainfall prediction, expert, output, and warning modules (Bhattacharya et al., Citation2014). The variability of the quality and depth of the groundwater in Delhi City is investigated using the GIS technique (Gupta & Sarma, Citation2016). A digital terrain map is prepared and analyzed in the north of Thailand that was integrated from different data of existing maps (Liengsakul et al., Citation1993). Many other studies are implemented to produce digital maps for different soil properties in the south of Iraq (i.e. Kadhim & Al-Abody, Citation2015; Al-Baghdadi, Citation2016; Camera et al., Citation2017 & Al-Shukriji & Al-Khuzaie, Citation2011). Hellawell et al. (Citation2001) concluded that the GIS-enabled creation and visualization of site investigation data and search procedures quickly became the tool of choice. Subsequently, this gives opportunities for analysing data and enhancing the engineers’ capabilities of the project.
The GIS is used for the preparation of a terrain mapping unit (TMU) map which integrates data from existing maps and data interpreted from satellite images.
However, utilizing big data and dealing with a large area has never been done to cover all the geotechnical characteristics of soil (i.e. the physical and mechanical properties). Such a large amount of data will give greater accuracy to the engineers at the preliminary design stage to select the proper foundation for the project. Such a digital map will help the geotechnical engineers to get an indication and obtain significant information about the soil layers and decide the kind of footing in preliminary studies and even in feasibility studies.
In this paper, extensive site investigation data results of tens of boreholes (i.e. 146 boreholes) are collected, classified, and analyzed. These data represented around 17,000 km2 (i.e. from the north of Wasit governorate to the south; and from the east to the west) and covered depth is approximately 12 m under the ground level. These data were collected from many directories of different ministries in this area and most of the site investigations and reports are done at Al-Kut construction laboratory and college of engineering geotechnical laboratories by known consultants and geotechnical engineers.
Using ArcGIS (10.5) environment facilities, a digital database was made for the physical and mechanical soil properties for the whole investigated area. The used technique here in this paper (i.e. 3D GIS mapping software) can be used later to cover all soil properties in the south of Iraq, which helped the engineers in re-cyclization, treatment, and analysis easily which subsequently makes the designing and planning of any engineering project easier (National Center for Construction Laboratories & Research [NCCLR], Citation2016 & Al-Maliki et al., Citation2018).
2. The study area
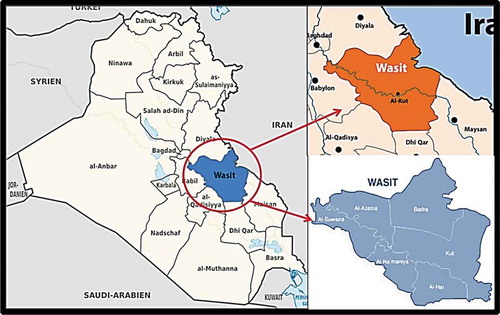
The Wasit governorate is located in southeast of the Baghdad, Capital of the republic of Iraq (about 180 km) and it has an international border with Islamic republic of Iran (see Figure ). It has also local borders with five governorates (i.e. Diyala, Babil, Al-Qadisiya, Dhi Qar, and Maisan).
Plain Sedimentary soil layers are predominate geological formation except for north-east of governorate (i.e. Badrah City, 60 km) which is aligned the borderline with Iran and which are considered mountainous terrain. It has an area of approximately (17,000) km2 which represents (4) % of Iraq’s’ total area (437,072 km2). The governorate includes 16 districts and collected data of the soil investigations are the outputs of tens of boreholes at different depths.
This paper included producing a digital map for different physical and mechanical properties of soil layers representing all the area of the governorate which is mathematically located between the coordinate (44°30ʹE,31°45ʹN) (lower-left corner) and (46°45ʹE,33°30ʹN)(upper right corner) (see Figure ). The Tigris River passes through the center of the governorate and divides the governorate into two parts from the north of the province to its south.
Figure 1. Location of Wasit governorate (Shubber, Citation2009).
3. Methodology
The procedure and the methodology was followed in this paper by collecting huge data and results of site investigation (i.e. bearing capacity, settlement, and soil strength parameters of soil strata) over a wide range of area. Then, these data are used as input data to create digital maps using 3D GIS mapping software.
3.1. The GIS software platform
GIS is an abbreviation for the Geographic Information System which is a framework for data collection, managing, and analyzing. As results of fast development of engineering technologies, the modern sciences of geography are merged with engineering and produced new hybrid technique (i.e. GIS) to integrate many types of data. It is also used in analyzing different locations and organizing soil layer information and visualize these information using digital maps and 3D scenes. With this unique facility, deeper insights into soil strata data can be revealed using GIS, such as patterns of soil formation, mechanical relationships, and situations helping the decision-makers (i.e. geotechnical engineers and designers) to take the right decision.
3.2. The collected data
The used data in this paper were collected, classified, and analyzed before utilizing it as input data into the GIS environment. The information in this paper represents the data collected from (146) boreholes covering all the study area and the range of the depth is (0–10) meters. The Whole data that were used in this paper are used under the authorization from the school buildings department in the province of Wasit, ministry of water resources, directorate of municipalities of Wasit. Whereas the soil investigation reports are used with permission from the laboratory of Al-Kut construction and Andrea laboratories. Table shows the re-arranged data with all the physical and mechanical properties at the desired depth of the different sites.
Table 1. The collected data of 164 borehole logs
4. The analyzed parameters
The main important geotechnical parameters that have to be considered by any geotechnical engineers and the designer are tabulated, analyzed, and prepared in an excel sheet and then used as an input into the GIS environment. The bearing capacity for soil strata for the whole study area is the main parameter which is used directly in the selection decision of the type of the footing and foundation and even in the preliminary assessment for the soil layers. Furthermore, it is intuitive for an engineer in the design requirements of the foundation for any project to investigate the bearing resistance of the soil strata to ensure that no bearing failure for the structure in the future may occur.
Other assessments should be considered during the design of the foundation related to the settlement limits of the structure; thus, the settlement parameters (i.e. consolidation index, Cc, and rebound index, Cr, as well as the consolidation coefficient, Cv) are digitally presented.
Another geotechnical parameter that is widely used by geotechnical engineers is to assess the designed footing and how the shear resistance of the soil strata resists the expected load from the structure to prevent shear failure. These parameters are the soil shear parameters (i.e. cohesion, c, and the angle of internal friction,).
The water level in the borehole is measured during the site investigation (24 h) after the drilling process. These data (i.e. water table level, WT) were derived from the collected data and the explanatory digital map for this parameter is achieved as well. The next section will explain the results in detail for all the geotechnical maps produced in this paper.
5. The results and discussion
This section focuses on the explanation of the obtained results that are explained briefly above.
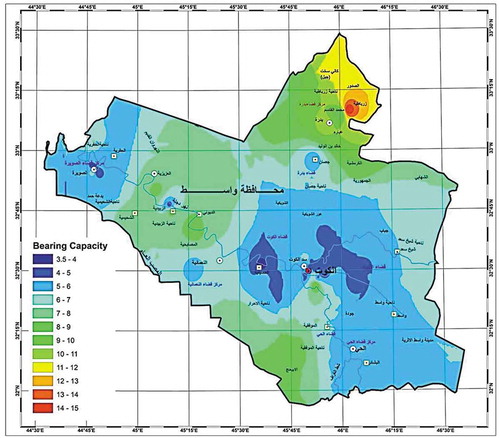
5.1. Bearing capacity
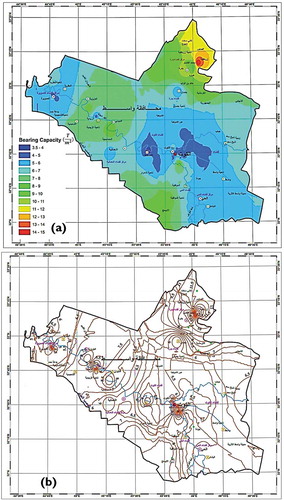
The bearing capacity data in Table are used to produce a digital geotechnical map. Figure shows the distribution of the bearing capacity, BC, from the north to the south and from the east to the west.
It can be seen from the figure that the minimum bearing capacity (30–50 kPa, 3–5 T/m2) is located at the center of the province (i.e. Al-Kut City), west of the center and just the center and around of Al-Sweera city at the north-west. This is not surprising because the weak to moderate stiff silty sandy soil is the predominant formation in this region. On the other hand, it is clearly shown that the north-east of the province (i.e. close to the Iranian borders) has stiff to very stiff soil layer characteristics and the bearing capacity ranges between (110–150 kPa, 11–15 T/m2). The geological formation of this region is mostly mountain rocky soil strata (close to the Zagros mountains between Iraq and Iran) and its elevation about 95 m above the sea level.
Figure 2. Distribution of the bearing capacity; (a) rainbow view and (b) contours.
5.2. Compressibility (consolidation) parameters
The compressibility parameters include the consolidation parameter or coefficient of consolidation, Cv, in m2/year; Compression index, Cc, and rebound (swelling) index, Cr.
5.2.1. Coefficient of consolidation, Cv
The coefficient of consolidation is very important for geotechnical engineers in the calculations of the final settlement’s time and even the settlement to assess the limit of consolidation at each time (the degree of consolidation). The measured coefficients of the values of consolidation from all the obtained samples from borehole logs (i.e. whole the study area) are tabulated in an excel sheet and used as input data in the GIS software. Figure explains the ranges of the coefficient of consolidation for whole the study area.
Figure 3. Coefficient of consolidation distribution, Cv.
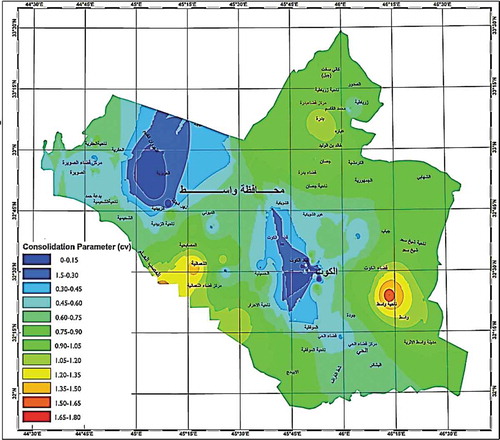
It is clearly shown from the Figure that the moderate value of the measured coefficient of consolidation (i.e. 0.7–1.2 m2/year) is the dominant values (i.e. more than 80% of the studied area). However, only west of Al-Kut district and east of Al-Sweera district have very low values (i.e. less than 0.3 m2/year). Moreover, the center of Al-Dejeela and Al-Numaniya townships has very high values of coefficient of consolidation (i.e. more than 1.5 m2/year).
5.2.2. Compression index, Cc, and rebound index, Cr
Compression index and swelling index are the characteristics of the soil settlement under loads. Basically, in consolidation experiments (i.e. the results of the one-dimensional compression test), the value of the swelling index ranges between 0.1 and 0.2 times the compression index (Das & Sivakugan, Citation2016). The elastic and plastic strain can be seen easily from the smooth consolidation curve and the version compression line. The obtained values of the parameters from the collected data reflect this behavior and small values of the swelling index rely on the plastic strain and showed that the soil does not suffer from high swelling characteristics though the soil is fine-grained silty-clayey soil.
Figure a and b show the geotechnical map for both the compression index and swelling index.
Figure 4. Compression index and selling index digital map.
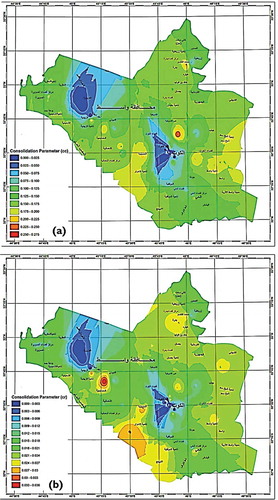
Clearly, it is noticeable from Figure ,b) that the changing in both the minimum values has a similar trend (i.e. minimum values for both parameter concentrated in west Al-Kut district and Al-Azeziya district and around), whereas the maximum values concentrated north of Al-Kut district for the compression index and south of Al-Azeziya district for swelling index. The moderate values for both parameters are predominant for most of the study area (i.e. green color). This means that the characteristics of the log-stress relationships have smooth compression (loading) curve with the small plastic strain (re-loading).
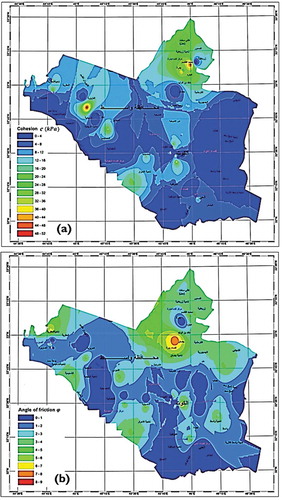
5.3. Shear strength characteristics
The soil can resist the shear stress governed from the applied load from the structures. The shear strength parameters of any soil are terms that refer to this resistance. The friction between particle interlocks is described by the angle of internal friction () whereas the bonding or the cementation characteristic is described by the cohesion (c). The strength of any soil decreases when shear strain and expansion or contraction may occur (i.e. increasing or decreasing of soil density, respectively) due to applied loads. Once the shear stress and the density trend to be constant during increasing of the shear strain, the shear strength will decrease and this case called critical or residual state. The shear strength parameters are commonly used by the different common equation in the design of foundation particularly in the empirical equations.
Many methods can be followed to determine the shear strength parameters, triaxial test, and direct shear torsional direct shear test (Thermann et al., Citation2006). The simplest method to calculate the shear strength parameters is by performing the direct shear test. The collected and used shear strength parameters as input data in the GIS software in this paper are determined from the direct shear test methods.
Figure shows the digital geotechnical map for the distributed values of shear strength parameters for Wasit province. From Figure ), it should be noticed that the determined values of the cohesion parameter (i.e. c) are predominantly small values (ranged between 0 and 16 kPa) and this gave an indication that the soil layers of the studied area are sandy silty soil with few very fine grain particles (clay). This is not surprising as the bearing capacities as described above are low values. In contrast, high values of cohesion parameters are noticed in the north of the province particularly at Badra district and around.
The angle of internal friction is measured as a peak state (). It can be seen from Figure ) that the angle of friction values is small for the whole studied area and this refers to the fact that the geological formation for the soil layers of the province is predominantly sandy silty soil with few cementation action for few clayey soil.
Figure 5. Shear strength parameters; (a) cohesion, c, and (b) angle of friction, .
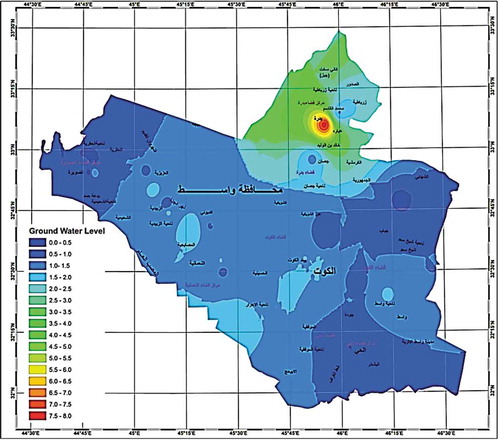
5.4. Water table level
Once the soil layer is found under the water level, it will obviously be fully saturated. The water table is the upper level of the water in the soil layer for the saturated zone. As described earlier in this paper, the water level is measured from the borehole (24 h) after the end of the drilling process to permit the water to be at a static state due to suction and filtration from the walls of the borehole. These measurements have been taken at different seasonal times during the year.
Figure shows the groundwater level as a geotechnical map for Wasit province. It can be seen that the measured water table level has shallow depth under the ground surface (not exceeding 1.5 m) for most of the study area. In contrast, only the north of the study area (Badra, Zurbatiya) and the north-east Iranian borders are going to be deeper (i.e. up to 8 m for Badra district center). Actually, this is intuitive because the elevation of this region increases and reaches to 95 m at some places due to geological formation and close to the Zagros Mountains.
Figure 6. Water level geotechnical map for Wasit province.
6. Conclusions
This paper focuses on producing digital geotechnical maps for main important geotechnical properties that are commonly used by geotechnical engineers in footing and foundation design. The main conclusion can be summarized as follows:
GIS is an effective tool that can be used by engineers to assess preliminary geotechnical site exploration. The obtained information concerned with the main geotechnical properties and parameters of 164 boreholes are collected, analyzed, and used as input data utilizing the GIS environment to produce significant many geotechnical maps.
The accomplished digital geotechnical maps for the bearing capacity, compressibility characteristics, and shear strength parameters can be used by the designer as a visual display powerful tool at the preliminary design stage simply by using the digital values of these parameters for the proposed region and appropriate decision can be taken.
Preliminary Assessment of the site investigation report can be accomplished for any project based on the digital maps. The considerable advantages of using these techniques are low cost, the ease of data using and quick update of data, and the ability to produce the right , care should be taken preceding the footing design.
Moderate bearing capacities are noticed for most of the study area (i.e. 40–60 kN/m2) while only the north of the province has a large bearing capacity (i.e. around 150 kN/m2).
From the shear strength digital map of the parameter, the sandy silty soil is the predominant formation for the soil layers (maximum angle of friction is 8° and with predominant cohesion around 16 kPa).
Shallow water table level is noticed for 80% of the study area and the rest of the area (i.e. the north) has a water table level up to 8 m below the ground surface.
Cover image
Acknowledgements
The authors would like to express their truthful thanks to the technical staff of the GIS laboratory at the University of Wasit for their assistance in performing all the digital geotechnical maps. The first author would also like to acknowledge the Ministry of education/schools building directorate for their assistance in providing us with all the site investigation borehole data.
Additional information
Funding
Notes on contributors
Asad H. Aldefae
Asad Aldefae has a PhD in civil engineering/geotechnical engineering from the University of Dundee/Scotland/Uk at the end of 2013. He is interested in earthquake engineering, environmental engineering, riverbanks stability, physical and numerical modeling, geotechnical centrifuge, seismic performance of soil-structure interaction and slope stability analysis and soil-water interaction engineering problems.
More than 16 paper were published in high ranking journal by Dr. Aldefae like Géotechnique, Soil Dynamic and Earthquake Engineering, Geotechnical and Geoenvironment Engineering, ASCE, Cogent Engineering, as well as many international conferences like a series of international conferences of physical modeling in geotechnic (ICPMG) in both Perth, Australia (2014) and London, UK (2018) and Greece.
Results of this paper are important to produce digital geotechnical maps using GIS to understand the geographical distribution of mechanical geotechnical parameters which investigated from tens of the soil investigation reports.
References
- Al-Baghdadi, N. H. (2016). Geotechnical mapping of An-Najaf City, Iraq. Journal of University of Babylon, 24(4), 962–22 https://www.iasj.net/iasj?func=article&aId=116301.
- Al-Maliki, L. A. J., Al-Mamoori, S. K., El-Tawel, K., Hussain, H. M., Al-Ansari, N., & Al Ali, M. J. (2018). Bearing capacity map for An-Najaf and Kufa cities using GIS. Engineering, 10(5), 262. https://doi.org/10.4236/eng.2018.105018
- Al-Shukriji, Y. J., & Al-Khuzaie, M. A. (2011). The geotechnical maps for the governorates Baghdad, Diyala, Wasit and Babylon. Journal of Engineering, 17(3), 87–104. https://www.iasj.net/iasj?func=search&query=au:%22%D8%A7%D9%84%D8%AF%D9%83%D8%AA%D9%88%D8%B1%20%D9%8A%D9%88%D8%B3%D9%81%20%D8%AC%D9%88%D8%A7%D8%AF%20%D8%A7%D9%84%D8%B4%D9%83%D8%B1%D8%AC%D9%8A%20%20%22&uiLanguage=en
- Bhattacharya, D., Ghosh, J. K., Komarkova, J., Banerjee, S., & Kutoglu, H. (2014). Distributed GIS for automated natural hazard zonation mapping Internet-SMS warning towards sustainable society. Cogent Engineering, 1(1), 961346. doi:10.1080/23311916.2014.961346
- Camera, C., Zomeni, Z., Noller, J. S., Zissimos, A. M., Christoforou, I. C., & Bruggeman, A. (2017). A high resolution map of soil types and physical properties for Cyprus: A digital soil mapping optimization. Geoderma, 285(1), 35–49. https://doi.org/10.1016/j.geoderma.2016.09.019
- Das, B. M., & Sivakugan, N. (2016). Fundamentals of geotechnical engineering. Cengage Learning.
- Ghosh, J. K., Bhattacharya, D., Boccardo, P., & Samadhiya, N. K. (2015). Automated geo-spatial hazard warning system GEOWARNS: Italian case study. Journal of Computing in Civil Engineering, 29(5), 04014065. https://doi.org/10.1061/(ASCE)CP.1943-5487.0000372
- Gupta, P., & Sarma, K. (2016). Spatial distribution of various parameters in groundwater of Delhi, India. Cogent Engineering, 3(1), 1138596. https://doi.org/10.1080/23311916.2016.1138596
- Hellawell, E. E., Lamont-Black, J., Kemp, A. C., & Hughes, S. J. (2001). GIS as a tool in geotechnical engineering. Proceedings of the Institution of Civil Engineers-Geotechnical Engineering, 149(2), 85–93. https://doi.org/10.1680/geng.2001.149.2.85
- Kadhim, K. N., & Al-Abody, A. A. M. (2015). The geotechnical maps for bearing capacity by using GIS and quality of ground water for Al-Imam District (Babil-Iraq). International Journal of Civil Engineering and Technology, 6(10), 176–184. https://www.researchgate.net/publication/298788473_THE_GEOTECHNICAL_MAPS_FOR_BEARING_CAPACITY_BY_USING_GIS_AND_QUALITY_OF_GROUND_WATER_FOR_AL-_IMAM_DISTRICT_BABIL_-IRAQ
- Kamal, M. A., Arshad, M. U., Khan, S. A., & Zaidi, B. A. (2016). Appraisal of geotechnical characteristics of soil for different zones of Faisalabad (Pakistan). Pakistan Journal of Engineering and Applied Sciences, 17(6), 1–10. https://www.researchgate.net/publication/283316143_Appraisal_of_Geotechnical_Characteristics_of_Soil_for_Different_Zones_of_Faisalabad_Pakistan
- Labib, M., & Nashed, A. (2013). GIS and geotechnical mapping of expansive soil in Toshka region. Ain Shams Engineering Journal, 4(3), 423–433. https://doi.org/10.1016/j.asej.2012.11.005
- Liengsakul, M., Mekpaiboonwatana, S., Pramojanee, P., Bronsveld, K., & Huizing, H. (1993). Use of GIS and remote sensing for soil mapping and for locating new sites for permanent cropland—A case study in the “highlands” of northern Thailand. Geoderma, 60(1–4), 293–307. https://doi.org/10.1016/0016-7061(93)90032-G
- National Center for Construction Laboratories & Research, NCCLR. (2016). Investigation Reports. Governorate of Najaf.
- Player, R. S. V. (2006). Geographic information system (GIS) use in geotechnical engineering. In GeoCongress 2006: Geotechnical engineering in the information technology age (pp. 1–6). https://doi.org/10.1061/40803(187)123
- Shubber, S. (2009). Appendix 1. The Iraqi investment law 2006. In The Law of Investment in Iraq (pp. 168–189). https://doi.org/10.1163/ej.9789004172869.i-247.78
- Thermann, K., Gau, C., & Tiedemann, J. (2006). Shear strength parameters from direct shear tests–influencing factors and their significance. The Geological Society of London, 484, 1–12. https://www.researchgate.net/publication/237718044_Shear_strength_parameters_from_direct_shear_tests_-_influencing_factors_and_their_significance