
 ?Mathematical formulae have been encoded as MathML and are displayed in this HTML version using MathJax in order to improve their display. Uncheck the box to turn MathJax off. This feature requires Javascript. Click on a formula to zoom.
Abstract
The impact of formulation variables on the optimization of pilot scale clobetasol 17-propionate (CP) cream formulations was investigated using a Central Composite Design of Experiments. Thirty batches of cream were manufactured and the formulation variables assessed were % v/v propylene glycol, % w/w Gelot® 64, cetostearyl alcohol and glyceryl monostearate content. The responses monitored included viscosity, spreadability, pH, CP content, extrudability, electrical conductivity, and % CP released at 72 hours. The responses were compared to those of a reference product, Dermovate® cream. ANOVA analysis revealed that viscosity, spreadability, and % CP released at 72 hours were significant formulation responses (p < 0.05). Cetostearyl alcohol had the greatest impact on quality of pilot scale products. An increase in cetostearyl alcohol resulted in an increase in viscosity, a decrease in spreadability, and a decrease in % CP released at 72 hours. The optimized pilot scale CP formulation contained 46% v/v propylene glycol, 8.6% w/w cetostearyl alcohol, 10.5% w/w glyceryl monostearate, and 3.8% w/w Gelot® 64. The resultant viscosity, spreadability, pH, CP content, extrudability, electrical conductivity, and % CP released were 44633cP, 24.91cm2, 101.23 %, 76.98 g/cm2, 198.23 µS/cm, and 50.23%. The addition of cetostearyl alcohol and Gelot® 64 is critical for establishing a soft formulation that leads to the formation of a mixed crystal bilayer network of high viscosity. The formation of a separate crystalline lipophilic network usually occurs in semi-solid formulations that contain high concentrations of emulsifier, leading to an increase in shear stress and greater physicochemical stability of the formulation. The use of experimental design approaches to formulation development activities, permit evaluation of multiple factors simultaneously, reducing the time and costs asscoiated with product development activities, whilst identifying a composition design space and ensuring stable and effective dosage forms are produced.
PUBLIC INTEREST STATEMENT
Access to affordable, high quality, safe, and effective medicines is a global need. Conventional approaches to research make use of changing “one factor at a time” approaches, which is time-consuming and costly when solving complex problems. The use of statistical approaches such as Design of Experiments and Response Surface Methodologies to solve complex problems permits rapid elucidation and identification of the interaction between variables so as to find an optimum solution with a minimum of experiments. This approach was successfully applied to evaluating the impact of changes in the composition of pilot scale cream formulations on the quality and performance of the medicine.
1. Introduction
Pharmaceutical optimization is the application of systematic approaches to establish the best possible combination of product and/or process variables under a given set of conditions that will result in the production of a high-quality pharmaceutical product that exhibits predetermined and specific characteristics each time it is manufactured (Emami, Citation2006). Four different approaches including the one-factor-at-a-time, direct optimization, non-systematic or statistical design can be used to optimize pharmaceutical products (Conor & McQuain, Citation2010; El-Zaher & Mahrouse, Citation2013). The use of changing one-factor-at-a-time approach requires the formulation scientist to change one formulation variable at-a-time whilst keeping all others constant to establish the optimal value for that variable. This approach requires a large number of experiments to undertaken and is costly (Singh et al., Citation2011).
The optimization of formulation composition is essential to ensure appropriate therapeutic performance (Emami, Citation2006). Since the 1970s the use of mathematical and statistical models such as. Response Surface Methodology (RSM) for the optimization of pharmaceutical formulations and processes has been reported (Rahul et al., Citation2011; Singh et al., Citation2011). This powerful approach has been successfully applied to the development, design, and optimization of topical drug delivery systems such as self-nanoemulsifying systems, creams, gels, and pastes (Chang et al., Citation2007; Emami, Citation2006). RSM describes the behavior of a set of data with the objective of optimizing the levels of input variables simultaneously based on the fit of polynomial equations to experimental data in order to achieve the best performance from a system (Chang et al., Citation2007). Prior to the application of RSM methodology, it is necessary to select an experimental design that will define that experiments that must be conducted in the experimental region, under investigation (Honary et al., Citation2013). For these studies a Central Composite Design (CCD) initially described by Box and Wilson, was selected for use (Lenth, Citation2009).
Formulating a semi-solid pharmaceutical product is technically challenging due to potential stability issues and the use of appropriate surfactants may enhance the stability of topical products dramatically of used at appropriate concentrations (Sheikh et al., Citation2011). Gelot® 64 is an oil-in-water emulsifying agent that is a mixture of glyceryl stearate and polyethylene glycol-75 stearate (PEG-75 stearate) and functions as a surfactant, solubilizer, thickening agent, emollient, spreading agent, wetting agent, and dispersant in cosmetic and pharmaceutical formulations (Fauzee, Citation2011). Glyceryl monostearate acts as a self-emulsifying system that usually produces satisfactory o/w emulsions as it is a mixture of monoacylglycerols that consist mainly of monostearoylglycerol, with variable amounts of di- and tri-acylglycerols (Ballmann & Mueller, Citation2008). Cetostearyl alcohol is a mixture of solid aliphatic alcohols that is used as a stiffening agent and/or emulsion stabilizer in cream, ointment, and other topical preparations (Fauzee, Citation2011). Skin penetration enhancers are critical to improve the partitioning of an Active Pharmaceutical Ingredient (API) into the stratum corneum thereby facilitating drug transport into and through the skin. Formulation scientists may add additional non-volatile, water-miscible co-solvents such as propylene glycol into cream formulations to further enhance the permeation process. In this way evaporation of components of a formulation occurs leaving a film with a high concentration of API on the skin surface further increasing the concentration gradient and facilitation of drug delivery. The cream, therefore, deposits lipids and other moisturizers on and into the horny layer of the skin, increasing and/or restoring hydration of the tissues (Walker & Smith, Citation1996).
CP is one of the most potent topical corticosteroids that is commercially available on the South African market (Fauzee, Citation2011). It exhibits potent anti-inflammatory, anti-pruritic, vasoconstrictive, immunosuppressive and anti-proliferative properties and has been found to be useful for the treatment of chronic skin conditions such as severe psoriasis, eczema, extreme photodermatitis, and seborrheic dermatitis particularly in patients infected with HIV/AIDS (Gordon, Citation1998). CP is usually formulated as cream, ointment, scalp solution, gel, and more recently as foam, emollient cream, and nanoparticle formulations (Tsai, Citation2001). The effect of formulation variables on the optimization of pilot scale CP cream formulations was investigated using CCD with RSM in order to ensure the manufacture of stable cream formulations using an appropriate combination of excipients. The utility of applying experimental design to evaluation of the impact of formulation variables on product performance was investigated and applied to identify a composition design space for this pilot scale formulation.
2. Materials and methods
2.1. Materials
Clobetasol 17-propionate and Betamethasone 17-Valerate (BV) were purchased from Symbiotec® Pharmalab P. Ltd (Indore, India). The excipients viz., propylene glycol, sodium citrate, citric acid, chlorocresol, and white beeswax were donated by Aspen Pharmacare® (Port Elizabeth, South Africa). The emulsifying and viscosity modifying agents viz., glyceryl monostearate and cetostearyl alcohol were purchased from Croda® Chemicals (SA) Limited (Johannesburg, South Africa) and Gelot® 64 was purchased from Gattefossé® (SAS, Saint-Priest Cedex, France). Methanol (MeOH 215 nm-UV cutoff) was purchased from Romil® Ltd (Cambridge, UK). HPLC grade water was purified using a Milli-Ro® −15 water purification system (Bedford, USA) comprised of a Super-C® carbon cartridge, two Ion-X® system (Bedford, USA) and an Organex-Q® cartridge. All reagents were at least of analytical reagent grade and were used without further modification.
2.2. Equipment
All excipients were weighed using a Model PM4600 Mettler® top-loading analytical balance (Zurich, Switzerland) and the formulations were manufactured using a Wintech® cream/ointment plant (Wintech® Pharmachem Equipment PVT, Ltd, Mumbai, India).
2.3. Method of manufacture
A Wintech® mixing bowl was cleaned with detergent and distilled water, to avoid any cross-contamination between batches, after which the mixing bowl was drained, dried, and allowed to equilibrate to a temperature of 22°C. The water jacket surrounding the mixing bowl was filled with distilled water during the manufacturing and cooling processes. All excipients were weighed prior to manufacture and the mixing bowl was charged through the charging port in a predetermined sequence. Propylene glycol and distilled water were added to the bowl after which sodium citrate, citric acid, CP, glyceryl monostearate, cetostearyl alcohol, white beeswax, Gelot® 64, and chlorocresol were added. The bowl was heated to a temperature of 65°C and the anchor was set at an anchor speed of 40 rpm for 2 hours to ensure that all excipients were mixed. Following mixing the cream was homogenized at a homogenization speed of 2000 rpm for a further 2 hours. Following emulsification, the product was continually mixed with the anchor while distilled water (± 20°C) was circulated through the water jacket to facilitate cooling of the cream for 2 hours until the formulation had cooled to a temperature between 30°C and 35°C. Mixing was then stopped and the pressure build-up in the mixing bowl was released by activation of the pressure vent. The CP cream was removed from the mixing bowl, stored in opaque containers and subjected to quality control testing within 24 hours of manufacture.
2.4. Experimental design
Preliminary experiments indicated that formulation variables for. % v/v propylene glycol, % w/w Gelot® 64, cetostearyl alcohol, and glyceryl monostearate were the main factors that affected the performance of the cream formulations. Therefore, a CCD was used to systemically investigate the influence of these critical formulation variables on viscosity (B1), spreadability (B2), pH (B3), % CP content (B4), extrudability (B5), electrical conductivity (B6), and % CP released over 72 hours (B7). The formulation variables were studied at three different levels viz., low (−1), medium (0), and high (+1), and the data for the design are listed in Table . For each factor the experimental range was selected on the basis of the results of preliminary experiments established using laboratory-scale CP cream formulations. A summary of the 30 experimental runs and associated levels of coded factors is listed in Table .
Table 1. Actual and coded values for formulation variables used for the CCD
Table 2. CCD variables and responses
2.5. Compatibility studies
Infrared (IR) spectrophotometric analysis was conducted using a Perkin-Elmer® FT-IR spectrum 2000 spectrophotometer (Beaconsfield, England). Each excipient was melted and CP added to form a mixture in a ratio of 1:1. Approximately 2 mg of each sample was mixed with 200 mg KBr and prepared for analysis by compressing to form a disk prior to collecting spectral data over the IR spectrum region of 400–4000 cm−1. The resultant chemical bond shifts were analyzed for evidence of possible drug-excipient interactions. Thermogravimetric Analysis (TGA) was used to determine the thermal response of CP in the temperature range between 30°C and 650°C using a Perkin-Elmer® FT-IR Thermogravimetric Analytical Instrument (Connecticut, USA). The weight of each sample was maintained between 1 mg and 2 mg and TGA measurement was performed using a platinum pan with a nitrogen flow rate of 20 mL/min at a heating rate of 10°C/min, with an initial temperature set to 40°C and the final temperature set at 650°C.
2.6. Viscosity
The consistency of creams was measured at room temperature (± 22°C) using a Brookfield® Model-RVDI+ Viscometer (Stoughton, USA) fitted with a T-F (code 96) spindle and a helipath stand at a rotation speed of 10 rpm. The spindle was selected in order to maintain a torque of between 10% and 90%. The viscosity measurements were recorded 60 seconds after the commencement of rotation of the spindle. Three consecutive readings (n = 3) were recorded to obtain an average viscosity for each batch of cream.
2.7. Spreadability
A parallel-plate method was used to determine the spreadability of the semisolid formulations (Singh et al., Citation2011). Approximately 3 g of each formulation was sandwiched between two sheets of glass of 15 cm x 15 cm dimension. A 100-g weight was placed on each corner of the top glass sheet for 3 min. The radius of the cream was measured for each formulation. Each batch was subjected to replicate (n = 3) testing and the average spreadability calculated by determining to establish the area covered by the cream.
2.8. pH
The pH of the creams was determined at room temperature (22°C) using a Crison® Model GLP 21 pH meter (Barcelona, Spain) with the electrode set to a depth of 0.5 cm in a beaker containing the cream. The pH, measurements were performed in triplicate (n = 3) and the average pH for each batch calculated.
2.9. CP content
The CP content of each batch was determined by dissolving 1310 mg of each cream formulation in 50 mL MeOH containing BV (internal standard) in an A-grade volumetric flask. The sample was sonicated using a Branson® B12 ultrasonic bath (Connecticut, USA) for 35 minutes and the suspension was then placed in K.I.C® Model CF3555 freezer (Stanger, South Africa) (−20°C) for 20 minutes after which the sample was centrifuged at 3000 rpm using an Eppendorf® Model 5415 centrifuged (Hamburg 63, West Germany) for 15 minutes. A 4.0 mL aliquot of the supernatant was filtered in three extraction cycles through a 0.45 μm HVLP Millipore® filter membrane (Bedford, USA). An aliquot of the filtered sample was then analyzed (n = 3) using a validated HPLC method (Fauzee & Walker, Citation2013). The average CP content of each batch was calculated as establishing the uniformity of distribution of low dose compounds during product development and scale-up is useful for process performance assessment (Chandira et al., Citation2010).
2.10. Tube extrudability
The cream formulation was filled into standard-caped collapsible aluminum tubes and sealed using a manual Shreeji® collapsible tube filling and crimping machine (Mumbai, India). The tube was weighed using a Mettler® Model PM460 balance (Zurich, Switzerland) and the weight recorded. The tube was placed between two panes of glass and clamped into place. A one-kilogram weight was placed on the glass sheet and the cap removed from the tube. The amount of cream extruded and collected in 10 seconds was weighed. The measurement of extrudability was undertaken in triplicate (n = 3) and the average extrudability reported. Extrudability is calculated using EquationEquation (1)(1)
(1)
Where
E = Extrudability (g/cm2)
W = Applied weight to extrude cream from tube (grams)
A = Area (cm2). (Kumar & Verma, Citation2010)
2.11. Electrical conductivity
The electrical conductivity of the manufactured cream samples was measured (n = 3) at room temperature (22°C). Using a digital Mettler Toledo® Model AG-Five Easy FE 30 electrical conductivity meter (Schwerzenbach, Switzerland) fitted with a built-in magnetic stirrer.
2.12. In vitro diffusion studies
In vitro CP diffusion studies were performed (n = 3) using a Franz Diffusion cell system (Branchburg, NJ, USA). A 300 mg aliquot of each cream formulation was applied to a 0.025 μm nitrocellulose MF-Millipore® membrane (Bedford, USA) and spread evenly using a glass rod. The receptor chamber was filled with 12.6 mL propylene glycol: water in a ratio of 70:30% v/v maintained at 32 ± 0.5°C using a Model 109046022 circulating water bath (Cambridge, UK). The receptor solution was continuously stirred at 10 rpm using a 10 mm x 2.5 mm magnetic stirrer bar (Darmstadt, Germany). The donor compartment was covered with Parafilm® (Neenah, Wisconsin) to prevent cream dehydration. The total volume of receptor fluid was withdrawn through the sample port at 2, 4, 8, 12, 24, 48, and 72 hours and replaced with fresh receptor fluid after each sample was withdrawn. Each cream sample was tested in triplicate (n = 3) and the samples were analyzed using HPLC with UV detection at 238 nm. The cumulative % CP release was then calculated (Fauzee, Citation2011).
2.13. Sample analysis
HPLC analysis was undertaken using a validated method (Fauzee & Walker, Citation2013) with an Alliance 2695 Separations® module and a 2487 Waters® Dual wavelength detector set at 238 nm and Empower data acquisition software (Milford, USA). Isocratic chromatographic separation was achieved using a Nova Pak® C18 (5 μm, 150 mm × 3.9 mm i.d.) column (Milford, USA) protected by a guard column. The column was maintained at a 24ºC. The volume of injection was 20 µL and a flow rate of 1.0 mL/min was used for the separation.
2.14. Data analysis
The relationship between responses and formulation variables for all test formulations was analyzed and optimized using Design-Expert® software (Version 8.02, Stat-Ease, Inc., Minneapolis, USA). Statistical analysis including linear regression and response-surface analysis was conducted and a quadratic polynomial equation was generated for each response monitored using the CCD approach. The significant model terms (P-value <0.05) were selected for further analysis. Analysis of Variance (ANOVA) and the regression coefficient (R2) were used to analyze the CCD while normal plots of residuals, contour plots, and three-dimensional (3D) response-surface plots were used to depict the data graphically. The selection of the composition for an optimized pilot scale CP cream formulation was based on significant formulation responses generated using CCD data in addition to comparing the test formulation response to those of a reference product, Dermovate® cream.
3. Results and discussion
3.1. CCD and RSM
A summary of the results for the variables tested revealing their impact on the viscosity, spreadability, pH, CP content, extrudability, electrical conductivity, and % CP released over 72 hours is summarized in Table . The viscosity of the CP formulations ranged between 16 600 and 89 600 cP, spreadability between 9.86 and 27.68 cm2, pH between 6.03 and 6.84, % CP content between 96.10 and 105.33 %, tube extrudability between 49.13 and 462.59 g/cm2, electrical conductivity between 98.36 and 1066.33 µS/cm, % CP released at 72 hours between 21.18 and 70.97 %. A quadratic polynomial model was selected for each formulation response using statistical software and the final empirical models in terms of coded factors for viscosity (B1), spreadability (B2), pH (B3), % CP content (B4), extrudability (B5), electrical conductivity (B6) and cumulative % CP released at 72 hours (B7) are shown in Equations 2–8.
B1 = + 53644.4 – 6469.44A1 + 10325.00A2 + 12613.89A3 + 10030.56A4 – 612.50A1A2 + 1004.17A1A3 + 1816.67A1A4 – 4675.00A2A3 – 3120.83A2A4 + 262.50A3A4–906.94A12 + 2580.56A22 + 6180.56A32 + 2376.39A42(2)
B2 = +16.37 + 0.67A1–2.64A2–1.51A3–2.37A4 + 0.22A1A2–0.079A1A3–0.31A1A4 + 6.135E-003A2A3 + 0.98A2A4 + 0.22A3A4–0.21A12 + 0.026A22–0.26A32 + 0.42A42(3)
B3 = +6.47–0.068A1 + 9.861E-003A2 + 0.056A3–7.917E-003A4–0.15A1A2 + 4.792E-003A1A3 + 0.056A1A4–0.14A2A3 + 0.013A2A4–0.10A3A4–0.026A12–0.072A22–0.019A32 + 0.032A42(4)
B4 = +101.05 + 0.21A1–0.31A2–0.18A3 + 0.24A4 + 0.24A1A2 + 0.60A1A3 + 0.80A1A4–0.24A2A3 + 0.27A2A4–0.36A3A4 + 0.23A12 + 0.099A22 + 0.20A32–0.30A42(5)
B5 = +98.76–21.55A1 + 27.92A2 + 51.97A3 + 26.63A4 + 25.80A1A2–2.38A1A3 + 14.30A1A4–30.02A2A3–36.77A2A4 + 6.16A3A4 + 5.81A12 + 18.13A22 + 35.14A32 + 15.61A42(6)
B6 = +274.25–33.07A1–55.79A2–156.87A3 + 53.45A4 + 29.94A1A2 + 64.36A1A3–25.68A1A4 + 73.32A2A3–21.00A2A4–103.33A3A4 + 39.18A12 + 20.93A22 + 3.72A32 + 3.64A42(7)
B7 = +52.54 + 3.05A1–5.25A2–4.96A3–6.70A4 + 3.56A1A2–1.13A1A3–1.55A1A4 + 2.74A2A3 + 2.52A2A4–1.35A3A4 + 2.37A12–2.26A22–4.54A32–0.82A42(8)
The quadratic polynomial equations express the relative impact of each factor on the response monitored, i.e., the average result of changing one-factor-at-a-time from its low to high value (Weheba & Sanchez‐Marsa, Citation2006). The interaction terms (A1A2, A2A3, A2A4, A3A4) indicate the manner in which the response changes when two formulation variables were changed simultaneously. The quadratic terms (A12, A22, A32, A42) are included to investigate non-linearly effects that may be involved. A negative sign (-) usually indicates an antagonistic effect whereas a positive sign (+) signifies a synergistic effect (Weheba & Sanchez‐Marsa, Citation2006). The positive sign for the responses A2, A3 and A4 indicate that there is a synergistic effect of the input factors on the viscosity of the creams whereas the negative sign for the responses for A2, A3 and A4 reflect an antagonistic effect of these parameters on the spreadability of the creams. The regression coefficients and associated standard deviation were also assessed in order to evaluate the accuracy of the formulation responses that were predicted by the models. An R2 value close to unity with small associated standard deviations indicates an accurate response (Tan & Hameed, Citation2008). The use of the design of experiments for the identification of interactions between input variables for a process and associated statistical analysis of data generated allow identification of significant factors and interactions between factors that may provide insight into the complexities of such systems (Fegade et al., Citation2013). A summary of the statistical parameters that were used to assess model suitability is listed in Table .
Table 3. Summary of the statistical parameters for model suitability
Viscosity (B1) was shown to be the most significant response following the manufacture of CP pilot scale cream formulations with an F-value of 7.09. Spreadability (B2) also had some significant effect (F-value = 4.36). CP content and pH were the least significant responses with F-values of 0.37 and 1.43, respectively. The R2 values indicate that 90.88%, 86.29%, 57.20%, 25.48%, 60.66%, 61.52%, and 73.40% of the total variation in responses B1-B2 can be attributed to the % composition of propylene glycol, Gelot® 64, cetostearyl alcohol, and glyceryl monostearate, respectively. However, the data for viscosity were variable with a large standard deviation whereas pH was constrained with a narrow standard deviation. The two formulation responses viz., pH, and % CP content had low coefficients of variation indicating that precise and reliable quadratic polynomial models had been developed.
3.2. Compatibility studies
The IR spectrum for CP reveals the presence of the characteristic peaks for CP occurring between 2000 cm−1 and 800 cm−1 (Figure ) with wavenumbers of 1733 cm−1 for the C = O-O bond at position C-17, 1661 cm−1 for C = O at position C-20, 1606 cm−1 for C = C at positions C-1 to C-2 and C-4 and C-5, 1065 cm−1 for C-F at position C-9, 1009 cm−1 for C-O stretching at position C-11 and 888 cm-1 C-Cl at position C-21, These bands were also observed when IR spectra of 1:1 physical mixtures of excipient and CP were evaluated and revealed the same absorbance bands (Figures –). It is clear that no obvious interaction exists between CP and any waxy excipients since no major chemical bond shifts were evident in the IR spectra. Confirmation of compatibility would be obtained following long-term real-time stability studies.
Figure 1. Infrared spectrum of CP in KBr.
Figure 2. Infrared spectrum of a physical mixture of CP and Gelot® 64 (1:1).
Figure 3. Infrared spectrum of a physical mixture of CP and cetostearyl alcohol (1:1).
Figure 4. Infrared spectrum of a physical mixture of CP and glyceryl monostearate (1:1).
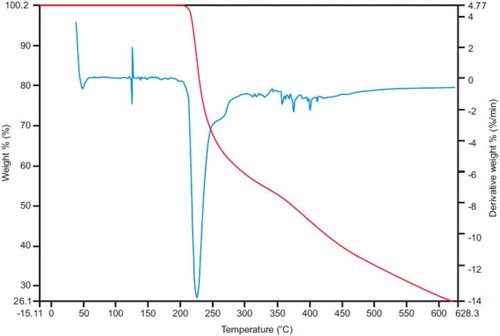
The TGA spectrum (Figure ) revealed that the total percent weight of CP was observed 100% for temperatures between 30°C and 200°C revealing that there were no changes in the physical characteristics of CP under these conditions. At a temperature >200°C, it was observed that the total percent weight CP decreased to 26.1% at a temperature of 650°C. At 100°C complete dehydration of CP may have occurred followed by in the range of 150–250°C after which decomposition of CP occurred at 225°C.
Figure 5. Thermogravimetric (red curve) and its derivative curve (blue curve) for CP at a heating rate of 10°C/min.
3.3. Viscosity
The largest F-value of 32.45 was observed for cetostearyl alcohol (A3) indicating that this factor has the most significant effect on the viscosity of the creams other variables. Gelot® 64 (A2) and glyceryl monostearate (A3) were variables that had some significant effect on viscosity since F-values of 21.74 and 20.52 were observed for these formulation variables. The effect of propylene glycol on the viscosity was not significant with an F-value of 8.54 clearly indicating that this parameter had the least effect on the viscosity of the resultant creams. Contour and 3D response surface plots were constructed and reveal the interaction effects of the formulation variables on viscosity (B1) and are depicted in Figures and . The contour plot reveals that Gelot® 64 and cetostearyl alcohol had a significant effect on this formulation response (Figure ).
Figure 6. Contour plot showing the effects of cetostearyl alcohol and Gelot® 64 on the viscosity of the pilot scale CP cream formulations.
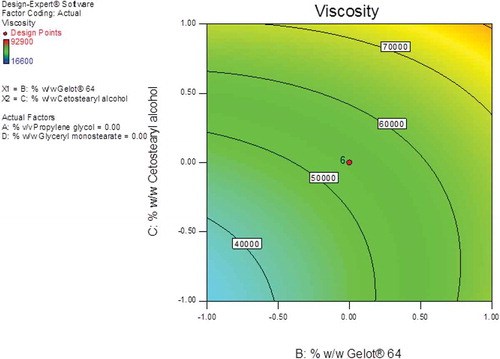
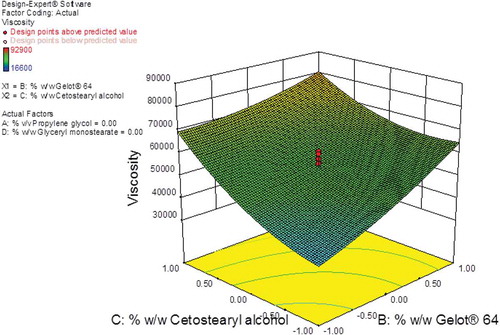
Figure 7. 3D response surface plot showing the effects of cetostearyl alcohol and Gelot® 64 on the viscosity of the pilot scale CP cream formulations.
An increase in the % w/w cetostearyl alcohol from 3% to 13% resulted in a significant increase in viscosity of the creams from ~41 000cP to ~71 000cP. Furthermore, an increase in the % w/w Gelot® 64 from 1% to 5% also resulted in an increase in the viscosity of the creams from ~44 000cP to ~87 − 000cP indicating that both cetostearyl alcohol and Gelot® 64 have the greatest impact on the final quality of these semi-solid products. Cetostearyl alcohol is a mixture of solid aliphatic alcohols that play a dual role in cream preparations as they function as a stiffening agent and an emulsion stabilizer (Ballmann & Mueller, Citation2008; Fauzee, Citation2011), and the dual action may have had the highest impact on the viscosity of the creams.
The addition of o/w emulsifiers often results in achieving a soft formulation that results in the formation of mixed crystal bilayer networks of high viscosity with an increase in the number of emulsified particles in a dense closely packed three-dimensional network as reproted elsewhere (Dahl et al., Citation2018; Golemanov et al., Citation2006; Junginger, Citation1984; Müller-Goymann, Citation1984). The formation of a separate crystalline lipophilic network in formulations containing high concentrations of emulsifier may also occur, leading to an increase in the viscosity of the system and therefore a higher degree of physicochemical stability of the cream formulation as reported elsewhere (Dahl et al., Citation2018; Golemanov et al., Citation2006; Junginger, Citation1984; Müller-Goymann, Citation1984). However, if too high a concentration of emulsifier is used the result may be an increase in crystallization on storage, which results in a poor optical homogeneity and a lack of softness that is required to achieve a suitable cosmetic appearance (Ballmann & Mueller, Citation2008). A maximum viscosity value was observed when Gelot® 64 and cetostearyl alcohol were used at the highest composition levels (Figure ).
3.4. Spreadability
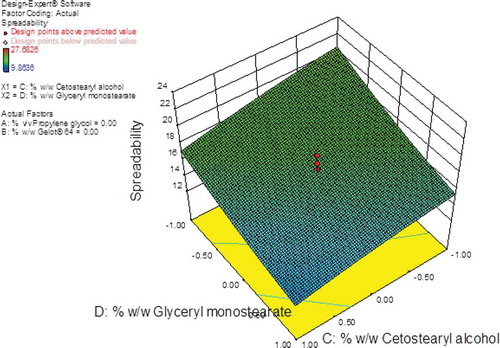
The largest F-value of 25.88 was observed for cetostearyl alcohol (A3) indicating that this parameter had the most significant effect on the spreadability of the creams when compared to the other formulation variables investigated. Glyceryl monostearate (A4) also had a significant effect on the cream formulations since the F- and P-values were 8.50 and < 0.05, respectively. The % w/w propylene glycol (A1) and Gelot® 64 (A2) had the least effect on spreadability since the F-values for these parameters were 4.36 and 1.67, respectively. The contour plot (Figure ) reveals that cetostearyl alcohol and glyceryl monostearate had a significant effect as the amounts of the excipients increased. An increase in the amount of cetostearyl alcohol resulted in a decrease in the spreadability of the creams with the value for this parameter reduced from ~16.0 cm2 to ~12.0 cm2 and an increase in the amount of glyceryl monostearate resulted in a decreased in the spreadability from ~11.8 cm2 to ~21.1 cm2.
Figure 8. Contour plot showing the effects of cetostearyl alcohol and glyceryl monostearate on the spreadability of the pilot scale CP cream formulations.
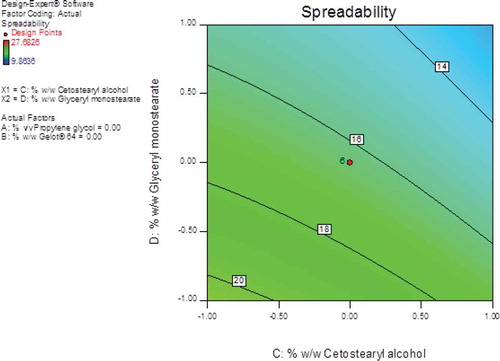
Viscous semi-solids have an increased number of emulsified particles, which in turn increase particle–particle interactions thereby restricting the movement of molecules resulting in a reduction in the spreadability of the creams (Honary et al., Citation2007). The 3D response-surface plot (Figure ) reveals that the overall combined effect of cetostearyl alcohol and glyceryl monostearate content resulted in a significant decrease in the spreadability of the formulations; therefore, the least spreadable formulation was the composition when cetostearyl alcohol and glyceryl monostearate were used at a maximum level.
Figure 9. 3D response surface plot showing the effects of cetostearyl alcohol and glyceryl monostearate on the spreadability of the pilot scale CP cream formulations.
3.5. pH
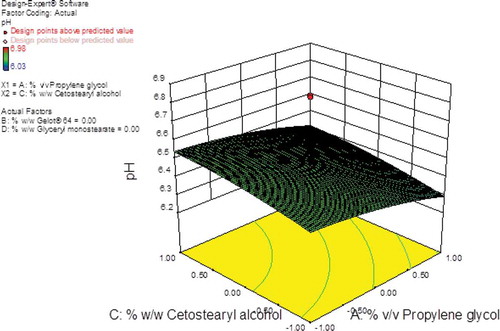
The largest F-values of 1.73 and 1.19 were observed for propylene glycol (A1) and cetostearyl alcohol (A3) respectively, indicating that these parameters had the most significant effect on pH of the creams when compared to the other formulation variables evaluated. Gelot® 64 (A2) and glyceryl monostearate (A4) have the least effect on pH with F-values of 0.037 and 0.024, respectively. The contour and the 3D response plots reveal that % v/v propylene glycol had the greatest effect on the creams when compared to cetostearyl alcohol as depicted in Figures and 1.
Figure 10. Contour plot showing the effects of propylene glycol and cetostearyl alcohol on the pH of the pilot scale CP cream formulations.
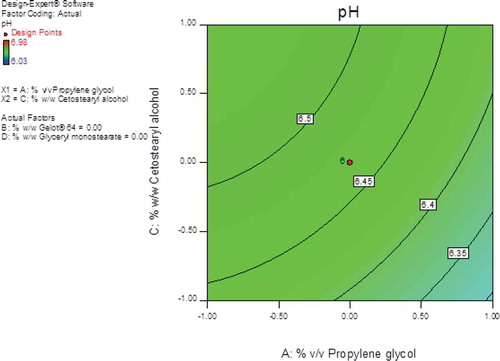
Figure 11. 3D response surface plot showing the effects of propylene glycol and cetostearyl alcohol on the pH of the pilot scale CP cream formulations.
3.6. CP content
Modeling of data for all formulation variables for this parameter viz., A1, A2, A3 and A4 produced F-values of <5.0 indicating that there was no significant effect on the % CP content of the creams. The effects of Gelot® 64 and cetostearyl alcohol were investigated as they had the most significant effects on the majority of the responses. These formulation variables had no effect on the % CP content of the creams and an increase in Gelot® 64 and cetostearyl alcohol content resulted in a % CP that ranged between ~98% and ~102% for all creams with no extreme minimum and maximum values observed for this parameter. Therefore, formulations contained uniformly distributed CP, despite the difference in composition of all 30 batches.
3.7. Tube extrudability
The largest F-value of 7.37 was observed for cetostearyl alcohol (A3) indicating that this parameter had the most significant effect on extrudability of the cream formulations when compared to other formulation variables. The other formulation variables for this parameter viz., A1, A2 and A4 produced F-values of <5.0 indicating that they did not have any significant effect on the extrudability of the creams and an increase in cetostearyl alcohol content from 3% to 13% w/w resulted in an increase in extrudability from ~176 to ~244 g/cm2.
3.8. Electrical conductivity
Cetostearyl alcohol (A3) produced the largest F-value of 12.16 and revealed that this component had the greatest effect on electrical conductivity of the creams. Propylene glycol (A1), glyceryl monostearate (A4) and Gelot® 64 (A2) had the least effect on electrical conductivity of the creams with resultant F-values of <5.0. An increase in cetostearyl alcohol content from 3% to 13% w/w resulted in a significant decrease in the electrical conductivity from ~800 µS/cm to ~200 µS/cm, suggesting that cream formulations that contain more cetostearyl alcohol are poor conductors due to the mixture of fatty alcohols present that consist predominantly of cetyl and stearyl alcohols that increase the oily nature of a cream base.
3.9. Percent CP released at 72 hours
The largest F-value of 11.14 was observed for glyceryl monostearate (A4) indicating that this parameter had a significant effect on the cumulative % CP released over 72 hours from the pilot scale cream formulations. Cetostearyl alcohol (A3) and Gelot® 64 (A2) were variables that were shown to have some effect on CP release since the F-values for this parameter were 6.11 and 6.84, respectively. The effects of propylene glycol (A1) were least significant with an F-value of 2.32 and therefore this parameter had the lowest impact on the cumulative % CP released from the test formulations over 72 hours. The contour and 3D response-surface plots reveal that Gelot® 64 had a slight effect on the cumulative % CP released whereas glyceryl monostearate had the greatest effect on this formulation parameter (Figures and 1).
Figure 12. Contour plot showing the effects of glyceryl monostearate and Gelot® 64on the cumulative % CP released over 72 hours from pilot scale CP cream formulations.
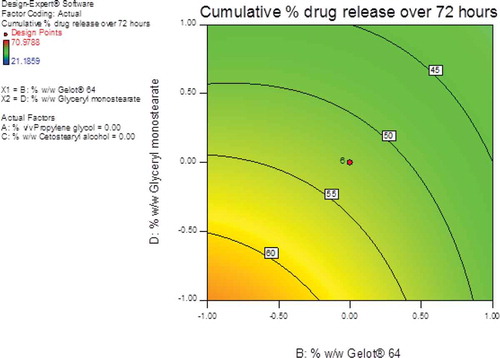
Figure 13. 3D response surface plot showing the effects of glyceryl monostearate and Gelot® 64 on the cumulative % CP released over 72 hours from pilot scale CP cream formulations.
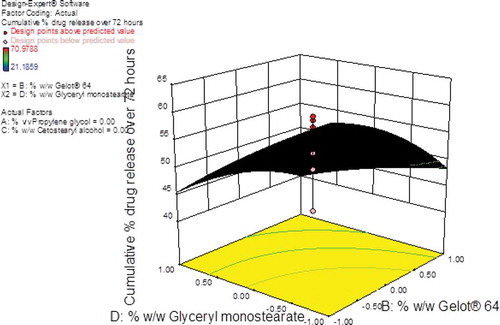
An increase in glyceryl monostearate content resulted in a decrease from ~61% to ~34% for the % CP released over 72 hours. The decrease in % CP released might be due to the increase in glyceryl monostearate and Gelot® 64 contents which, in turn, increases the viscosity of the pilot scale CP cream formulations. The strong and rigid visco-elastic gel microstructure located in viscous formulations hinders the ability of an API to diffuse from the base due to a decrease in the affinity of the base for water, thereby reducing water uptake from the receptor medium and subsequently a decrease in drug diffusion and release (Ballmann & Mueller, Citation2008).
3.10. Formulation optimization
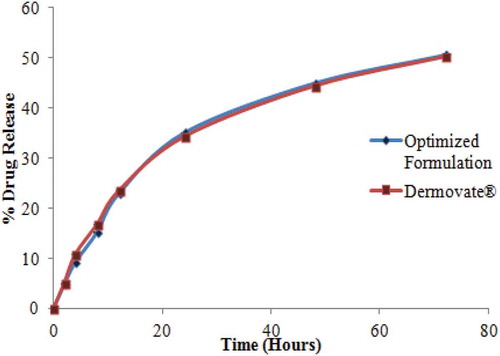
It is essential that scale-up manufcature of a generic formulation that exhibits similar physical and in vitro release properties to an innovator product such as Dermovate® cream is undertaken. It is clear that the different formulation responses monitored can be manipulated by modification of formulation compositon by changing the amount of emulsifier, penetration enhancer, and/or stiffening agent used. The optimum conditions for the manufacture of a generic pilot scale CP cream formulation were predicted using the optimization function of the Design-Expert® software. The target was to achieve a viscosity (B1), spreadability (B2), and a cumulative % CP released over 72 hours (B5) that was similar to a reference formulation, Dermovate® cream. The predicted values for the formulation variables in addition to the respective formulation responses generated from numerical optimization are summarised in Table . The optimal formulation consisted of 46% v/v propylene glycol, 8.6% w/w cetostearyl alcohol, 10.5% w/w glyceryl monostearate, and 3.8% Gelot® 64 that produced a formulation with a viscosity of 44633cP, spreadability of 24.91cm2, pH of 6.02, CP content of 101.23%, extrudability of 76.98 g/cm2, the electrical conductivity of 198.23 µS/cm and % CP release over 72 hours of 50.23%. The in vitro release profile for CP was evaluated for the optimal formulation and compared to that for Dermovate® (Figure ) and it evident that the profiles are similar.
Table 4. Predicted formulation variables and responses
Figure 14. Graphical representation of in vitro release profiles of the optimized pilot scale CP cream formulation in comparison to Dermovate® over 72 hours.
4. Conclusions
The impact of the amount of propylene glycol, Gelot® 64, cetostearyl alcohol, and glyceryl monostearate used in CP cream formulation on the properties of pilot scale CP cream formulations were analyzed and optimized using RSM. The 3-D response-surface plots and corresponding contour plots indicate that as the viscosity increases spreadability and % CP released at 72 hours decreases. Increasing the amount of cetostearyl alcohol, Gelot® 64, and glyceryl monostearate resulted in increased viscosity and a decrease in CP release. Cetostearyl alcohol and Gelot® 64 had the most significant effect on the quality of the cream formulations thereby explaining the critical behavior of o/w emulsifying agents in semi-solids. The use of statistical approaches facilitated optimization of the formulation composition for the manufacture of CP creams at a pilot scale level, with fewer experiments than if “a one factor at a time” approach had been used resulting in a more efficient outcome at a lower cost. The evaluation of changes in formulation composition on product performance facilitates the identification of the range of content that would permit manufacture of products that meet pre-determined target quality attributes. The results of this study clearly show the value of this approach in respect of assuring product quality.
Declaration of interest
The authors declare no conflict of interest.
Acknowledgements
The research work described was made possible by the financial assistance of the Research Committee of Rhodes University and the National Research Foundation (RBW).
Additional information
Funding
Notes on contributors
Ayeshah Fateemah Beebee Fauzee
Dr Fauzee is an experienced Scientific and Regulatory Affairs Manager and Pharmacist with a history of working in multinational Pharmaceutical and Food and Beverage (FMCG) Industries specifically in Regulatory Compliance, Scientific and Regulatory Advocacy and Sustainable Partnership with Authorities to support the life cycle of products. She holds Bachelor of Pharmacy, MSc (Pharmacy) Cum Laude and a PhD degree in Pharmaceutics from Rhodes University in South Africa.
Roderick Bryan Walker
Professor Walker runs an active research group that focusses on formulation and process development and design. Projects are undertaken within the current regulatory context and include development and validation of analytical tools for quality control and assurance. All projects make use of the principles of Quality by Design and entail risk assessment, design of experiments and application of Response Surface Methodology and mathematical modelling. Specifically, his current research focuses on the development, manufacture and assessment of solid oral extended release dosage forms, combination formulations, paediatric formulations, topical and transdermal drug delivery, regulatory sciences and policy development.
References
- Ballmann, C., & Mueller, B. (2008). Stabilizing effect of cetostearyl alcohol and glycerylmonstearate as co-emulsifiers on hydrocarbon-free O/W glyceride creams. Pharmaceutical Development and Technology, 13(5), 433–21. https://doi.org/10.1080/10837450802247952
- Chandira, R., Pasupathil, A., Bhowmik, D., Chiranjib, J. B., Tripathil, K., & Sampath, K. (2010). Design, development and formulation of antiacne dermatological gel. Journal of Chemical and Pharmaceutical Research, 2(1), 401–414.
- Chang, J., Huang, Y., Hou, S., Wang, R., Wu, P., & Tsai, Y. (2007). Formulation optimization of meloxicam sodium gel using response surface methodology. International Journal of Pharmaceutics, 338(1–2), 48–54. https://doi.org/10.1016/j.ijpharm.2007.01.033
- Conor, L., & McQuain, J. (2010). Strategies approached to process optimization and scale-up. Pharmacy Technician, 34(9), 1–4.
- Dahl, V., Friedrich, A., Meyer, J., Venzmer, J., Belkoura, L., Strey, R., Mayer, C., Michel, R., & Gradzielski, M. (2018). Structural analysis of a modern o/w-emulsion stabilized by a polyglycerol ester emulsifier and consistency enhancers. Colloids and Interfaces, 2 (1), 3. 3(1-18). https://doi.org/10.3390/colloids2010003
- El-Zaher, A., & Mahrouse, M. (2013). A validated spectrofluorimetric method for the determination of nifuroxazide through coumarin formulation using experimental design. Chemistry Central Journal, 90(7), 1–22. doi: 10.1186/1752-153X-7-90
- Emami, J. (2006). In vitro-In vivo correlation: From theory to applications. Pharm Pharmaceutical Science, 9(2), 169–189.
- Fauzee, A. Development, manufacture and assessment of clobetasol 17-propionate cream formulations. MSc thesis, Rhodes University 2011;1–291.
- Fauzee, A., & Walker, R. B. (2013). Forced degradation studies of clobetasol 17-propionate in methanol, propylene glycol, as bulk drug and cream formulations by RP-HPLC. Journal of Separation Science, 36(5), 849–856. https://doi.org/10.1002/jssc.201200969
- Fegade, S., Tande, B., Cho, H., Seames, W., Sakodynskaya, I., Muggli, D., & Kozliak, E. (2013). Aromatization of propylene over HZSM-5: A design of experiments (DOE) approach. Chemical Engineering Communications, 200(8), 1039–1056. https://doi.org/10.1080/00986445.2012.737385
- Golemanov, K., Tcholakova, S., Denkov, N., & Gurkov, T. (2006). Selection of surfactants for stable paraffin-in-water dispersions, undergoing solid−liquid transition of the dispersed particles. Langmuir, 22(8), 3560–3569. https://doi.org/10.1021/la053059y
- Gordon, M. (1998). The role of clobetasol propionate emollient 0.05% in the treatment of patients with dry, scaly, corticosteroid-responsive dermatoses. Clinical Therapeutics, 20(1), 26–39. https://doi.org/10.1016/S0149-2918(98)80032-5
- Honary, S., Chaigani, M., & Majidian, A. (2007). The effect of particle properties on the semisolid spreadability of pharmaceutical pastes. Indian Journal of Pharmaceutical Sciences, 69(3), 423–426. https://doi.org/10.4103/0250-474X.34554
- Honary, S., Pouneh, E., & Ghasemitabar, M. (2013). Preparation of gold nanoparticles for biomedical applications using chemometric technique. Tropical Jorunal of Pharmaceutical Research, 12(3), 295–298. DOI: 10.4314/tjpr.v12i3.3
- Junginger, H. E. (1984). Colloidal structures of O/W creams. Pharmaceutisch Weekblad Scientific Edition, 6(4), 141–149. https://doi.org/10.1007/BF01954041
- Kumar, L., & Verma, R. (2010). In vitro evaluation of topical gel prepared using natural polymer. . International Journal of Drug Delivery, 2(1), 58–63. https://doi.org/10.5138/ijdd.2010.0975.0215.02012
- Lenth, R. (2009). Response-Surface Methods in R , Using rsm. Journal of Statistical Software, 32(7), 1–16. https://doi.org/10.18637/jss.v032.i07
- Müller-Goymann, C. (1984). Liquid crystals in emulsions, creams, and gels containing ethoxylated sterols as surfactant. Pharmaceutical Research, 1(4), 154–185. https://doi.org/10.1023/A:1016392407150
- Rahul, N., Sevukarajan, M., Vishnu, P., & Kumar, A. (2011). Response surface methodology for the optimization of ethylcellulose microspheres. International Journal of Pharmtech Research, 3(2), 775–783.
- Sheikh, K., Saringat, S., & Bukhari, N. (2011). Investigation of factors affecting physicochemical properties of palm–olein creams using optimisation technique quality by design. Journal of Applied Pharmacy, 3(3), 301–319. https://doi.org/10.21065/19204159.3.301
- Singh, B., Bhatowa, R., & Kapil, R. (2011). Developing micro-/nanoparticulate drug delivery systems using “design of experiments”. International Journal of Pharmaceutical Investigation, 1(2), 75–87. https://doi.org/10.4103/2230-973X.82395
- Tan, I., & Hameed, A. (2008). Preparation of activated carbon from coconut husk: Optimization study on removal of 2,4,6-trichlorophenol using response surface methodology. Journal of Hazardous Materials, 153(1–2), 709–717. https://doi.org/10.1016/j.jhazmat.2007.09.014
- Tsai, J.-C. (2001). Content and transdermal delivery of clobetasol 17-propionate from commercial creams and ointments. Journal of Food and Drug Analysis, 10(1), 7–12.
- Walker, R. B., & Smith, E. (1996). The role of percutaneous penetration enhancers. Advanced Drug Delivery Reviews, 18(3), 295–301. https://doi.org/10.1016/0169-409X(95)00078-L
- Weheba, G., & Sanchez‐Marsa, A. (2006). Using response surface methodology to optimize the stereolithography process. Rapid Prototyping Journal, 12(2), 72–77. https://doi.org/10.1108/13552540610652401