
 ?Mathematical formulae have been encoded as MathML and are displayed in this HTML version using MathJax in order to improve their display. Uncheck the box to turn MathJax off. This feature requires Javascript. Click on a formula to zoom.
Abstract
The indoor air quality (IAQ) is paramount to the existence of humans considering the amount of time spent indoors. The indoor pollutant levels may be 100 times the levels outdoors. The indoor pollutants need to be considered to enhance better IAQ. This study determined the emission factors of carbon monoxide (CO) emitted from a standby electricity generator (SEG). It evaluated the impacts of CO concentrations on indoor air quality and identified appropriate ways to mitigate the CO concentrations. The indoor CO concentration was determined by simulating a number of scenarios of SEG operated outdoor using a Simulation Tool Kit for Indoor Air Quality and Inhalation Exposure (IAQX) model. Hourly measurements of mean CO concentrations in the ambient environment and wind speed were conducted for four weeks in four field locations. The emission rate of CO from the standby electricity generator was measured. The CO concentration from SEG was 2.4289 × 10⁴ mg/m3, a very high CO concentration. The CO emission factors were obtained as 2.2366 × 10³ kg/m3 of fuel consumed and 9.5411 × 10⁶ kg/hr of activity. High CO concentrations were obtained in microenvironments from the scenarios 1.28 × 10⁴ mg/m3, 4.78 × 10³ mg/m3, 4.79 × 10⁴ mg/m3 and 9.58 × 10⁴ mg/m3. The results showed that a high air exchange rate allowed CO concentrations to decay fast while low air exchange rates created an accumulation of CO concentrations indoor.
PUBLIC INTEREST STATEMENT
Indoor environment and associated indoor air quality (IAQ) challenges are not commonly discussed. This is due to dearth of relevant studies to evaluate IAQ standards in developing countries. The importance of IAQ is vital to the existence of humans considering amount of time spent indoors. The IAQ determines level discomfort, acute illness indoor and the indoor pollutants are often higher than outdoors. Lack of constant supply of electricity in developing countries contributes to the use of standby electricity generator (SEG) and other forms of power supply. SEG produces Carbon monoxide (CO) that contributes to indoor discomfort and causes death through CO-poisoning. This study evaluated impacts of CO concentrations on IAQ and identified appropriate ways to mitigate the CO concentrations indoor. The results of this study provide insight for operating SEG safely outdoors - close to residential areas. The proposed safety distance will decrease the fatality rate of operating the SEG indoor and physical injury that can occur when SEG explodes.
1. Introduction
Both outdoor and indoor environment activities contribute to and affect the concentration of pollutants, such as carbon monoxide (CO) in indoor air (Baek, Citation2019; Jones & Molina, Citation2017). The continuous exchange of atmospheric air between outdoor and indoor environments and the amount of time spent indoor is significant to IAQ. People typically spend a large fraction of their time in various indoor environments such as homes, schools, workplaces, shopping malls and restaurants (Abdel-Salam, Citation2019; Ana et al., Citation2019; Andualem et al., Citation2019; Hines, Citation1993; Jones & Molina, Citation2017; Mainka et al., Citation2018; Ngoma et al., Citation2018; Ścibor et al., Citation2019; Wangchuk et al., Citation2015; Wei et al., Citation2018; Wolkoff, Citation2018; Yocom, Citation1982). Generally, people spend about 90% of their time indoors (Baek, Citation2019; Bourdin et al., Citation2014; Carslaw, Citation2007; Chaloulakou et al., Citation2003). The studies of Abdel-Salam (Citation2019), Ścibor et al. (Citation2019), Marchand et al. (Citation2006), and Lu et al. (Citation2008) reported that urban people spend less than 90% indoors and only a mere 6% outdoors. In developing countries, the majority of those individuals exposed to unsafe concentrations of pollutants indoor are women, who are normally responsible for food preparation and cooking, and the infants and young children who spend time around their mother near the cooking area (Begum et al., Citation2009; Choo & Jalaludin, Citation2015; Garland et al., Citation2017; Kasangana et al., Citation2018; Kim et al., Citation2011; Taner et al., Citation2013; Vanker et al., Citation2015; Wang et al., Citation2017; Wei et al., Citation2018). Similarly, school IAQ is a global concern as children spend the second highest percentage of their time in schools (Mainka et al., Citation2015) and are especially susceptible to air pollution (Abdel-Salam, Citation2019; Al-Hemoud et al., Citation2017; Bragoszewska et al., Citation2018; Demirel et al., Citation2014; Guo et al., Citation2008; Jovanović et al., Citation2014; Krawczyk et al., Citation2016; Mainka et al., Citation2018; Weichenthal et al., Citation2008; Wichmann et al., Citation2010). The IAQ status and CO concentration exposure from point sources remain reoccurring challenge in developing countries.
1.1. Carbon monoxide indoor exposure
The indoor air pollutants may be classified base on discomfort, acute illness, carcinogenic, and chronic illnesses (Baek, Citation2019). Carbon monoxide (CO) is one of the pollutants that cause discomfort and acute illness. CO is a colourless, odourless, tasteless, non-irritating and toxic gas produced primarily during the incomplete combustion of carbonaceous fuels and substances (Baek, Citation2019; Festy et al., Citation2003; Hess-Kosa, Citation2019; Jones & Molina, Citation2017; Min et al., Citation2009a). High CO concentrations can cause acute CO intoxication by combining with the heamoglobin to produce carboxy-heamoglobin (COHB), and therefore disrupts sufficient transfer of oxygen from lung to human tissues (Han et al., Citation2017; Prockop & Chichkova, Citation2007; Reboul et al., Citation2012; Veronesi et al., Citation2017; Wolkoff, Citation2018). The high CO concentration hinders normal respiratory system function similar to a symptom of COVID-19 (Li et al., Citation2020). The CO emissions caused more than one-half of the fatal CO-poisonings reported in many countries; fatal cases also were grossly under-reported or miss-diagnosed by medical professionals (Cushen et al., Citation2019; Eberhardt et al., Citation2006; Lee et al., Citation2018; Min et al., Citation2009b; Veiraiah, Citation2020; Wolkoff, Citation2018). Lack of consistent supply of electricity in some developing countries led to seeking alternative standby electricity generators. The CO concentration exposure from SEG causes unintentional and suicidal CO-poisonings (Tirosh & Schnell, Citation2016) and estimation showed that more than half of the 6000 annual deaths from fires in the United States were caused by CO-poisoning. In addition, studies showed that 900 people died of CO-poisoning via using SEG and thousands were injured between 1999 and 2017 (Blässer et al., Citation2014; Cui et al., Citation2017; Cushen et al., Citation2019; Hampson & Dunn, Citation2015; Sircar et al., Citation2015; Veiraiah, Citation2020). The severity of CO-poisoning is dependent on concentration, length of exposure (Table ), and the general underlying health status of the exposed individual (Veronesi et al., Citation2017, Ramirez et al., Citation2014; Sandilands & Bateman, Citation2016; Cui et al., Citation2017; Veiraiah, Citation2020). Because carboxy-heamoglobin concentrations in blood are cumulative over time, prolonged exposure to low concentrations can result in considerable health effects (Table ) (Min et al., Citation2009a; Veronesi et al., Citation2017; Barn et al., Citation2018, Ramirez et al., Citation2014; Weaver et al., Citation2002; Veiraiah, Citation2020). The CO-poisoning cases are mostly related to emission from SEG, unlike other CO emission sources. The SEG is normally used to complement the epileptic supply of electricity in most developing countries. The users of the SEG often place it near their home or indoors based on concerns about SEG theft and noise to neighbours (Yi et al., Citation2020; Marcy & Ascone, Citation2005; Adefeso, Citation2010). The SEGs are normally used near the living room in the affected locations. Lawrence et al. (Citation2005) reported that the use of SEG in busy roads in India’s urban areas (central Indian region) contributed to the CO concentration indoor. U.S. Consumer Product Safety Commission showed that five out of hundred and four deaths caused by generator CO-poisoning were associated with a generator that was placed outside the home near open windows, doors, or vents (Adefeso, Citation2010; Cui et al., Citation2017; Hampson & Dunn, Citation2015; Marcy & Ascone, Citation2005; Sircar et al., Citation2015; Veiraiah, Citation2020). The health effects of CO-poisoning as it enters the blood system are presented in Table .
Table 1. Relationship between health effects and exposure to COHB %
The effects of exposure to high concentrations of CO had resulted in some deaths in Nigeria where more than 60 people suffocated to death in 2008 alone (Table ). Adefeso et al. (Citation2012) reported some cases of casualties from all geo-political zones in Nigeria where south-east (SE) with 47 casualties had highest followed by south-west (SW) with 28 though north-east (NE) and north-west (NW) had no reported cases between 2005 and 2008. Table presents also revised cases of CO-poisoning. The casualties from all geo-political zones in Nigeria where south-east (SE) with 72 casualties had highest followed by south-west (SW) with 61 cases, south-south 58 cases though north-east (NE) and north-west (NW) had no reported cases between 2008 and 2019. It showed that the causality from SEG CO-poisoning is still a challenge demanding answers.
Table 2. Revised cases of indoor CO-poisoning in Nigeria between 2005 and 2019
1.2. Indoor air quality model
Computer modelling techniques have been developed for indoor air quality studies. The study of Chaloulakou et al. (Citation2003) used the mass-balance formulation developed by Hayes (Citation1989) to simulate indoor concentrations of CO concentration in a public school building. INTAIR developed by these authors (Ashmore & Dimitroulopoulou, Citation2009; Dimitroulopoulou et al., Citation2001) is a deterministic compartment model that allows indoor concentrations to be simulated into two separate microenvironments. According to the studies of Tong et al. (Citation2017), Vallamsundar et al. (Citation2016), Cushen et al. (Citation2019), and Ocak et al. (Citation2016) reported that indoor concentration is a function of outdoor concentration in the event of an accidental release or chemical attack involving toxic substances. The indoor concentration of pollutants can be related to outdoor concentration using a single model such as IAQX model. According to the study of Adefeso (Citation2010), the IAQX model was modified to produce EquationEquation (1)(1)
(1) which was used in this study:
Where:
Vi = the volume of zone I, (m3); Ci = pollutant concentration in a zone I (mg/m3); t = time, (hr);
nR = number of indoor sources in zone i; Rj = emission rate for indoor source j in zone i (mg/hr);
p = the penetration factor for zone i (unitless); Q0i = infiltration airflow rate from outdoors to zone i (m3/hr); C0 = pollutant concentration in ambient air (mg/m3); nz = number of air zones;
Qki = airflow rate from zone k to zone i and k … i (m3/hr); Ck = pollutant concentration in zone k (mg/m3) and Qik = airflow rate from zone i to zone k and k … i (m3/hr).
The continuous occurrence of CO-poisoning and casualties from SEG and other point sources are of serious health concerns. The source of CO-poisoning might have been identified but scientific basis for CO emissions from SEG and other sources linked to suffocation indoor are yet to be understood particularly, in developing countries. The aims of this study were to identify and quantify the CO emissions sources and, to collect wind speed data in an ambient environment. The IAQ Model was used to simulate and to investigate the link between CO emitted from SEG and other sources linked to suffocation. However, the IAQ model was used to investigate the use of SEG in developing countries. The investigation of CO-poisoning on IAQ with the IAQX model is expected to contribute to an understanding of the prevalent impact of CO on IAQ in developing countries. The modelling results were used to recommend an appropriate approach to use SEG around indoor environments.
2. Materials and methods
The study investigated the impacts of one CO pollutant distribution in microenvironments (rooms, kitchen, verandah, and hallway) air and impact on indoor air quality. Some scenarios were considered for the research where natural ventilation parameters, the emission factor of the CO concentration from an SEG positioned in verandah, hallway, and outdoor position while windows and doors were assumed open. The study simulated CO concentrations with the modified IAQX model to predict the CO concentration in the microenvironment and provided some important insights for operating an SEG safely in homes and commercial activities buildings.
2.1. Sampling location
The research study sampling locations are located in south-west region of Nigeria with longitude: 4º 31ʹ E and latitude: 7º 33ʹ N. The selected locations are associated with heavy traffic and traffic congestions at rush hours (6.30–8.30 am and 6.00–8.30 pm) while commercial activities are characterized with frequent use of SEG in daily commercial activities. Hourly measurements of CO concentrations in ambient environment and wind speed were conducted for four weeks in four field locations.
2.2. Sampling procedure
The CO concentration in the ambient environment was measured using an in situ non-integrated single gas CO ToxiRAE II Model PGM-1150 monitor. Wind speed was measured with a Turbo Flow Meter 271 (Davis Instruments). The emission rate of CO from the SEG was measured using an ECLIPSE EGA4 combustion analyzer. The ToxiRAE CO analyzer was used for the ambient measurement of CO concentrations at the selected locations while the ECLIPSE EGA4 combustion analyzer was used for source emission measurement from the SEG. Four locations (A-D) were selected for measurement of CO and wind speed; location D serves as control which was mainly residential area with no commercial activity and very low motor vehicle traffic (Table ). The locations are associated with heavy traffic and traffic congestions at rush hours (6.30–8.30 am and 6.00–8.30 pm) while commercial activities are characterized by the use of the SEG. Samplings were carried out in these locations at height 1.50 m above ground level. Sampling points were selected for those locations ranging between 1.50 m - 3.00 m from the road while the height at which the winds speed was taking ranges from 1.50 m to 2.00 m from ground level and the monitoring was performed between 6.30–8.30 am and 6.00–8.30 pm during weekdays and weekends, respectively. The traffic density was also monitored through counting per hour number of vehicles and motorcycles. One of the locations serves as control which was mainly residential area with no commercial activity (no SEG) and very low motor vehicle density (Table ).
Table 3. Traffic densities in various locations
The CO concentrations (mg/m3 and ppm), exhaust velocity (m/s), and emission factors (mg/GJ and mg/kW) were determined from the SEG to obtain CO emission factors and CO exhaust flowrate. The CO exhaust emission concentrations and its velocity (to determine exhaust flow rate) from the generator were measured with the ECLIPSE EGA4 combustion analyzer and the turbo flow meter respectively. The heating value of gasoline and other indoor pollutants were obtained from the USEPA database.
2.3. IAQX model simulation
The IAQX Model was used in this study because of user-friendly interface with the building has fixed data (Table ); can simulate more than one pollutant and volumetric flow rates between indoor and outdoor environments. Thus indoor source terms, outdoor source terms, and outdoor-indoor exchange rate term are considered and they are the main terms in EquationEquation (1)(1)
(1) as presented in EquationEquations (2
(2)
(2) )–(Equation4
(4)
(4) ).
Table 4. Microenvironment volumes, volumetric flow, and their peculiar indoor activities
Regarding initial EquationEquation (1)(1)
(1) , other terms are negligible because CO does not exhibit adsorption/desorption characteristics, absorption characteristics, particulate matters and chemical reaction activities during the simulation of the scenarios in indoor microenvironments.
Scenarios were created with six microenvironments which are a living room/living area, two bedrooms, hallway, verandah, and kitchen (Figure and Table ). In this study, emissions from the identified sources were considered as input parameters into the modelling tool with all the sources and parameters. The scenarios and the building microenvironment represent an average use of SEG in Nigeria. Some of the scenarios are; scenario 1, the SEG was kept in the verandah for 4 hr in the morning and 8 hr in the night, cooking activities in kitchen windows and doors opened in the morning but doors closed in the night while windows were partially opened but that of Bedroom closed. Scenario 3 showed that SEG was kept in verandah 4 hr in the morning and 8 hr in the night, indoor activities, windows, and doors were opened in the morning but doors closed in the night while windows were opened with high wind speed. Scenarios 4 and 5 kept SEG in the hallway and verandah for 24 hr in the morning with no indoor sources. Windows and doors were opened in the morning but doors were closed in the night with windows partially opened for both scenarios. Scenario 7 kept SEG in the verandah for 4 hr in the morning and 11 hr in the night in the hallway, cooking activities in kitchen windows and doors opened in the morning but doors closed in the night while windows were partially opened. The Bedroom2 doors and windows were closed. Scenario 8 kept SEG in the verandah for 4 hr in the morning and 11 hr in the night in the hallway with very low wind speed, cooking activities in kitchen windows and doors opened in the morning but doors closed in the night while windows were partially opened.
Figure 1. Building plan for IAQX Model simulation.

Scenarios 9 and 10 kept SEG in a prescribed location A from the building for 4 hr in the morning and 11 hr in the evening and 24 hr respectively with no indoor sources, windows and doors were opened in the morning but doors were closed in the night but while windows partially opened. Some of the scenarios are presented in Table .
Table 5. Possible combinations of indoor and outdoor source in selected scenarios
3. Results and discussion
3.1. CO concentrations and wind speed
Various combustion activities are responsible for uncontrolled CO emissions. More than 200 different types of SEG were observed during the sampling in all locations except location D. The CO emission concentration obtained from the SEG was very high and the implication of this on IAQ. Source CO concentration from SEG was 2.4289 × 10⁴ mg/m3, a very high CO concentration with emission factor 2982.20 mg/g of gasoline and other indoor activities that emit CO are presented in Table . The CO emission factors for the SEG were 2370 × 103 kg/m3 of gasoline consumed and 9.5410 × 10⁶ kg/hr of activity. This is higher than the operational emission factor of 1.00 × 10⁶ kg/hr reported Wang and Emmerich (Citation2010).
Table 6. CO emission factors of indoor and outdoor activities
The SEG CO emission is extremely high compared to other studies as a point emission source for CO pollutant (Emmerich & Dols, Citation2016; Wang & Emmerich, Citation2010; Wang et al., Citation2013). With over 200 SEG scatter all over the sampling locations, the CO emission will have great impacts on IAQ - CO-poisoning may be triggered. However, if the good air exchange rate or good ventilation is ensured, it may enhance fast decay of CO concentration level. This is maybe because of the inert characteristics of CO at ambient temperature. The ambient CO concentrations at designated locations were obtained to be in following ranges - A (0.00–109.00 ppm), B (0.00 – 125.00 ppm), C (0.00 – 42.00 ppm) and D (0.00 − 12.00 ppm) while the overall mean CO concentrations were 11.9010 ± 10.6130 ppm (Table ). The CO concentration levels in locations A and B were higher than C and D locations, respectively. This is due to the CO concentration contribution from other outdoor sources (outsource terms in the modified model in EquationEquations (1(1)
(1) ) and (Equation3
(3)
(3) ) such as SEGs and a high number of vehicles and motorcycles. However, the location C vehicle and motorcycle count was higher than the location A but CO concentration level was lower than that of location A. The lower value CO concentration was due to a higher wind speed recorded in location C which, was responsible for the reduction in CO concentration observed in location C. The wind speed measured at those designated locations is A (0.00 m/s and 1.80 m/s), B (0.00 m/s and 1.20 m/s), C (0.00 m/s and 3.20 m/s) and D (0.00 m/s and 2.10 m/s). The overall mean wind speed was 0.1742 ± 0.2911 m/s (Table ). The values obtained for CO concentration are also higher than 1.10 ppm reported at 0.60 m/s wind speed (Zuraimi & Tham, Citation2008). The wind speeds obtained from all the locations affected the CO concentration levels in all the sampling locations either increasing the CO concentration or reducing it. This affects the outdoor-indoor exchange rate as presented in EquationEquation (4)
(4)
(4) . Location B with the lowest wind speed had the highest CO concentration while location C with a relatively high number of vehicles and motorcycles had 42 ppm of CO concentration because of a high wind speed of 3.20 m/s. The location D had the lowest value of CO concentration because of relatively high wind speed, the lowest number of vehicle and motorcycle count. The natural wind speed, number of SEGs, number of vehicles and motorcycle count play important role in ambient CO concentration levels. The mean CO concentration (11.9010 ± 10.6130 ppm) and mean wind speed (0.1742 ± 0.2911 m/s) shall be considered part of the input parameter (EquationEquations (1
(1)
(1) ) and (Equation4))
(4)
(4) for simulation of CO concentration level profile in microenvironments. The outdoor-indoor exchange rate term as presented in EquationEquation (4)
(4)
(4) is a function of the wind speed and its directions.
Table 7. Summary of mean and standard deviation (SD) hourly outdoor CO concentrations and wind speeds distribution for the field sampling
3.2. CO concentrations profile in indoor microenvironments
The IAQ CO concentration level is mostly generated by outdoor activities via various combustion of carbonaceous substances to release oxides of carbon. The indoor contribution of CO concentration indoor is minimal until SEG is introduced to indoor microenvironments. The modified IAQX model (EquationEquation 1(1)
(1) ) was used to model the characteristics CO concentration profile in those indoor microenvironments. The results of the simulation CO concentration level show influence of the emission of the SEG on IAQ as shown in EquationEquation 3
(3)
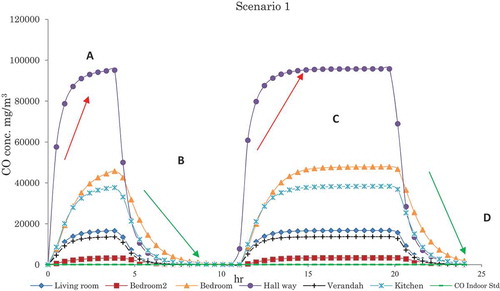
(3) . The highest CO concentration was obtained in the hallway (Figure ) - 9.5800 x 10⁴ mg/m3. The following highest CO concentrations were obtained in rooms from the scenarios as 1.2800 × 10⁴ mg/m3 in the living room, 4.7800 × 10³ mg/m3 in bedroom2, 4.7900 × 10⁴ mg/m3 in the bedroom and 9.5800 × 10⁴ mg/m3 in hallway respectively (scenario 1). The high CO concentrations obtained from the IAQX model for the hallway indicate the contribution of SEG exhaust of CO pollutant to indoor air of microenvironments while the influence of other indoor activities is not significant. Bedroom and kitchen CO concentrations are higher than those of bedroom2 and living because the position C of SEG (Figure ) is close to the bedroom and kitchen. The position C of SEG as shown in Figure showed that 80% of COHb (Table ) in the blood and this is a typical scenario that might be responsible for number of causalities presented in Table . Also, it might be linked to the influx of CO concentration flux into the indoor microenvironments and increased the indoor source term (EquationEquations (1
(1)
(1) ) and (Equation2))
(2)
(2) concentration contribution to indoor air.
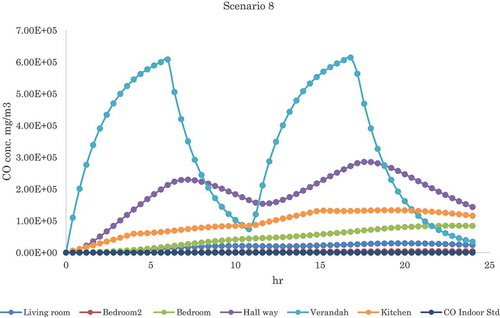
Figure 2. Scenario 8 plotted CO conc. profile in microenvironments in mg/m3.
Operating the SEG for 24 hours indicated in Figure where the CO concentration increases exponentially while there were no indoor activities (scenario 2) while in scenario 3 SEG is located in verandah position B (Figure ). Both follow the same trend of CO concentration profile. The CO concentrations of bedroom and kitchen were also higher than the remaining rooms. It was obvious that the living room and bedroom2 always have the lowest CO concentrations in all cases. This maybe because of proximity of SEG (the indoor-outdoor exchange rate in EquationEquation (4))(4)
(4) and absence of indoor activities but distance plays a major role in the CO concentration profile. However, values obtained for scenario 5 (Figure ) are below <10 ppm (Baek, Citation2019; Fan & Zhang, Citation2001; Veiraiah, Citation2020). The location was situated far away from the building to allow for diffusion and decay of CO concentrations. Scenario 4 (Figure ) showed that low air exchange rate (the indoor-outdoor exchange rate in EquationEquation (4))
(4)
(4) caused accumulation of CO concentration in indoor microenvironments as the concentration could not decay to zero for some time and it does not agree with Milner et al. (Citation2011) which reported that wind speeds affected outdoor CO concentration levels and higher wind speeds resulted in a lower indoor level in absence of indoor sources. It was found that an inverse relationship exists between wind speeds and indoor concentrations (regardless of the wind directions) since low wind speeds (indoor-outdoor exchange rate in EquationEquation (4))
(4)
(4) favour accumulation of CO concentration pollutant in microenvironments. The results from the model revealed that the hallway CO concentration was the highest compared to other rooms in the building (Figure ) and exceeded the indoor air quality standard of <10 ppm as suggested by Baek (Citation2019). The air exchange rate may have an impact on the CO concentration profile, as the strength of dilution or decay of indoor CO concentration level is a function of indoor-outdoor exchange rate as shown in EquationEquations (1
(1)
(1) ) and (Equation4
(4)
(4) ). It was noted that the scenarios which had the highest CO concentrations in microenvironments pose a danger to indoor comfort and health and the possible had been presented in Tables and respectively.
Figure 3. CO concentration profile in indoors for different SEG position scenario 2 (refer to Table ).
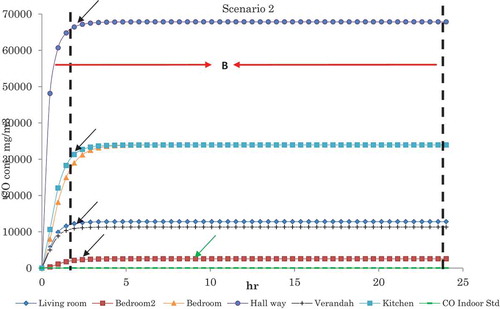
Figure 4. CO concentration profile in indoor for different SEG position scenario 5 (refer to Table ).
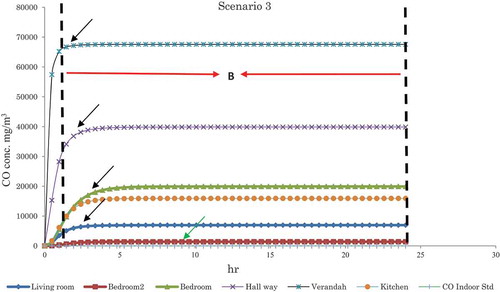
Figure 5. CO concentration profile in indoors for different SEG position scenario 4 (refer to Table ).
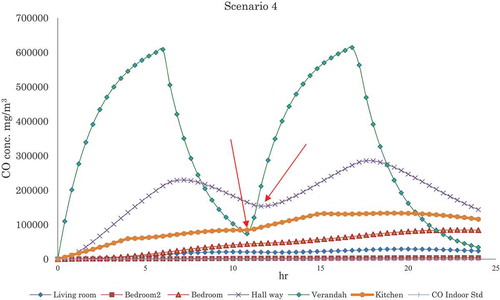
Figure 6. CO concentration profile in indoors for different SEG position scenario 1 (refer to Table ).
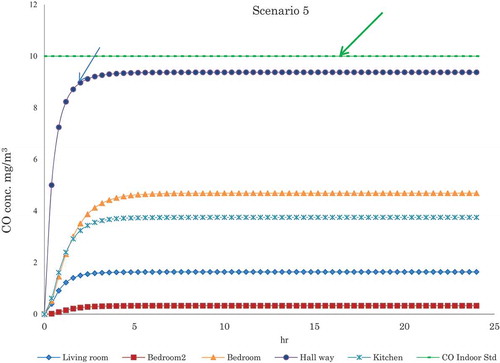
Figure 6. (Continued).
Figure 7. CO concentration profile in indoors for different SEG position scenario3 (refer to Table ).
It was unsafe to use the SEG in the hallway overnight because the CO concentration level remained constant. The constant and high CO concentration might be responsible for death from CO-poisoning when using the SEG indoor at position B or C overnight (Table ). Various sections highlighted and marked in Figures – (zone A and C in scenario 1 and zone B in scenarios 2 and 3) showed high CO concentrations build-up that pose health risk for humans (Table ). Scenarios 5 showed that the SEG was kept in a prescribed location A (Figure ) from the building, operated for 24 hr with active ventilation (windows and doors opened) in the morning but doors closed in the night while windows were partially opened which resulted in low CO concentrations in the microenvironments. The values obtained were below the recommended standard CO concentration (<10 ppm) (Baek, Citation2019; Veiraiah, Citation2020; Yi et al., Citation2020). Scenario 5 or with scenario indicating SEG was used occasionally could be considered the safest way to use SEG in homes and other commercial activities. However, according to Harrop (Citation2002), the value of 10% COHb (Table ) will give no symptoms of any serious health effects.
Figure : Scenario7 plotted CO conc. profile in microenvironments in mg/m3
The indoor CO concentration of less than or equal 90 mg/m3 will pose no danger to human health if the concentration does not increase or accumulate over a long time under poor ventilation scenarios. However, inappropriate use of this SEG may account for unintentional deaths among frequent users of SEG (Blässer et al., Citation2014; Cui et al., Citation2017; Cushen et al., Citation2019; Emmerich & Dols, Citation2016; Hampson & Bodwin, Citation2013; Hampson & Dunn, Citation2015; Sircar et al., Citation2015; Yi et al., Citation2020). The air exchange rate had an impact on the CO concentration profile as the strength of dilution or decay of indoor CO level is a function of air volumetric flow rate in and out of those microenvironments. Scenarios 4, 5 and 7 depicted the worst scenarios where SEG was wrongly used and run for several hours. Particularly Scenario 7 which had the highest CO concentrations indoor because the SEG was kept in the Hallway at the night. The CO concentration level remained constant and the concentration was maintained. This was the reason why some people suffocated to death overnight (Table ).
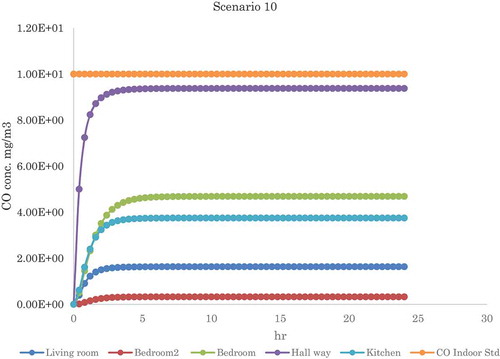
Moreover, the CO-poisoning casualties in the country have not reduced as the SEG is only a viable alternative for various small-scale businesses and sources of electricity in most urban locations in Nigeria while the complexity of challenges in energy and electricity demand and supply are so enormous. Scenarios 9 and 10 results showed low CO concentrations in the indoor environment. The values obtained were below the standard (<10 ppm) (Figures and ) (Choi et al., Citation2019; Fan & Zhang, Citation2001) and recommendation of Hess-Kosa (Citation2019). These scenarios are very good ways the SEG can be operated in homes. The challenges of electricity supply are due to lingering infrastructural gaps, centralized and closed grid system (Adhekpukoli, Citation2018; Bamisile et al., Citation2020; Edomah, Citation2019; Edomah et al., Citation2017; Oyewo et al., Citation2018; Ugwoke et al., Citation2020). If the demand for electricity is not fulfilled by the government, the CO-poisoning will persist. The reported casualties’ cases of CO-poisoning are frequent occurrences in Nigeria presented in Table , between 2008 and 2019 are well over 260 casualties were reported though most of the CO-poisoning cases were not reported.
Figure 8. Scenario 9 plotted CO conc. profile in microenvironments in mg/m3.
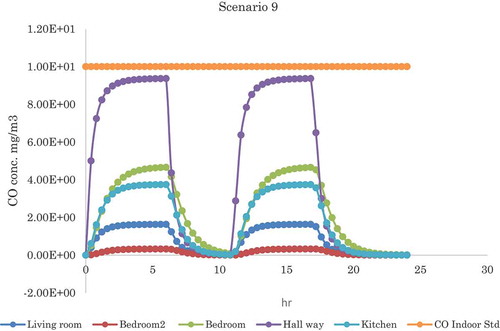
Figure 9. Scenario 10 plotted CO conc. profile in microenvironments in mg/m3.
4. Conclusions
The CO concentrations emitted by the inappropriate use of SEGs were very high as indicated by the source measurement and a high emission rate of CO concentration. This poses a threat to life if operated indoors or at close proximity (less than the safe distance of 10 m downwind) to buildings. Likewise, explosion of SEG can contribute to casualties of CO-poisoning. Outdoor-indoor relationship concentration was established. Natural ventilation rates affect level of concentrations of CO concentration in microenvironments. Under low or poor ventilation rates, the CO concentrations do not decay to zero value even after many hours the SEG has been shut down while under high ventilation rates, the indoor CO concentrations do decay to zero in few minutes. Operating the SEG indoor resulted in a high accumulation of CO concentrations in microenvironments which could cause death within a short time. The results of this study provide insight for operating SEG safely outdoors (close to residential areas) and establish the impact that may result from inappropriate use of the SEG on indoor air quality. Adherence to the proposed safety distance will effectively decrease the fatality rate of operating the SEG indoor and physical injury that can occur when SEG explodes.
Cover Image
Source: Author.
Additional information
Funding
Notes on contributors
Ismail Babatunde Adefeso
Ismail Babatunde Adefeso is a Postdoctoral Research Fellow in Department of Chemical Engineering, Faculty of Engineering and Built Environment, Durban University of Technology, Steve Biko Campus, Durban 4001, Durban, South Africa. I obtained my Doctoral Degree at the Department of Chemical Engineering, Faculty of Engineering and Built Environment, Cape Peninsula University of Technology, Cape Town, South Africa. My first degree (BSc (Hons)) and second degree (MSc) were obtained at the Department of Chemical Engineering, Faculty of Engineering, Obafemi Awolowo University, Nigeria. My research interests are alternative energy resources, municipal solid waste re-use and management (waste-to-energy)/cleaner/greener energy technology; thermo-chemical conversion modelling (Aspen Plus®), biomass utilization and renewable energy. Air pollution, outdoor and indoor air quality monitoring, indoor air quality modelling, emission factor determination for stationary and mobile sources from chemical processes are environmental areas of my research interests. This study is an integral path of environmental challenges from utilization of fossil fuel-powered standby electricity generator.
References
- Abdel-Salam, M. M. M. (2019). Investigation of indoor air quality at urban schools in Qatar. Indoor and Built Environment, 28(2), 278–20. https://doi.org/10.1177/1420326X17700948
- Adefeso, I., Sonibare, J., Akeredolu, F., & Rabiu, A. (2012). Environmental impact of portable power generator on indoor air quality. 2012 International Conference on Environment, Energy and Biotechnology. Singapore: Kuala Lumpu, Malaysia IACSIT Press.
- Adefeso, I. B. 2010. A study of outdoor-indoor exchange of carbon monoxide from a standby electricity generator MSc Chemical engineering full research thesis. Obafemi Awolowo University.
- Adhekpukoli, E. (2018). The democratization of electricity in Nigeria. The Electricity Journal, 31(2), 1–6. https://doi.org/10.1016/j.tej.2018.02.007
- Al-Hemoud, A., Al-Awadi, L., Al-Rashidi, M., Rahman, K. A., Al-Khayat, A., & Behbehani, W. (2017). Comparison of indoor air quality in schools: Urban vs. Industrial ‘oil & gas’ zones in Kuwait. Building and Environment, 122, 50–60. https://doi.org/10.1016/j.buildenv.2017.06.001
- Ana, G. R., Alli, A. S., Uhiara, D. C., & Shendell, D. G. (2019). Indoor air quality and reported health symptoms among hair dressers in salons in Ibadan, Nigeria. Journal of Chemical Health and Safety, 26(1), 23–30. https://doi.org/10.1016/j.jchas.2018.09.004
- Andualem, Z., Gizaw, Z., Bogale, L., & Dagne, H. (2019). Indoor bacterial load and its correlation to physical indoor air quality parameters in public primary schools. Multidisciplinary Respiratory Medicine, 14(1), 2. https://doi.org/10.1186/s40248-018-0167-y
- Ashmore, M. R., & Dimitroulopoulou, C. (2009). Personal exposure of children to air pollution. Atmospheric Environment, 43(1), 128–141. https://doi.org/10.1016/j.atmosenv.2008.09.024
- Baek, S. O. (2019). Assessing indoor air quality. In J. Nriagu (Ed.), Encyclopedia of environmental health (2nd ed.). Elsevier.
- Bamisile, O., Huang, Q., Xu, X., Hu, W., Liu, W., Liu, Z., & Chen, Z. (2020). An approach for sustainable energy planning towards 100 % electrification of Nigeria by 2030. Energy, 197, 117172. https://doi.org/10.1016/j.energy.2020.117172
- Barn, P., Giles, L., Heroux, M. E., & Kosatsky, T. (2018). A review of the experimental evidence on the toxicokinetics of carbon monoxide: The potential role of pathophysiology among susceptible groups. Environmental Health, 17(1), 13. https://doi.org/10.1186/s12940-018-0357-2
- Begum, B. A., Paul, S. K., Hossain, M. D., Biswas, S. K., & Hopke, P. K. (2009). Indoor air pollution from particulate matter emissions in different households in rural areas of Bangladesh. Building and Environment, 44(5), 898–903. https://doi.org/10.1016/j.buildenv.2008.06.005
- Blässer, K., Tatschner, T., & Bohnert, M. (2014). Suicidal carbon monoxide poisoning using a gas-powered generator. Forensic Science International, 236, e19–e21. https://doi.org/10.1016/j.forsciint.2013.12.016
- Bourdin, D., Mocho, P., Desauziers, V., & Plaisance, H. (2014). Formaldehyde emission behavior of building materials: On-site measurements and modeling approach to predict indoor air pollution. Journal of Hazardous Materials, 280, 164–173. https://doi.org/10.1016/j.jhazmat.2014.07.065
- Bragoszewska, E., Mainka, A., Pastuszka, J. S., Lizończyk, K., & Desta, Y. G. (2018). Assessment of bacterial aerosol in a preschool, primary school and high school in Poland. Atmosphere, 9(3), 87. https://doi.org/10.3390/atmos9030087
- Carslaw, N. (2007). A new detailed chemical model for indoor air pollution. Atmospheric Environment, 41(6), 1164–1179. https://doi.org/10.1016/j.atmosenv.2006.09.038
- Chaloulakou, A., Mavroidis, I., & Duci, A. (2003). Indoor and outdoor carbon monoxide concentration relationships at different microenvironments in the Athens area. Chemosphere, 52(6), 1007–1019. https://doi.org/10.1016/S0045-6535(03)00263-7
- Choi, D. S., Kim, Y.-M., Lee, I. H., Jeon, K.-J., Choi, B. J., & Park, Y.-K. (2019). Study On the contribution ratios of particulate matter emissions in differential provinces concerning condensable particulate matter. Energy & Environment, 30(7), 1206–1218. https://doi.org/10.1177/0958305X19843555
- Choo, C. P., & Jalaludin, J. (2015). An overview of indoor air quality and its impact on respiratory health among Malaysian school-aged children. Reviews on Environmental Health, 30(1), 9–18. https://doi.org/10.1515/reveh-2014-0065
- Cui, L. L., Zhou, J. W., Geng, X. Y., Li, X. W., Liu, Z., Conway, G. A., & Zhang, J. (2017). Occupational carbon monoxide poisoning associated with diesel motor operation in an air-raid shelter in June 2015, Jinan City, China—An epidemiological investigation. Biomedical and Environmental Sciences, 30(10), 777–781. https://doi.org/10.3967/bes2017.105
- Cushen, R., Brunt, H., Jones, S., Lewis, H., Callow, P., & Kibble, A. (2019). An unusual incident: Carbon monoxide poisoning risk in 540 homes due to faulty wood burner installations. Public Health, 173, 17–20. https://doi.org/10.1016/j.puhe.2019.05.003
- Demirel, G., Özden, Ö., Döğeroğlu, T., & Gaga, E. O. (2014). Personal exposure of primary school children to BTEX, NO2 and ozone in Eskişehir, Turkey: Relationship with indoor/outdoor concentrations and risk assessment. Science of the Total Environment, 473–474, 537–548. https://doi.org/10.1016/j.scitotenv.2013.12.034
- Dimitroulopoulou, C., Ashmore, M. R., Byrne, M. A., & Kinnersley, R. P. (2001). Modelling of indoor exposure to nitrogen dioxide in the UK. Atmospheric Environment, 35(2), 269–279. https://doi.org/10.1016/S1352-2310(00)00176-X
- Eberhardt, M., Powell, A., Bonfante, G., RUPP, V., Guarnaccia, J. R., Heller, M., & Reed, J. (2006). Noninvasive measurement of carbon monoxide levels in ED patients with headache. Journal of Medical Toxicology, 2(3), 89–92. https://doi.org/10.1007/BF03161015
- Edomah, N. (2019). Governing sustainable industrial energy use: Energy transitions in Nigeria’s manufacturing sector. Journal of Cleaner Production, 210, 620–629. https://doi.org/10.1016/j.jclepro.2018.11.052
- Edomah, N., Foulds, C., & Jones, A. (2017). Policy making and energy infrastructure change: A Nigerian case study of energy governance in the electricity sector. Energy Policy, 102, 476–485. https://doi.org/10.1016/j.enpol.2016.12.053
- Emmerich, S. J., & Dols, W. S. (2016). Model validation study of carbon monoxide transport due to portable electric generator operation in an attached garage. Journal of Building Performance Simulation, 9(4), 397–410. https://doi.org/10.1080/19401493.2015.1066447
- Fan, C.-W., & Zhang, J. (2001). Characterization of emissions from portable household combustion devices: Particle size distributions, emission rates and factors, and potential exposures. Atmospheric Environment, 35(7), 1281–1290. https://doi.org/10.1016/S1352-2310(00)00399-X
- Festy, B. R., Aurousseau, M. E., Boulu, R. G., & Jamet, J. L. (2003). Report of the “Health and Environment” commission of the National Academy of pharmacy. Carbon monoxide and environmental health: Are carbon monoxide levels in urban areas a health hazard? Annales pharmaceutiques francaises, 61(5), 310–329.
- Garland, C., Delapena, S., Prasad, R., L’Orange, C., Alexander, D., & Johnson, M. (2017). Black carbon cookstove emissions: A field assessment of 19 stove/fuel combinations. Atmospheric Environment, 169, 140–149. https://doi.org/10.1016/j.atmosenv.2017.08.040
- Guo, H., Morawska, L., He, C., & Gilbert, D. (2008). Impact of ventilation scenario on air exchange rates and on indoor particle number concentrations in an air-conditioned classroom. Atmospheric Environment, 42(4), 757–768. https://doi.org/10.1016/j.atmosenv.2007.09.070
- Hampson, N. B., & Bodwin, D. (2013). Toxic CO-ingestions in Intentional Carbon Monoxide Poisoning. The Journal of Emergency Medicine, 44(3), 625–630. https://doi.org/10.1016/j.jemermed.2012.08.033
- Hampson, N. B., & Dunn, S. L. (2015). Carbon monoxide poisoning from portable electrical generators. The Journal of Emergency Medicine, 49(2), 125–129. https://doi.org/10.1016/j.jemermed.2014.12.091
- Han, B., Hu, L. W., & Bai, Z. (2017). Human exposure assessment for air pollution. Advances in Experimental Medicine and Biology, 1017, 27–57.
- Harrop, O. (2002). Air quality assessment and management: A practical guide. London, CRC Press.
- Hayes, S. R. (1989). Estimating the effect of being indoors on total personal exposure to outdoor air pollution. Japca, 39(11), 1453–1461. https://doi.org/10.1080/08940630.1989.10466640
- Hess-Kosa, K. (2019). Indoor air quality: The latest sampling and analytical methods. CRC Press Taylor & Francis Group.
- Hines, A. L. (1993). Indoor air: Quality and control. PTR Prentice Hall.
- Jetter, J. J., GUO, Z., Mcbrian, J. A., & Flynn, M. R. (2002). Characterization of emissions from burning incense. Science of the Total Environment, 295(1–3), 51–67. https://doi.org/10.1016/S0048-9697(02)00043-8
- Jones, B., & Molina, C. (2017). Indoor air quality. In M. A. Abraham (Ed.), Encyclopedia of sustainable technologies. Elsevier.
- Jovanović, M., Vučićević, B., Turanjanin, V., Živković, M., & Spasojević, V. (2014). Investigation of indoor and outdoor air quality of the classrooms at a school in Serbia. Energy, 77, 42–48. https://doi.org/10.1016/j.energy.2014.03.080
- Kasangana, K. K., Makonese, T., & Masekameni, D. M. (2018). Knowledge and perceptions of hazards associated with traditional cooking and heating fuels. 2018 International Conference on the Domestic Use of Energy, DUE 2018 (pp. 1–7).
- Kim, K.-H., Jahan, S. A., & Kabir, E. (2011). A review of diseases associated with household air pollution due to the use of biomass fuels. Journal of Hazardous Materials, 192(2), 425–431. https://doi.org/10.1016/j.jhazmat.2011.05.087
- Krawczyk, D. A., Rodero, A., Gładyszewska-Fiedoruk, K., & Gajewski, A. (2016). CO2 concentration in naturally ventilated classrooms located in different climates—Measurements and simulations. Energy and Buildings, 129, 491–498. https://doi.org/10.1016/j.enbuild.2016.08.003
- Lawrence, A. J., Masih, A., & Taneja, A. (2005). Indoor/outdoor relationships of carbon monoxide and oxides of nitrogen in domestic homes with roadside, urban and rural locations in a central Indian region. Indoor Air, 15(2), 76–82. https://doi.org/10.1111/j.1600-0668.2004.00311.x
- Lee, Y., Lim, T. H., Kang, H., Oh, J., & Ko, B. S. (2018). Pulmonary thromboembolism after carbon monoxide poisoning. The American Journal of Emergency Medicine, 36(9), 1717.e3–1717.e7. https://doi.org/10.1016/j.ajem.2018.05.063
- Li, L., Yang, Z., dang, Z., Meng, C., Huang, J., meng, H., Wang, D., Chen, G., Zhang, J., Peng, H., & Shao, Y. (2020). Propagation analysis and prediction of the COVID-19. Infectious Disease Modelling, 5, 282–292. https://doi.org/10.1016/j.idm.2020.03.002
- Lu, H., Zhu, L., & chen, S. (2008). Pollution level, phase distribution and health risk of polycyclic aromatic hydrocarbons in indoor air at public places of Hangzhou, China. Environmental Pollution, 152(3), 569–575. https://doi.org/10.1016/j.envpol.2007.07.005
- Mainka, A., brągoszewska, E., kozielska, B., Pastuszka, J. S., & Zajusz-Zubek, E. (2015). Indoor air quality in urban nursery schools in Gliwice, Poland: Analysis of the case study. Atmospheric Pollution Research, 6(6), 1098–1104. https://doi.org/10.1016/j.apr.2015.06.007
- Mainka, A., Zajusz-Zubek, E., Kozielska, B., & Bragoszewska, E. (2018). Investigation of air pollutants in rural nursery school - A case study. E3S Web of Conferences.
- Marchand, C., Bulliot, B., Le Calvé, S., & Mirabel, P. (2006). Aldehyde measurements in indoor environments in Strasbourg (France). Atmospheric Environment, 40(7), 1336–1345. https://doi.org/10.1016/j.atmosenv.2005.10.027
- Marcy, N. E., & Ascone, D. S. (2005). Incidents, deaths and in-depth investigations associated with carbon monoxides from engine-driven generators and other engine-driven tools between 1990–2004. In U. State (Ed.). Consumer Product Safety Commission.
- Milner, J., Vardoulakis, S., Chalabi, Z., & Wilkinson, P. (2011). Modelling inhalation exposure to combustion-related air pollutants in residential buildings: Application to health impact assessment. Environment International, 37(1), 268–279. https://doi.org/10.1016/j.envint.2010.08.015
- Min, J. Y., Paek, D., Cho, S. I., & Min, K. B. (2009b). Exposure to environmental carbon monoxide may have a greater negative effect on cardiac autonomic function in people with metabolic syndrome. Science of the Total Environment, 407(17), 4807–4811. https://doi.org/10.1016/j.scitotenv.2009.05.028
- Min, J.-Y., Paek, D., Cho, S.-I., & Min, K.-B. (2009a). Exposure to environmental carbon monoxide may have a greater negative effect on cardiac autonomic function in people with metabolic syndrome. Science of the Total Environment, 407(17), 4807–4811.
- Ngoma, R., Tambatamba, A., Oyoo, B., Mulongoti, D., Kumwenda, B., & Louie, H. (2018). How households adapted their energy use during the Zambian energy crisis. Energy for Sustainable Development, 44, 125–138. https://doi.org/10.1016/j.esd.2018.03.007
- Ocak, T., Tekin, E., Basturk, M., Duran, A., Serinken, M., & Emet, M. (2016). Treatment in carbon monoxide poisoning patients with headache: A prospective, multicenter, double-blind, controlled clinical trial. American Journal of Emergency Medicine, 34(11), 2140–2145. https://doi.org/10.1016/j.ajem.2016.08.002
- Oyewo, A. S., Aghahosseini, A., Bogdanov, D., & Breyer, C. (2018). Pathways to a fully sustainable electricity supply for Nigeria in the mid-term future. Energy Conversion and Management, 178, 44–64. https://doi.org/10.1016/j.enconman.2018.10.036
- Prockop, L. D., & Chichkova, R. I. (2007). Carbon monoxide intoxication: An updated review. Journal of the Neurological Sciences, 262(1–2), 122–130. https://doi.org/10.1016/j.jns.2007.06.037
- Ramirez, H. B., Alvarez, R. F., Cuadrado, G. R., Gonzalez, C. M., Jerez, F. R., & Clara, P. C. (2014). Elevated carboxyhemoglobin: Sources of carbon monoxide exposure. Archivos de Bronconeumología (English Edition), 50(11), 465–468. https://doi.org/10.1016/j.arbr.2014.09.009
- Reboul, C., Thireau, J., Meyer, G., André, L., Obert, P., Cazorla, O., & Richard, S. (2012). Carbon monoxide exposure in the urban environment: An insidious foe for the heart? Respiratory Physiology & Neurobiology, 184(2), 204–212. https://doi.org/10.1016/j.resp.2012.06.010
- Sandilands, E. A., & Bateman, D. N. (2016). Carbon monoxide. Medicine, 44(3), 151–152. https://doi.org/10.1016/j.mpmed.2015.12.024
- Ścibor, M., Balcerzak, B., Galbarczyk, A., Targosz, N., & Jasienska, G. (2019). Are we safe inside? Indoor air quality in relation to outdoor concentration of PM10 and PM2.5 and to characteristics of homes. Sustainable Cities and Society, 48, 101537. https://doi.org/10.1016/j.scs.2019.101537
- Sircar, K., Clower, J., Shin, M. K., Bailey, C., King, M., & Yip, F. (2015). Carbon monoxide poisoning deaths in the United States, 1999 to 2012. The American Journal of Emergency Medicine, 33(9), 1140–1145. https://doi.org/10.1016/j.ajem.2015.05.002
- Taner, S., Pekey, B., & Pekey, H. (2013). Fine particulate matter in the indoor air of barbeque restaurants: Elemental compositions, sources and health risks. Science of the Total Environment, 454–455, 79–87. https://doi.org/10.1016/j.scitotenv.2013.03.018
- Tirosh, E., & Schnell, I. (2016). The relationship between ambient carbon monoxide and heart rate variability-a systematic world review-2015. Environmental Science and Pollution Research, 23(21), 21157–21164. https://doi.org/10.1007/s11356-016-7533-0
- Tong, X., Wang, Z., Cheng, Z., Zhou, C., & Mao, N. (2017). A modeling method for predicting the concentration of indoor carbon dioxide leakage and dispersion based on similarity theory. Energy and Buildings, 151, 585–591. https://doi.org/10.1016/j.enbuild.2017.07.001
- Ugwoke, B., Gershon, O., Becchio, C., Corgnati, S. P., & Leone, P. (2020). A review of Nigerian energy access studies: The story told so far. Renewable and Sustainable Energy Reviews, 120, 109646. https://doi.org/10.1016/j.rser.2019.109646
- Vallamsundar, S., Lin, J., Konduri, K., Zhou, X., & Pendyala, R. M. (2016). A comprehensive modeling framework for transportation-induced population exposure assessment. Transportation Research Part D: Transport and Environment, 46, 94–113. https://doi.org/10.1016/j.trd.2016.03.009
- Vanker, A., Barnett, W., Nduru, P. M., Gie, R. P., Sly, P. D., & Zar, H. J. (2015). Home environment and indoor air pollution exposure in an African birth cohort study. Science of the Total Environment, 536, 362–367. https://doi.org/10.1016/j.scitotenv.2015.06.136
- Veiraiah, A. (2020). Carbon monoxide poisoning. Medicine, 48(3), 197–198. https://doi.org/10.1016/j.mpmed.2019.12.013
- Veronesi, A., Pecoraro, V., Zauli, S., Ottone, M., Leonardi, G., Lauriola, P., & Trenti, T. (2017). Use of carboxyhemoglobin as a biomarker of environmental CO exposure: Critical evaluation of the literature. Environmental Science and Pollution Research, 24(33), 25798–25809. https://doi.org/10.1007/s11356-017-0270-1
- Wang, L., & Emmerich, S. J. (2010). Modeling the effects of outdoor gasoline powered generator use on indoor carbon monoxide exposures. Building Simulation, 3(1), 39–50. https://doi.org/10.1007/s12273-010-0308-5
- Wang, L., Emmerich, S. J., & Lin, -C.-C. (2013). Study of the impact of operation distance of outdoor portable generators under different weather conditions. Indoor and Built Environment, 23(8), 1092–1105. https://doi.org/10.1177/1420326X13482318
- Wang, L., Xiang, Z., Stevanovic, S., Ristovski, Z., Salimi, F., Gao, J., Wang, H., & Li, L. (2017). Role of Chinese cooking emissions on ambient air quality and human health. Science of the Total Environment, 589, 173–181. https://doi.org/10.1016/j.scitotenv.2017.02.124
- Wangchuk, T., Mazaheri, M., Clifford, S., Dudzinska, M. R., He, C., Buonanno, G., & Morawska, L. (2015). Children’s personal exposure to air pollution in rural villages in Bhutan. Environmental Research, 140, 691–698. https://doi.org/10.1016/j.envres.2015.06.006
- Weaver, L. K., Hopkins, R. O., Chan, K. J., Churchill, S., Elliott, C. G., Clemmer, T. P., Orme, J. F., Jr, Thomas, F. O., & Morris, A. H. (2002). Hyperbaric oxygen for acute carbon monoxide poisoning. New England Journal of Medicine, 347(14), 1057–1067. https://doi.org/10.1056/NEJMoa013121
- Wei, C. F., Chen, M. H., Lin, C. C., Guo, Y. L., Lin, S. J., Hsieh, W. S., & Chen, P. C. (2018). Household incense burning and infant gross motor development: Results from the Taiwan Birth Cohort Study. Environment International, 115, 110–116. https://doi.org/10.1016/j.envint.2018.03.005
- Weichenthal, S., Dufresne, A., Infante-Rivard, C., & Joseph, L. (2008). Characterizing and predicting ultrafine particle counts in Canadian classrooms during the winter months: Model development and evaluation. Environmental Research, 106(3), 349–360. https://doi.org/10.1016/j.envres.2007.08.013
- Wichmann, J., Lind, T., Nilsson, M. A. M., & Bellander, T. (2010). PM2.5, soot and NO2 indoor–outdoor relationships at homes, pre-schools and schools in Stockholm, Sweden. Atmospheric Environment, 44(36), 4536–4544. https://doi.org/10.1016/j.atmosenv.2010.08.023
- Wolkoff, P. (2018). The mystery of dry indoor air – An overview. Environment International, 121, 1058–1065. https://doi.org/10.1016/j.envint.2018.10.053
- Yi, F., Ye, H., Wu, X., Zhang, Y. Y., & Jiang, F. (2020). Self-aggravation effect of air pollution: Evidence from residential electricity consumption in China. Energy Economics, 86, 104684. https://doi.org/10.1016/j.eneco.2020.104684
- Yocom, J. E. (1982). A Critical Review. Journal of the Air Pollution Control Association, 32(5), 500–520. https://doi.org/10.1080/00022470.1982.10465427
- Zuraimi, M. S., & Tham, K. W. (2008). Indoor air quality and its determinants in tropical child care centers. Atmospheric Environment, 42(9), 2225–2239. https://doi.org/10.1016/j.atmosenv.2007.11.041