
 ?Mathematical formulae have been encoded as MathML and are displayed in this HTML version using MathJax in order to improve their display. Uncheck the box to turn MathJax off. This feature requires Javascript. Click on a formula to zoom.
Abstract
Data from literature and a stoichiometric material balance model were employed to estimate associated emissions with flaring of sweet gas in Nigerian oil and gas companies. Emission factors were obtained using AP 42 formula. Results showed that thousands of tonnes, ranging from 6500 to 22,000 tonnes of natural gas were flared from 1997 to 2016. At flaring stack efficiencies of 97% and 98%, the associated emissions are: CH4, C2H6, C3H8, iC4H10, nC4H10, iC5H12, nC5H12, C6H14, C7H16, C8H18, C9H20, CO2, and N2 from unburnt natural gas and in addition to CO2, CO, N2, NO, NO2, H2O and H2 from incomplete combustion. At both flaring stack efficiencies, the amount of emissions from unburnt condition ranged from1,608 tonnes N2 to 9,146 tonnes CO2 all higher than any emission standards in the world, while the amounts of emissions from incomplete combustion ranged from 467,964 tonnes for CO2 the lowest to 2,476,011 tonnes for N2 the highest all higher than any emission standards in the globe. Emission factors of emissions from unburnt natural gas ranged from 0.000090 tonne/tonne for C10H22 to 0.026235 tonne/tonne for CH4 while those of the emissions from incomplete combustion ranged from 0.10285 tonne/tonne for H2 to 1.13137 for CO2 tonne/tonne. It was observed that thousands of tonnes of emissions are released into the atmosphere during flaring of sweet natural gas either at complete or incomplete combustion. It is recommended that flaring of natural gas should be reduced to a minimal level to safeguard the environment.
PUBLIC INTEREST STATEMENT
Quantifying flare emissions have been very challenging. Lack of monitoring equipment and limited oversight leads to the high uncertainty in the measurement of flare emissions and combustion efficiencies because they are not measured directly from actual industrial flares. Also, there are no determined emission factors for the present working or operating conditions which has brought about trouble, in checking of the emissions from the flared gas to guarantee compliance with the Federal Environmental Protection Agency (FEPA) and Department of Petroleum Resources (DPR) norms. This work has determined using a material balance approach and predicted emission factors which are oftentimes the best or just technique accessible for quantifying emissions associated with flaring of sweet natural gas in Nigeria, regardless of their impediments would be.
1. Introduction
Gas flaring is one of the most challenging energy and environmental matters in front of the world today whether regionally or globally (World Bank, Citation2004). Nigeria is one of the highly endowed nations with natural resources such as natural gases, petroleum and mineral deposits. In some instances, these have been blessings, and in others they are nothing but constant sources of woes to the nations that are located where these resources may be found. Of these natural sources, some are a windfall for these countries, while others have to be struggling to deal with the attendant menace such as diseases and environmental pollution that come with the resources (Human Development Report, Citation2011).
In Nigeria, there is no standing legal framework that prohibits gas flaring in spite of the environmental consequences associated with it. The existing laws that appear to regulate gas flaring in Nigeria are not effective as they do not completely prohibit gas flaring but only provide monetary penalties for continued flaring of gas by oil and gas companies in Nigeria (Udok & Akpan, Citation2017). The Judiciary, therefore, appeared to have championed the cause for the abolition of gas flaring in Nigeria. In 2017, Udok and Akpan examined the legal framework for gas flaring in Nigeria and further identifies the problems and prospects associated with the flaring of gas in Nigeria and made useful recommendations which are being implemented.
In both onshore and offshore oil and gas explorations, procedures of flaring of natural gas are conducted (Farina, Citation2010; GGFR, Citation2002) with the intent of facilitating the reduction of pressure in the well and viewed by some as a safety precaution, but in most instances is conducted as a means of disposing excess natural gas where there is inadequate infrastructural facilities for utilization of this gas. Flaring of natural gas in Nigeria adds approximately 1% to the worldwide CO which poses extensive issues for the environment (World Bank, Citation2010), and is viewed as a pathway to issues associated with absence of consumer goods, cultural and ethnic perceptions towards flaring as vast opportunity for economic benefit (World Bank, Citation2010).
Several researchers have worked on impact of flaring of natural gas in Nigeria and in the world at large. Omoniyi and Ubale (Citation2015) investigated the various ways in which gas flaring affects the populace of the Niger Delta region of Nigeria, which is the bedrock of Nigeria’s current oil and gas resources. O.S. Ismail and Umukoro (Citation2012) presented material balance equation and predicted results for non-hydrocarbon emissions such as CO2, CO, NO, NO2 and SO2 from flaring of 12 natural gas samples representing composition of natural of global origin. Gaseous emission estimates and patterns were modelled by coding material balance equation for six reaction types and combustion conditions with a computer program. In Citation1999, Li and William gave several reactions taking place in combustion of natural gas. Research has shown that during combustion reaction, several intermediate products are formed, and eventually, most of them are converted to CO2 and water. Some stable intermediate products and other by-products such as hydrocarbon, CO, H2, NO, NO2, SO2 etc would escape as emissions (Kahforoshan et al., Citation2008). The impact of infrared radiation emanated from flaring of natural gas is also of great concern as there are limits to which ecosystem can endure the heat fluxes emitted (O. S. Ismail & And Fagbenle, Citation2009).
It is indicated in Oo et al. (Citation2019) that increasing atmospheric carbon dioxide and other greenhouse gases through anthropogenic activities, and human activities like land-use changes, production of industrial effluents and other activities due to the development of society cause to change in global as well as regional climate. Mulenga and Siziya (Citation2019) opined that climate change may worsen existing indoor air problems and create new problems by altering outdoor conditions that affect indoor conditions. Since climate change is due to both natural variability and human-induced contributions, public health professionals through their expertise in health promotion and behaviour change can play a vital role in promoting lifestyle choices that will decrease greenhouse gas emissions. The fact that greenhouse gases are imposed on the atmosphere by anthropogenic activities, green building rating tools (GBRTs) have become the essential need to cope up with the sustainable development goals, climate change, and natural resource degradation through buildings (Khan et al., Citation2019). Elehinafe et al. (Citation2017) investigated the calorific values of sawdust of different wood species found in southwestern Nigeria with a view to considering their suitability as energy sources to reduce dependence on fossils that lead to emissions of greenhouse gases.
Quantifying flare emissions have been very challenging. Lack of monitoring equipment and limited oversight leads to the high uncertainty in the measurement of flare emissions and combustion efficiencies because they are not measured directly from actual industrial flares (Ismail and Umukoro, Citation2015). Also, there are no determined emission factors for the present working or operating conditions which has brought about trouble, in checking of the emissions from the flared gas to guarantee compliance with the Federal Environmental Protection Agency (FEPA) and Department of Petroleum Resources (DPR) norms. Emission factors are oftentimes the best or just technique accessible for evaluating discharges, regardless of their impediments would (Gibson, Citation2013). A material balance approach additionally may give dependable normal emission assessments to particular sources. For a few sources, a material balance may give a superior estimate of discharges than emission tests would (Gibson, Citation2013).
Emission factors for taking inventories have for some time been essential instrument for air quality administration. Emission estimates are vital for creating emission control methodologies, deciding appropriateness of allowing and control programs, determining the impacts of sources and fitting relief procedures, and various other related applications by a variety of clients, including government, state, and neighbourhood organizations, specialists and industry. However, there is little or no information in the literature, as regards emission factors from modelling of flare natural in Nigerian oil and gas exploration and production, hence this study. In this research, an attempt was made to identify and quantify gaseous emissions with their emission factors from the flaring of associated sweet natural gas using data from literature, stoichiometric material balance concept, reaction type and flaring stack efficiencies.
2. Materials and methods
The flowchart (Figure ) summarized the research methodology. It entailed sourcing for information on annual quantities of sweet natural gas flared in Nigeria for a period of twenty years; the percentage compositions of Nigerian natural gas; the flaring conditions of the natural gas; and the necessary models to achieve the set objectives from oil and gas companies and their regulatory agencies, journals,; textbooks and other internet research materials.
Figure 1. Flow chart showing the research methodology.
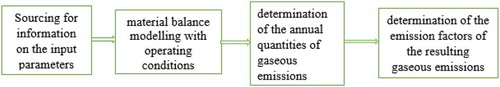
Oil and gas companies in Nigeria, who are into exploration and production activities, were approached for their respective data on the annual natural gas quantities produced, utilized and flared ( and ). The data on percentage compositions of Nigerian natural gas were also collected (Table ). The data obtained were validated by the national regulatory agency oil and gas companies in Nigeria: the Department of Petroleum Resources (DPR) and journals. From the
Table 1a. Flaring information collected from the department of petroleum resources
materials collected, ample information on gas quantities for twenty years (1997–2016) were available for the study. The data on the annual natural gas quantities produced, utilized and flared were further analysed, collated and the volumes converted to kilograms and then tonnes.
2.1. Determination of the annual quantities of gaseous emissions from the flared gas
3. Using material balance model and operating conditions of flare stacks
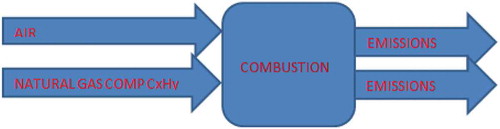
To determine the gaseous emissions, the flame on top of a flaring stack (Plate ), during flaring was modelled as shown in (Figure ) according to (Ismail and Umukoro, Citation2015; Sonibare & Akeredolu, Citation2004). The equation used to investigate the reaction at the combustion zone of the model represents the reaction type of incomplete combustion of sweet natural gas with oxides of nitrogen (NOx) formation as both nitric (NO) and nitrogen dioxide (NO2) at temperature equal or greater than 1600 K. The reaction is considered to be incomplete because flaring is always turbulent and at high temperature equal or greater than 1600 K (Sonibare & Akeredolu, Citation2004).
The standard global efficiencies of flaring stack (Ismail and Umukoro, Citation2015) of 97% and 98% were used in the analysis. At 97% efficiency, 3% of the natural gas escapes burning and goes to the atmosphere to constitute emissions from the original component of the natural gas. Then the 97% of the natural gas undergoes incomplete burning to produce emissions that are products of the reaction. The same analysis went with the efficiency at 98%.
3.1. Assumptions and uncertainties
The following assumptions were made to arrive at this material balance reaction type. They include:
1. Absence of fugitive emissions which are difficult to be accounted for
2. Flaring stacks well erected to avoid collapse
3. Combustion chamber temperature is equal or greater than 1600 K (Ismail and Umukoro, Citation2015; Sonibare & Akeredolu, Citation2004)
4. Operating air to fuel ratio is less than stoichiometric air to fuel ratio-turbulent reaction.
(Ismail and Umukoro, Citation2015; Sonibare & Akeredolu, Citation2004)
5. Nitrogen present in air is converted to both nitrogen dioxide (NO2) and nitric oxide (NO) with some released as free nitrogen gas (N2) (Ismail and Umukoro, Citation2015; Sonibare & Akeredolu, Citation2004).
Plate 1. Sample picture of a gas flaring activity (World Bank’s Global Gas Flaring Reduction Partnership: Estimated Flared Volumes from Satelite Data, Citation2007, 2011).
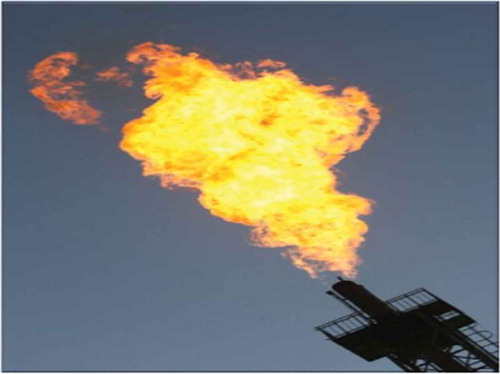
Figure 2. Block representation of the material balance model.
4. Equation of the reaction in the model
(Sonibare & Akeredolu, Citation2004)
4.1. Determination of the emission factors of the gaseous emissions from the flared natural
5. Gas stack at 97% and 98%
The emission factors of the emissions associated with flaring of natural gas were determined using the AP 42 formula (Okedere et al., Citation2017):
E = A* EF
E = Determined emission
A = Activity (Amount of Gas Flared)
EF = Emission factor
6. Results and discussions
The result of sourcing, evaluation, modelling, simulation and analysis required in this research, using the data collected from DPR, NNPC and literature, are hereby presented. The results of evaluated annual quantities of natural gas, in tonnes produced, utilized and flared in Nigeria for twenty years (1997–2016) are summarized in Figure and the yearly variation of quantities is shown in Table with the percentages of quantities of natural gas flared over the twenty years.
Figure 3. Comparison of annual gas reserves produced, utilized and flared in twenty years.
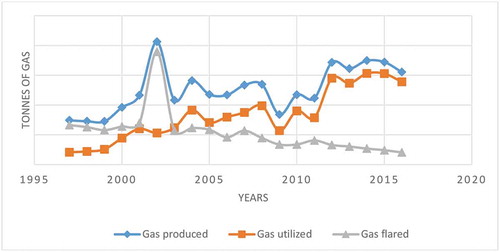
Table 1b. Flaring information collected from the literature
The determined amounts of gas produced, utilized and flared as shown in Figure depict an incresing trend of gas produced, utilized and flared from the years of 1997 to 2002. In 2002, Gas produced and flared figures reached a certain peak with amounts 82,499, and 61,300 tonnes respectively. It was also observed that gas flared and produced have the closest relationship that year. Also gas produced is almost equivalent to the gas flared for the years 1997–1999 which is thousands of tonnes of emissions released into the atmosphere. Ultimately Nigeria has not produced and flared as much gas as it did in the year 2002. It is also noticed that gas flare amount has reduced progressively from the year 2003–2016. This is because of oil and gas exploitation and production in Nigeria has frequently been disrupted in recent years by civil unrest and sabotage in the Niger Delta region making it irregular and unpredictable. Another reason is based on the worldwide falling oil price trend observed since 2009 ($110 to below 48 USD a barrel) due to insipid economic growth. There is a monumental spike in the gas utilization amounts observed in Figure and this contributes to the reduction of flaring. Also gas produced is almost equivalent to the gas flared for the years 1997–1999 which is thousands of tonnes of emissions released into the atmosphere.
There are several or many factors that could affect the efficiency results in addition to changes in gas utilization practices. For instance, if more gas is vented (without flaring) there would likely be an increase in flaring efficiency. Gas flaring efficiency is dependent on the volume of gas flared per barrel of crude oil produced. As seen from Table , the lowest flare efficiency and highest percentage flared occur in the year 2002. Surprisingly, increased production does not seem particularly correlate with increased flaring. The increase in flaring activity could also be as a result of several contributions such as the −6.12% drop in oil production (United States Energy Information Administration, Citation2015) and the relatively low oil price of 25 USD at the time. It could also be as a result of the global socio-economic crisis of the stock-market crash and financial speculation which resulted in a sudden drop in oil demand. The year 2016 accounts for the lowest flare activity and highest flaring efficiency which shows that although Nigeria’s flare efficiency has increased. Saudi Arabia appropriately outperforms by progressively having the lowest flare activity in the world indicating that is very efficient in the utilization of associated gas which is a report Nigeria can emulate (United States Energy Information Administration, Citation2015). The results of years of flaring unfortunately cannot be neutrslized and because of this many regions within the nation have been negatively impacted given rise to several causes as earlier discussed in literature.
6.1. Annual quantities of the individual gaseous components of natural gas flared in Nigeria from 1997 to 2016
The individual gas emissions were calculated using excel software for the twenty years by multiplying the individual volumes by their individual compositions of flared gas and then converted again to tonnes as indicated in Table . Also composition of Nigerian Natural gas was characterized from Nigerian natural gas by volume with Gas Pressure and Temperature 3.831 bars and 35.41℃ respectively at the flow meter inlets (Nwanya, Citation2011). The compositions were used to determine the exact amount of the fifteen gaseuos emissions (CO2, CH4, C2H6, C3H8, iC4H10, nC4H10, iC5H12, nC5H12, C6H14, C7H16, C8H18, C9H20, C10H22, N2, H2S) from the unburnt part of flared natural gas.
Table 2. Flared gas composition and specific energies at 298.15
Analysis proved the gas flared contains only trace amounts of H2S and thus is assumed to be negligible and shown to be zero in Table adding to the evidence that the natural gas found in the region is “sweet.” Results also showed that a lot of methane is contained in the flared gas which justifies the initial hypothesis of this study that several tonnes of CH4 is contained in the gas and is very volatile according to Ochuko (Citation2011). Methane becomes poisonous when mixed with other substances and with insufficient oxygen to produce carbon monoxide which causes death in twenty minutes for low concentrations let alone the predicted and actual concentrations and amounts obtained from flaring over the years (Ochuko, Citation2011). This contributes to many significant and adverse impacts on the environment and health of people in Nigeria which is the case of this study. Gas flaring in Nigeria also signals an economical waste of resources for the nation especially because there is a progressive increase in natural gas utility values such as feedstock and power generation needs, demographic population that desires better access to efficient energy services and necessity for a cleaner environment (Ovuakporaye, Citation2012).
The frightening amounts of the respective gases shown proves the need for the complete abolition of flaring. These are just the pre-calculated amounts that would proceed to flaring. From taking a closer look at just the hydrocarbons involved, one can imagine and estimate the great consequences of burning at high temperatures, certain operating conditions and stack efficiencies in the presence of limited oxygen. The pollutants that have been emitted yearly would be concentrations that would signal a cause for alarm. Stochiometric material balance models would have to be used to determine the actual quantites discharged.
6.2. Annual quantities of emissions from the flared natural gas in Nigeria
The results of the annual quantities of gaseous emissions from flared natural gas in Nigeria from 1997 to 2016 at operating conditions of flaring stacks are represented in two folds by putting into consideration, the efficiencies of the flaring stacks at 97% and 98%, global standards.
Figure 4. Time plot of the amounts of unburnt hydrocarbons at 97% flare stack efficiency.
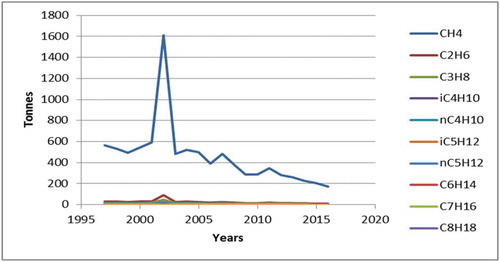
Figure 5. Time plot of the amounts of unburnt non-hydrocarbons at 97% flare stack efficiency.
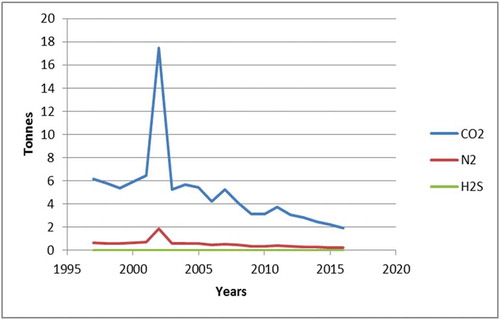
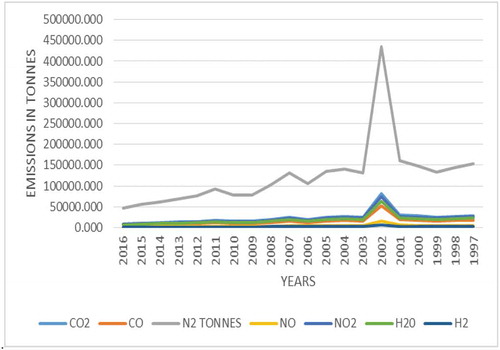
Figure 6. Time plot of the amounts of emissions at 97% flare stack efficiency.
The Figure illustrates the amounts of various hydrocarbons (CH4, C2H6, C3H8, iC4H10, nC4H10, iC5H12, nC5H12, C6H14, C7H16, C8H18, C9H20, and C10H22) and their trend in the twenty years. This shows that there is a global maximum in the year 2002 with the largest discharge of gases and the most being unburnt methane as predicted in Table . At 97% flaring stack efficiency, methane reached an all-time high of 1608 tonnes in 2002 and 9,146 tonnes in the twenty years and the lowest being nonane with about 3 tonnes discharged in the twenty year period which is exceedingly high and dangerous because of its greenhouse tendencies and higher potency for trapping energy compared to carbon dioxide (84 times after twenty years). The 97% flare efficiency proves that 3% of the sweet gas is unburnt which has been proven in the literature. It is in fact not a conjecture but a proven theory that serious issues arise when leaked gas is discharged into the atmosphere. Although these leaks are present, they are usually unaccounted for but this study proves that they can be from the monitoring of the flare stack efficiencies. This trend is also consistent for flare stack efficiency at 98% (2% unburnt). There has not been any literature giving individual hyrocarbon emissions during flaring of sweet natural gas. This research is leading in this regard and subject to review in further research in future.
The unburnt non-hydrocarbons exhibit the same characteristics of the hydrocarbons (Figure ). The unburnt non-hydrocarbon emissions determined are Carbon dioxide (CO2), Nitrogen (N2) and Hydrogen Sulfide (H2S). Carbon dioxide has the largest magnitude of gaseous emissions from unburnt portion of the gas, followed at a distance with Nitrogen and Hydrogen Sulfide which is just seen in little or trace amounts while N2 was originally part of the air before conbustion. The flat trend (no gradient) seen for H2S proves that Nigerian natural gas has little or no sulfur and thus that particular pollutant would not be accounted for. The highest determined amounts for the non-hydrocarbon emissions not associated with burning (at 97% efficiency) emitted to the atmosphere, both occurred in 2002. The downward trend exhibited (Figure ) was as a result of reduction in oil and gas activities observed in some regions due to clash of interests and investment on remote monitoring systems to ensure compliance. Also gas has been increasingly developed in terms of development (gas facilities) and revenue generation (gas domestication and export). At 97% flaring stack efficiency, the amount of Carbon dioxide leaked to the atmosphere was about 99 tonnes.
The Figure depicts the amounts of specific gaseous emissions (CO, CO2, NO, NO2, N2, H2O and H2) given off because of incomplete combustion of hydrocarbon components of the sweet Nigerian natural gas at 97% flaring stack efficienciy and combustion chamber temperature equal or greater than 1600 K for the given period of the twenty years. The trend in graph (Figure ) exhibits a gradual decline in the amounts of all expelled gases except the clear upward spike (increase) in the year 2002. The reason behind this continued occurrence is the fact that it was recorded as the year of peak production for Nigeria in the 21st century. Figure also shows that the pollutant with the highest magnitude of emissions is nitrogen gas (N2) with 2,476,011 tonnes followed, at a distance, by carbon dioxide (CO2) with 467,964 tonnes in the given period which was 7.616% of CO2 emitted from 2000 to 2011 due to all reaction types for combustion of sweet natural gas (Christopher et al., Citation2009; GE, Citation2010; World Bank, 2012). It shows excessive or massive amounts of these gases emitted to the atmosphere each year especially nitrogen gas which results in impaired visibility, breathing difficulties and bio-degradation (Ugochukwu, Citation2008). Excess Nitrogen is a widespread costly and very challenging environmental issue because of it is after effects (air and water pollution) and excess carbon dioxide causes an increase in the earth’s temperature and contribute to the world temperature rise of 6℃ leading to many unpalatable effects (Ugochukwu, Citation2008).
6.3. Emission factors (tonne/tonne) of burnt plus unburnt gaseous emissions of sweetnatural gas flared in Nigeria from 1997 to 2016
Emission factors (Tonne/Tonne) of burnt plus unburnt gaseous emissions of sweetnatural gas flared in Nigeria from 1997 to 2016 are summarized in Tables and below. The tables indicate that emission factors at 97% are higher than those at 98% thus justifying earlier that lesser amounts of burnt hydrocarbons are discharged at 98%. In addition some specific pollutants such as CO2 (the range of 1.10–1.13 tonnes/tonnes) and N2 (6.72–6.86 tonnes/tonnes) have estimated emission factors greater than one (1) for both 97% and 98% flaring stack efficiencies which can result in detrimental effects as earlier stated especially if not curbed to the atmosphere
Table 3. Percentage gas flared in twenty years (1997–2016)
Table 4. Annual quantities of compositions of sweet gas flared in tonnes
Table 4. Annual quantities of all compositions of sweet gas flared in tonnes (Contd)
Table 5. Emission factors (tonne/tonne) of the emissions from unburnt part of sweet natural gas at 97% & 98% flaring stack efficiencies
Table 6. Emission factors (tonne/tonne) of the emissions from incomplete combustion at 97% and 98% efficiency of combustion in flaring stack
and environment at large. Hence special concern and measures must be put in place in the monitoring and lessening of these particular emissions.
The analyses also indicate that there is a direct link or relationship between flaring stack efficiencies and emission facotrs. Hence the higher the flare efficiency for instance, 98%, the lower the emission factors obtained. The factors obtained are recommended as tools for controlling oil and gas companies in Nigeria because they (the factors) are used to obtain the estimated annual quantities of the individual emissions that might be emitted at prescribed operating conditions (97% and 98% flaring stack efficiencies) without having to go through the rigorous quantifications of all sources administered in the methodology. No literature has ever provided emission factors of air emissions from combustion of sweet natural gas. Therefore, the fuel analysis method can be used to calculate the carbon content and individual amounts which would assist organizations (Department of Petroleum Resources and Oil companies) in the measuring and reporting of greenhouse gases in organizational inventory using appropriate emission factors.
7. Conclusion
This study used the material balance model to obtain emissions, and their emission factors, associated with the flaring of sweet natural gas by observing the efficiencies of flaring stack. It revealed the gas quantities flared from 197 to 2016 ranged from 289 to 2674 bcf and emissions (CH4, C2H6, C3H8, iC4H10, nC4H10, iC5H12, nC5H12, C6H14, C7H16, C8H18, C9H20, C10H22, CO2, and N2 from unburnt natural gas and in addition to: CO2, CO, N2, NO, NO2, H2O and H2 from incomplete combustion) associated with sweet natural gas flaring. The methodology adopted in this article could be used to identified and quantify emissions associated with flaring of sweet natural gas. It is recommended that flaring of natural gas should be drastically reduced or stopped to safeguard the environment and to increase income generation. Further research needs to be done that would put metrological conditions and other factors like temperature and pressure at which sweet natural gas is supplied to flaring stacks, into consideration in any model adopted. In future similar work, sweet and sour natural gas types should be dealt with separately.
Acknowledgment
The management of Covenant University, Ota, Ogun State, Nigeria is highly acknowledged for being responsible for the publication fee of this research article.
Additional information
Funding
Notes on contributors

Francis B. Elehinafe
Francis B. Elehinafe holds a PhD degree in Chemical Engineering in Obafemi Awolowo University, Ile-Ife, Osun State, Nigeria. He is currently a lecturer and researcher in Covenant University, Ota, Ogun State, Nigeria. His research areas include environmental pollution (monitoring, analysis, modelling and control), waste management and renewable energy.
Sophie D. Anjorin
Sophie D. Anjorin's research interest includes air pollution modelling and analysis
Olayemi. A. Odunlami
Olayemi. A. Odunlami's research area includes environmental pollution monitoring and analysis.
Angela O. Mamudu
Angela O. Mamudu is a researcher with interest in process optimization, plant design, petroleum refining and petrochemicals.
Augustine O. Ayeni
Augustine O. Ayeni research area includes solid and liquid waste treatment and beneficiation to fuels and chemicals, environmental pollution, sustainable and renewable energy, statistical modelling and optimization, bioprocess engineering.
Oyetunji B. Okedere
Oyetunji B. Okedere's research interest includes air pollution (monitoring, analysis, modelling and control), and renewable energy.
References
- Adewale, O. O., & Mustapha, U. (2015). The Impact of Gas Flaring in Nigeria. International Journal of Science, Technology and Society, 3(2), 40–15. https://doi.org/10.11648/j.ijsts.20150302.12
- Central Bank of Nigeria. (2007). Gas production data. https://doi.org/10.1057/9781137493538.0016
- Christopher, D. E., Daniel, Z., Kimberly, E. B., Benjamin, T. T., Tilottama, G., Dee, W. P., Edward, H. E., & Mikhail, Z. A. (2009). Fifteen year record of global natural gas flaring derived from satelite data. Energies, 2, 595–622. http://dx.dio.10.3390/en20300595
- Department of Petroleum Resources. (2017). Data on annual quantity of natural gas flared by Nigerian oil and gas. DPR. https://doi.org/10.2307/j.ctvgc60hz
- Elehinafe, F. B., Okedere, O. B., Fakinle, B. S., & Sonibare, J. A. (2017). Assessment of sawdust of different wood species in Southwestern Nigeria as source of energy. Energy Sources, Part A: Recovery, Utilization, and Environmental Effects, 39(18), 1901–1905. https://doi.org/10.1080/15567036.2017.1384869
- Farina, M. F. (2010). Flare Gas Reduction: Recent Global Trends and Policy Considerations. General Energy Company.
- GE (2010). Flare gas reduction: Recent global trends and policy considerations, GE energy global strategy and planning, genaral electric company (GE Energy/GEAI8592 (10/2010)).
- GGFR (2002) Report on consultations with stakeholders. World Bank group in collaboration with the government of Norway [online]. Retrieved December 1, 2019, from. http://www.worldbank.org/ogmc/files/global_gas_flaring_initiative.pdf
- Gibson, J. (2013). Summary report of a review of flared vent gas emissions, monitoring and reporting methods. National measurement system.
- Human Development Report. (2011) [online]. Retrieved December 29, 2019, from. http://hdr.undp.org/en/
- Ismail and Umukoro. (2015). Modelling emissions from natural gas flaring. Journal of King Saud University, 178–182. https://doi.org/10.1016/j.jksues.2015.08.001
- Ismail, O. S., & And Fagbenle, R. O. (2009). Accurate safety zone determination during gas flaring. Journal of Engineering and Applied Science, 4(5–6), 295–302. file:///C:/Users/user/Desktop/(3)ui_art_ismail_accurate_2009(4).pdf
- Ismail, O. S., & Umukoro, G. E. (2012). Global impact of gas flaring. Energy and Power Engineering, 4(4), 290–302. https://doi.org/10.4236/epe.2012.44039
- Kahforoshan, D., Fatehifar, E., Babalou, A. A., Ebrahimin, A. R., Elkamel, A., & Ltanmohammadzade, S. J. S. (2008). Modelling and evaluation of air pollution from a gaseous flare in oil and gas processing area. In WSEAS Conference in Santander Cantabria, 23–25. https://www.researchgate.net/publication/228593971
- Khan, S. J., Zakaria, R., Aminudin, E., Abidin, A. I. N., Mahyuddin, A. M., & Ahmad, R. (2019). Embedded life cycle costing elements in green building rating tool. Civil Engineering Journal, 5(4), 750–758. https://doi.org/http://dx.doi.10.28991/cej-2019-03091284
- Li, S. C., & William, F. A. (1999). Nox formation in two stage methane air flames. Combustion Flame, 118(3), 399–411. https://doi.org/10.1016/s0010-2180(99)00002-4
- Mulenga, D., & Siziya, S. (2019). Indoor air pollution related respiratory ill health, a sequel of biomass use. SciMedicine Journal, 1(1), 30–37. https://doi.org/http://dx.doi.10.28991/SciMedJ-2019-0101-5
- Nwanya, S. C. (2011). Climate change and energy implications of gas flaring for Nigeria. International Journal of Low-Carbon Technologies, 6(3), 193–199. https://doi.org/10.1093/ijlct/ctr007
- Ochuko, T. (2011). Gas flaring/power plants in Nigeria: Socio-economic and environmental impact on the people of Niger Delta. Master’s Thesis in Environmental Management
- Okedere, O., Sonibare, J., Ajala, O., Adesina, O., & Elehinafe, F. (2017). Estimation of sulphur dioxide emission from consumption of premium motor spirit and automotive gas oil in Nigeria. Cogent Environmental Science, 3(1), 1330456. https://doi.org/10.1080/23311843.2017.1330456
- Oo, T. H., Zin, W. W., & Kyi, T. C. C. (2019). Assessment of future climate change projections using multiple global climate models. Civil Engineering Journal, 5(10), 2152–2166. https://doi.org/http://dx.doi.10.28991/cej-2019-03091401
- Ovuakporaye, S. I. (2012). Effects of gas flaring on lung function among residents of gas flaring community in Delta State, Nigeria. Research Journal of Environment of Earth Science, 4(5), 525–528. https://doi.org/10.33278/sae
- Sonibare, J., & Akeredolu, F. (2004). A theoretical prediction of non-methane gaseous emissions from natural gas combustion. Elsevier Energy Policy, 32(14), 1653–1665. https://doi.org/10.1016/j.enpol.2004.02.008
- Udok, U., & Akpan, E. B. (2017). Gas flaring in Nigeria: Problems and prospects. Global Journal of Politics and Law Research, 5(1), 16–28.
- Ugochukwu, C. N. (2008). Sustainable environmental management in the Niger Delta Region of Nigeria: BTU Cottbus - Germany: Faculty of Environmental Sciences and Process. file:///C:/Users/user/Downloads/Collins_Ugochukwu_PhD_Dissertation.pdf
- United States Energy Information Administration. (2015). Nigeria crude oil production by year. http://www.eia.doe.gov/
- World Bank. (2004). Strategic gas plan for Nigeria (Joint UNDP/World bank energy sector management assistance program (ESMAP)). 12.
- World Bank. (2010) [online]. Retrieved November 25, 2019, from. http://web.worldbank.org/WBSITE/EXTERNAL/TOPICS/EXTSDNET/0,contentMDK:22679372~menuPK:64885113~pagePK:7278667~piPK:64911824~theSite PK: 5929282,00.html
- World Bank’s Global Gas Flaring Reduction Partnership: Estimated Flared Volumes from Satelite Data, 2007. 2011. http://go.world-bank.org/D03ETIBVD0