
 ?Mathematical formulae have been encoded as MathML and are displayed in this HTML version using MathJax in order to improve their display. Uncheck the box to turn MathJax off. This feature requires Javascript. Click on a formula to zoom.
Abstract
In recent years, there has been concern regarding the frequent occurrence of nighttime collisions. This research aims to clarify how differences in tail lamp design affect their visibility to other drivers, with a view to develop a design that will make tail lamps more conspicuous. By focusing on visibility in human face recognition abilities, we conducted a subjective evaluation experiment and visual search task using rear-shots of vehicles. The experimental results revealed that a human’s impression of a rear-shot of a vehicle is structurally similar to their impression of a face, and that the tail lamp design affects reaction time. Moreover, electroencephalogram (EEG) measurements verified the validity of the results from a neuroscience perspective. These findings may be used for developing tail lamp designs that are more striking so as to be more noticeable to fellow drivers.
CLASSIFICATIONS:
PUBLIC INTEREST STATEMENT
This research aims to clarify how differences in tail lamp design affect their visibility to other drivers, with a view to develop a design that will make tail lamps more conspicuous. By focusing on visibility in human face recognition abilities, we conducted a subjective evaluation experiment and visual search task using rear-shots of vehicles. The experimental results revealed that a human’s impression of a rear-shot of a vehicle is structurally similar to their impression of a face, and that the tail lamp design affects reaction time. The results lead to an efficient design of tail lamps that encourage rapid visibility of the target and avoidance behavior. The difference in reaction time between “angry-looking” and “friendly-looking” vehicle rear design is about 200 ms, which, when converted to distance, translates into a difference of 3.3 m at a speed of 60 km/h. This difference is considered to be very significant in terms of accident avoidance.
1. Introduction
There is a growing demand for preventive safety technology designed to avoid or mitigate vehicle collisions, such as automatic emergency braking (AEB) systems. In the EU, AEB became mandatory for all newly launched commercial vehicles in (Regulation of The European Parliament and of the Council, Citation2009). It is expected that AEB, in addition to various other types of preventive safety technology, such as lane departure warning systems, adaptive cruise control, electronic stability control, and rear-end collision prevention support systems, will become mandatory international standards within the next few years.
Against this backdrop, we propose a new vehicle tail lamp design that gives the lamps a more noticeable appearance. To this end, we focused on how humans specifically react to the face of another human. Research has shown that an angry expression is detected quicker than a happy expression. It would, therefore, be possible to create a highly visible rear design by incorporating the impression of a human’s angry expression into the design, particularly for tail lamps where increasing use of LEDs is creating greater design freedom. On the other hand, Alonso et al. (Citation2019) reported that drivers were subjected to aggression from other cars for a variety of factors. Therefore, anger-inducing stimuli may trigger an aggressive or hostile response in the driver.
Considering the above findings, this study examines what impressions vehicle tail lamp designs evoke, whether tail lamp designs imitating angry expressions have a faster response rate than others.
This paper is organized as follows: Section 2 details previously conducted research, section 3 expands on the subjective evaluation experiments, section 4 discusses the visual search task, and we conclude with section 5.
2. Preceding research
The purpose of current automotive rear lighting is to enhance “the conspicuity of motor vehicles on the public roads so that their presence is perceived and their signals understood, both in daylight and in darkness or other conditions of reduced visibility’ (National Highway Traffic Safety Administration, Citation2004). Visibility, therefore, of rear lighting in vehicles has become an important subject of research from a road safety perspective. In making recommendations regarding intensity, shape, luminance, and lamp area standards for vehicle rear lighting, Flannagan et al. surveyed a number of studies that examined response time (RT) and subjective judgments of intensity (Flannagan, Citation1998). Flannagan indicated that changes in intensity (measured in Candela) strongly reduced RT, while changes in area had little effect. More recently, a report to the National Highway Transportation and Safety Administration (NHTSA) found that lamps with intensities of 840 and 1420 Candela (cd) produced the same RT as those measuring 420 cd (the current maximum intensity permitted by the USA Federal Motor Vehicle Safety Standards (FMVSS)), when size was held constant (Llaneras et al., Citation2010). Mortimer and Cameron noted that color-coding lamps by function tended to improve the detection of other signals as (Cameron, Citation1995; Mortimer, Citation1995). In addition, it is reported that weather conditions such as fog and heavy (Cavallo et al., Citation2001; Hautière et al., Citation2009; Mori et al., Citation2006), illumination conditions such as day-time and night-time (Khumalo, Citation2014; Plainis et al., Citation2006), and observation conditions such as viewing angle (Sivak et al., Citation2000; Tobitani et al., Citation2013), affect several visibility indices. These include subjective evaluation, RT, and distance estimation. We have found that there is an opportunity to consider the tail lamp shape as an additional factor which influences the above-mentioned indices.
A study examined the recognition characteristics humans exhibit when looking at a face, and those exhibited when looking at an object, and it was reported that the cerebral activity is different in each case (Allison et al., Citation1999). In fact, one study, which used Event-Related Potentials (ERP) to compare the cerebral activity during face recognition and object recognition, reported that N170 responded significantly (Bentin et al., Citation1996; Bötzel et al., Citation1995). N170, an ERP component that is recorded at occipitotemporal electrode sites within 170 ms of stimulus presentation, has been widely used to gain insights into the time course and functional properties of different aspects of face processing in the human brain (see Eimer et al. (Citation2010), Rossion and Jacques (Citation2011) for reviews). Morton and Johnson proposed two cognitive models, CONSPEC and CONLERN, which explain the human face-specific response from a developmental psychology perspective (Morton & Johnson, Citation1991). CONSPEC is an instinctual cognitive system used by newborn infants to recognize basic human face structure. The above findings suggest the possibility that when viewing a vehicle rear design that elicits the instinctual face recognition, the recognition characteristics would tend to be similar to that when viewing a face. Indeed, it had been reported that N170 responded by front-shots of vehicle (Boehm et al., Citation2011; Kloth et al., Citation2013).
Ohman et al. conducted tests where participants were asked to rate their impression of visual stimuli consisting of simple schematic faces with modifications to individual features (shape of eyebrows, eyes and mouth, direction of gaze, etc.) Based on the results, Ohman et al. drew up a schematic face recognition model (Lundqvist et al., Citation1999), categorizing faces with negative features as “threatening,” and faces with more symmetrical features as “friendly.” They then set participants a visual search task using the facial schematic stimuli. The results indicated that search times were shorter when viewing threatening facial stimuli, compared to friendly stimuli, thereby demonstrating the anger-superiority hypothesis (Hansen & Hansen, Citation1988). In support of this hypothesis, many studies that have used schematic emotional facial stimuli have consistently reported faster detection of angry than happy target faces among neutral distractor faces (Fox et al., Citation2000; Öhman et al., Citation2010, Citation2001; Tipples et al., Citation2002). Moreover, the hypothesis has been supported from the viewpoint of physiological function (Burra et al., Citation2016; Weymar et al., Citation2011). However, the results from studies using photographically depicted real faces as stimuli are inconsistent, some showing more rapid detection of angry than happy target faces among neutral distractors (Fox & Damjanovic, Citation2006; Horstmann & Bauland, Citation2006), others finding no difference (Williams et al., Citation2005), and yet others showing faster detection of happy than angry targets (Calvo & Nummenmaa, Citation2008; Juth et al., Citation2005).
Nevertheless, we pose the hypothesis that an “angry-looking” vehicle rear design, particularly with respect to the positioning of tail lamp LEDs, will be more apparent to fellow drivers. To validate this hypothesis and reveal the highly visible tail lamp design, we set up a subjective evaluation experiment and visual search task. The subjective evaluation experiment reveals the impression structure of the car’s rear design, and furthermore, the relationship between its morphological elements and the emotions evoked. In the visual search task, the experimental stimuli are selected based on the results of the subjective evaluation experiment, and the behavioral and physiological indices reveal whether there is a significant difference in their visibility between the tail lamp design that evokes anger and the rest.
3. Subjective evaluation experiment
The main objective of this experiment is to ascertain whether the rear design of vehicles evokes the same emotions as a person’s face, based on the similarity of impression structures obtained from these experiments, and to identify the relationship between the emotions evoked by the design and its morphological elements. In order to achieve it, we conduct five tests and propose following Objectives 1 through 5 as specific objectives for each test.
Objective 1 To collect a comprehensive set of words to evaluate the rear design of vehicles for the subjective evaluation experiment.
Objective 2 To verify whether the collected words are suitable for evaluating the rear design of vehicles.
Objective 3 To select representative words by clustering using the semantic distance between the words measured through psychological experiments.
Objective 4 To determine the impression structure of the rear design of vehicles by subjective evaluation experiments using the selected words.
Objective 5 To clarify the relationship between the morphological elements of the rear design and the emotions evoked through a newly designed subjective evaluation experiment based on the results of Test 4.
Tests 1 to 3 were designed with reference to a method widely used in affective engineering (Nagamachi, Citation2011), which is a procedure for collecting evaluative words in subjective evaluation experiments.
3.1. Test 1: evaluation word collection test
3.1.1. Purpose
To collect a comprehensive set of words to evaluate the rear design of vehicles as a first step in the selection of words to be used in the subjective evaluation experiment (Objective 1).
3.1.2. Participant background and ethical considerations
According to the results of a large-scale survey of car purchases in Japan by J.D. Power Japan, an international organization specializing in customer satisfaction surveys, there is growing interest in safety technology among young people in their 20s (J.D. POWER, Citation2019). Therefore, in this study, the subjects were in their twenties. In all subsequent tests, participants were recruited within the author’s university, and each experiment involved a different student. The test 1 was conducted on five university students in their 20s (two males and three females, mean age: 23.0, age range: 22–24).
All of the tests conducted in this study were approved by Kwansei Gakuin University’s Research Ethics Committee for Human Subjects. Participants are free to participate in the study, and their consent to participate has been obtained from the experimenter in advance by fully explaining the purpose and content of the study and the participants’ rights both orally and in writing.
3.1.3. Method
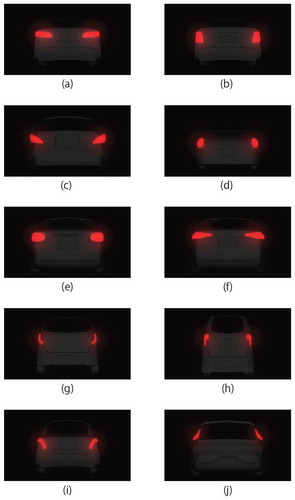
In preparing our visual stimuli, we gathered 70 photographed images of newly launched vehicles. The 70 images collected were Japanese, American, British, German, French, and Italian cars. Subsequently, after discussion among the experimenters, we selected 10 apparently typical tail lamp designs, from which we created the 3-dimensional computer graphic (3DCG). Images shown in Figure . To simulate a nighttime driving scenario, we dimmed the luminosity of the cars’ morphological elements so that participants would focus on the tail lamps while maintaining recognition of the overall rear design.
Figure 1. 3DCG Images of Rear Designs. Subfigures (a)-(j) were 3DCG images generated by reference to photographs of newly launched vehicle with typical tail lamp design. The images were rendered at 960 × 540 pixels in night light conditions using Autodesk Maya 2016
The participants were asked to write down their impressions evoked by each stimulus displayed on the monitor in the form of a free description. LCD monitor (EIZO ColorEdgeCG210) was used to present the stimuli, and color calibration was performed each time the experiment was conducted.
3.1.4. Results and discussion
We initially collected 235 evaluation words, but were left with 125 words after eliminating those with overlapping meanings. The remaining words were then divided into two categories: those describing the emotion conveyed by the tail lamp design, and those describing the impressions of the tail lamp or vehicle through consultation among the experimenters. Seeing as the focus of our study was on the emotions conveyed by the tail lamp design, we eliminated the words in the latter category. The participants’ responses showed that they had assessed a variety of information, including the shape of the tail lamps, their position, and the distance between the left and right tail lamp. The results also yielded a plethora of evaluation terms, ranging from words describing the shape of tail lamps such as “big,” “round,” and “spaced far apart,” to words describing the emotion associated with the shape such as “smiling,” “in a good mood,” and “sad.”
3.2. Test 2: evaluation word appropriateness test
3.2.1. Purpose
The words collected include words that are clearly not suitable to express an impression of a car’s rear design, or words that are so polysemous that the meaning of the word changes from person to person. Therefore, it is need to verify whether the collected words are suitable for evaluating the rear design of vehicles (Objective 2).
3.2.2. Participant background
The test was conducted on 10 university students in their 20s (seven males and three females, mean age: 22.8; age range: 22–24).
3.2.3. Method
We used a total of 106 words for this test. The words were shown in random order and the participants were asked to rate each word in terms of whether or not it fits their impression of tail lamps. The rating was based on a seven-point scale (1: Very inappropriate, 2: Inappropriate, 3: Rather inappropriate, 4: Not sure either way, 5: Rather appropriate, 6: Appropriate, 7: Very appropriate). When briefing the participants on the content of the test, we presented them with the 10 3DCG images in Figure on the LCD monitor as specific examples of the vehicle design.
3.2.4. Results and discussion
The ratings were scored as follows: “1: Very inappropriate” = −3 points; “2: Inappropriate” = −2 points; “3: Rather inappropriate” = −1 point; “4: Not sure either way” = 0 points; “5: Rather appropriate” = 1 point; “6: Appropriate” = 2 points; “7: Very appropriate” = 3 points. As for the criteria we used to qualify the evaluation words, we decided that we would adopt words with a mean score of 1.0 or higher and a standard deviation of less than 1.5. Based on these criteria, we selected 49 words for rating/describing tail lamps. Table shows the adopted evaluation of words.
Table 1. Selected evaluation words
3.3. Test 3: evaluation word selection test
3.3.1. Purpose
The number of evaluation words needs to be further reduced to account for the burden on participants in subjective evaluation experiments. Therefore, we select representative words (“key words”) for use in the subjective evaluation experiment by clustering using the semantic distance between the 49 evaluation words measured through psychological experiments (Objective 3).
3.3.2. Participant background
The test was conducted on 10 university students in their 20s (five males and five females, mean age: 23.0; age range: 22–24).
3.3.3. Method
We selected representative words from the 49 evaluation words picked in the previous two tests. This we accomplished by using the degree of similarity to calculate the distances between the evaluation words, and then using a cluster analysis on groups of analogous evaluation words. We presented the participants with pairs of words and asked them to rate, on a two-point scale, whether the words accurately represented their impression of tail lamps. We presented the participants with the 10 3DCG images in Figure on the LCD monitor as specific examples of tail lamps. Each of the 49 evaluation words were paired with all the other words in a round-robin fashion, making a total of 1,176 rounds.
3.3.4. Analysis
If the rate at which a given word is judged to convey an analogous impression is deemed the concordance rate
, then this concordance rate may be used to express the degree of similarity
of given word
with other words, in 49 vectors as shown in EquationEquation (1)
(1)
(1) below.
Furthermore, psychological distance from evaluation word
to evaluation word
can be defined according to EquationEquation (2)
(2)
(2) below.
We performed multi-dimensional scaling (MDS) using psychological distance defined above, and interpreted the impression structure of the tail lamp visually. Next, in order to determine the key words, we performed a hierarchical cluster analysis (Ward’s method) and categorized the 49 evaluation words. Using the resulting hierarchical structure, we determined the number of clusters. The criteria for determining the appropriate number of clusters were that the analogous evaluation words in each cluster should have no semantic incongruity and that they should be as consistent as possible. The above statistical analyses were performed using IBM SPSS Statistics v. 23.0.
3.3.5. Results and discussion
Using MDS, we mapped the 49 evaluation words on a two-dimensional plane. The results of this mapping are shown in Figure .
Figure 2. Mapping of Evaluation Words. This figure shows two-dimensional plane mapping of 49 evaluation words based on the MDS results. The x-axis is a scale of comfort (comfortable—uncomfortable) and the y-axis is a scale of activity (high—low)
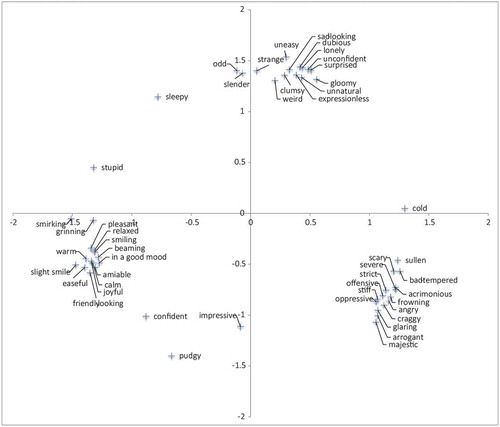
Looking at the horizontal axis in Figure , the terms “angry,” “sullen,” and “bad-tempered” have high values, whereas “smiling,” “slight smile,” and “friendly” have low values. Looking at the vertical axis, “sad,” “surprised,” and “weird” have high scores. Based on these findings, we took the horizontal axis as the scale of comfort (comfortable—uncomfortable), and the vertical axis as the scale of activity (high—low). These axes are typically seen in the results of general research about human emotion (Shibui & Shigemasu, Citation2005), which implies that our test results have validity.
We used the cluster analysis to categorize the 49 words into three groups, namely the “happy cluster,” the “angry cluster,” and the “sad cluster.” We then selected 15 words key words, which we defined as evaluation word that can cover the semantic space of their cluster. Accordingly, we calculated the distance of each evaluation word from the center of its cluster, sorted the words in order of proximity to the center, and chose the words that were in the top three rankings in each cluster. In addition, we performed a principal component analysis (PCA) on the evaluation words within each cluster, and adopted (in addition to the top three words) the highest and lowest values in the first principal component axis (PC1). When doing so, we performed an outlier detection test based on the Mahalanobis distance, and removed the evaluation words that we judged to be outliers. Table shows the adopted key words in each cluster.
Table 2. The selected key words
3.4. Test 4: subjective evaluation experiment 1
3.4.1. Purpose
To determine the impression structure of the rear design of vehicles by subjective evaluation experiments using the key words and ascertain whether the rear design of vehicles evokes the same emotions as a person’s face based on the similarity of the impression structures (Objective 4).
3.4.2. Participant background
The test was conducted on 15 university students in their 20s (eight males and seven females, mean age: 23.2; age range: 21–24).
3.4.3. Method
The 10 3DCG images were presented on an LCD monitor (EIZO ColorEdgeCG210) placed 1.6 m from the participants. We set the size of the presented images such that the participants would view the vehicle as if it was 30 m away. This is the stopping distance of a vehicle traveling at 60 km/hour on a dry asphalt road. The test was conducted in a darkened room, and the LCD monitor was calibrated for each test.
The participants were shown the images in random order, and they were asked to rate how accurately each of the 15 key words describe the image shown. The participants rated each word on a Likert scale (1: Very accurate, 2: Accurate, 3: Rather accurate, 4: Not sure either way, 5: Rather inaccurate, 6: Inaccurate, 7: Very inaccurate).
3.4.4. Results
We took the mean scores of the 15 individuals and performed factor analysis based on the principal factor method, and varimax rotation using IBM SPSS Statistics v. 23.0. The criteria for determining the number of factors were Kaiser’s stopping rule. Table shows the factor loadings for each key word. According to the factor analysis, the cumulative contribution ratio is 69.302%, and the eigenvalue is 1.893 for the total factors up to Factor 3.
Table 3. Factor analysis results (subjective evaluation experiment 1)
3.4.5. Discussion
We interpreted the factors as follows: Factor 1 was “anger,” given that the factor loadings for “strict,” “acrimonious,” “severe,” “majestic,” and “bad-tempered” were high, at .600 and above. Factor 2 was “happiness,” given that the factor loadings for “smiling,” “smirking,” “pleasant,” and “joyful” were high. Factor 3 was “sad,” given that “dubious,” “weird,” “gloomy,” and “sad” had high factor loadings. The factor structure obtained from these results is consistent with the structure represented in the emotion models used in emotion studies (Shibui & Shigemasu, Citation2005). Therefore, we are confident that the vehicle rear designs conveyed human expressions and evoked the associated emotions.
3.5. Test 5: subjective evaluation experiment 2
3.5.1. Purpose
To clarify the relationship between the morphological elements of the rear design and the emotions evoked through a newly designed subjective evaluation experiment based on the results of Test 4(Objective 5), and to determine the stimulus material to use in the visual search task.
3.5.2. Participant Background
The test was conducted on 20 university students in their 20s (12 males and eight females, mean age: 22.2; age range: 20–24).
3.5.3. Method
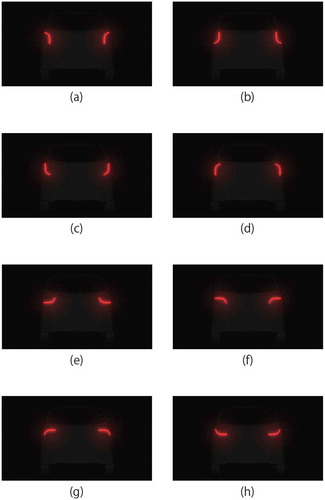
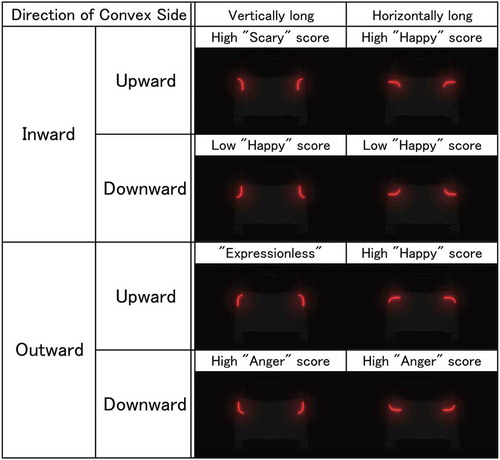
Based on the results presented in subchapter 3.4, we created new stimulus material that focused on the curvature of the tail lamps. We made eight designs, based on tail lamp shapes that had high Factor 1 scores, with the only modification being to change the direction of the convex side (see Figure ). In order to increase the focus on the tail lamp shape, we eliminated curvature in parts outside the tail lamps and darkened the areas outside the tail lamps. All other test conditions were the same as for Test 4.
Figure 3. Recreated Stimulus Material. The eight designs were recreated in terms of the curvature of the tail lamps and used for the stimulus material in Test 5: Subjective Evaluation Experiment 2. Each of subfigures (a)-(h) indicates the Stimulus A-H
3.5.4. Results
We performed factor analysis using the same criteria as in subsection 3.4, and found the cumulative contribution ratio to be 81.070%, and the eigenvalue to be 1.045 for the total factors up to factor 3. Table . shows the factor loadings for each key word.
Table 4. Factor analysis results (subjective evaluation experiment 2)
3.5.5. Discussion
We interpreted the factors as follows: Factor 1 was “happy,” given that the factor loadings for “smiling,” “smirking,” “pleasant,” and “joyful” were high, at .600 and over. Factor 2 was “angry,” given that the factor loadings for “strict,” “acrimonious,” “severe,” “majestic,” and “bad-tempered” were high. Factor 3 was “scary,” given that “suspicious,” “weird,” and “gloomy” were high. As for Factor 4, it only consisted of “expressionless,” so we deemed it an independent variable.
Next, we plotted the three factors as two-dimensional graphs and then mapped the stimulus material on these graphs in order to determine the impression structure of the vehicle’s tail lamps (see Figure ).
Figure 4. Factor Scores for the Stimuli. The stimulus materials are mapped on two-dimensional graphs. (a) was a scatter plot with Factor 1 as the x-axis and Factor 2 as the y-axis, (b) was a scatter plot with Factor 2 as the x-axis and Factor 3 as the y-axis, (c) was a scatter plot with Factor 1 as the x-axis and Factor 3 as the y-axis
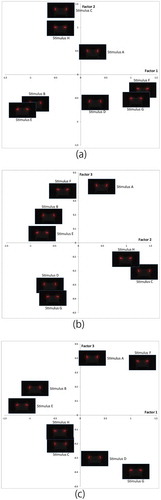
According to the scatter plot with Factor 1 as the x-axis and Factor 2 as the y-axis (Figure )), the tail lamp designs that have high Factor 2 scores, specifically, “strict,” “acrimonious,” and “severe,” are the designs shown in Stimulus C and Stimulus G. This finding reveals that tail lamp designs in which the convex side faces outward or downward create an impression of anger. Next, according to the scatter plot with Factor 1 as the x-axis and Factor 3 as the y-axis, the tail lamp designs that have high Factor 1 scores (Figure )), specifically, “smiling,” “pleasant,” and “joyful,” are the designs shown in Stimulus F and Stimulus G. Stimuli F and G both have high Factor 1 scores, but the Factor 3 scores are either positive or negative, depending on whether the convex side is facing inward or outward. Figure presents a summary of how factor scores depend on the direction of the convex side. Based on these results, we designated the tail lamp design images “key images” to use in the visual search task discussed in section 4. In our selection of the key images, we selected Stimulus G as a “happy (friendly) face,” Stimulus H as an “angry (threatening) face,” and Stimulus D as an “expressionless face.”
Figure 5. Differences in Impression depending on Direction of Convex Side. This figure presents a summary of how factor scores depend on direction of convex side (inward—outward and upward—downward) and aspect ratio (vertically long—horizontally long)
4. Visual search task
4.1. Purpose
To verify whether the response time and EEG as behavioral and physiological indices, respectively, are affected by the emotion evoked by the stimulus material.
4.2. Participant background
The test was conducted on nine university students in their 20s (six males, three females; mean age: 21.7; age range: 20–24).
4.3. Method
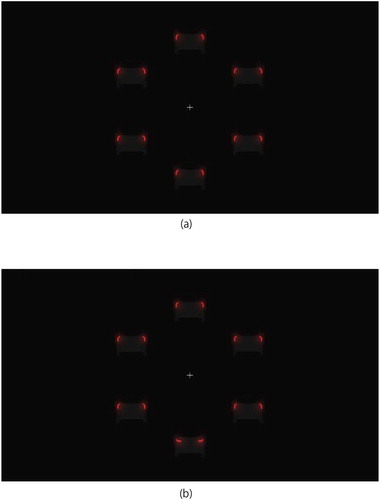
The stimulus material comprised the three types of key images. The expressionless face was the distractor, and the friendly face and threatening face were the targets. We set an image (hereinafter, “visual stimulus”) consisting of points directed in a circle subtending a visual angle centered around the fixation point, along which the key images would be positioned. Figure shows a target-present stimulus, in which one of the key images with-in the visual stimulus is the target, and a target-absent stimulus, which is entirely composed of distractors.
Figure 6. Visual Stimuli. Tail lamp design arrays used as stimuli in the visual search task. (a) shows a tar-get-absent stimulus, and (b) shows a target-present stimulus at bottom position, in which one of the key images is the target
The participants were required to answer (by pressing a response key), whether or not the target appears within the visual stimulus they were shown. We instructed the participants to press the response key with the index finger of their dominant hand as quickly and as accurately as possible. We randomized and counterbalanced the left-right allocation of the response key among the participants. A response pad (CEDRUS RB-540) was used to measure key presses.
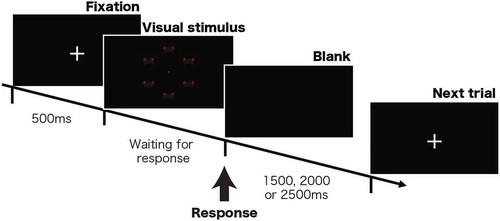
There were 240 rounds each for the target-present stimulus and target-absent stimulus. In the case of the target-present stimulus, there were six potential positions where the target could appear. Since there were two types of targets (a friendly face and a threatening face), it was possible to obtain measurements for 20 rounds of a single visual stimulus per participant. We presented the visual stimuli in random order. The test procedures were managed and executed by Presentation (Neurobehavioral Systems). Figure shows the test procedure.
Figure 7. Experiment Procedure of Visual Search Task. Each trial of the search task consisted of a centrally presented fixation cross (500 ms), followed by the search array which remained on screen until a response was made and then a blank black screen (1500, 2000, 2500 ms)
We set the size of the key images shown on the monitor so that, when viewed from 1.2 m from the monitor, they would correspond to the size of actual vehicles 30 m ahead. We also used a chin support to control the physical movement. The test was conducted in a darkened room, and the stimulus material was presented on an LCD monitor (EIZO ColorEdgeCG210), which was calibrated for each test.
After being briefed, the participants waited in the darkened room for 5 min so that their eyes would grow accustomed to the dark, undertook a practice session consisting of 24 rounds, and then completed the actual test. To limit the burden on the participants, we set a rest period every 240 rounds.
4.4. Response time measurement results and discussion
The results of the test are shown in Figure . We excluded values pertaining to improper or defaulted rounds, as well as those where the response times were three or more standard deviations from the mean participant response time (excluded round rate = 1.94%). We subjected each of the results to a two-factor repeated measures ANOVA using IBM SPSS Statistics v. 23.0., in which the two factors were the target type and the target position.
Figure 8. Response Accuracy and Response Time Results. This figure shows experiment results; response accuracy in subfigure (a) and response time in subfigure (b). With regard to response accuracy, the ANOVA did not indicate any statistically significant results for either factor. With regard to response time, the ANOVA indicated a main effect for the target type (F(1,8) = 9.74, p < .05), but not for the target position, and it did not indicate an interaction effect
With regard to response accuracy, the ANOVA did not indicate any statistically significant results for either factor. For response time, the ANOVA indicated a main effect for the target type (F(1,8) = 9.74, p < .05), but not for the target position, and it also did not indicate an interaction effect.
Looking at the response accuracy, the fact that there were no statistically significant results for either factor demonstrates that, in this visual search task, there was no discrepancy in difficulty level among the target types or among the target positions. With regard to response time on the other hand, given that there was a main effect of the target type, the results imply that in tail lamp designs, an angry expression has perceptual preeminence, as is the case with human faces.
4.5. EEG measurement
To validate the response time results from a neurophysiology perspective, we investigated event-related potentials (ERPs) in the visual search task, measuring the N2pc component as an electrophysiological marker of spatial selective attention (Eimer & Kiss, Citation2008; Eimer et al., Citation2010). The N2pc component, an enhanced negativity in the time range of 180–300 ms, appears in the right hemisphere of the brain when the subject pays attention to the left visual field and vice versa. This characteristic makes it useful for directly measuring the general direction of a person’s focus (either left or right). According to the anger-superiority hypothesis, we expected to find more enhanced N2pc component when viewing the threatening face than the friendly face.
4.5.1. Apparatus and method
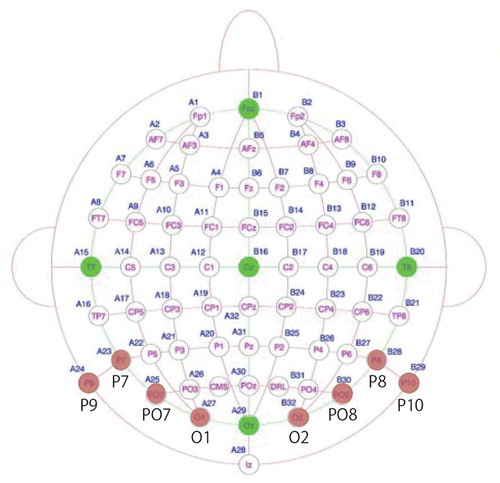
EEG signals from 64 electrodes were recorded continuously, using a Biosemi active two system and digitized at a rate of 1024 Hz, with a common average reference over all scalp electrodes. All channels were band-pass filtered from 1 to 40 Hz. Stimulus-synchronized epochs were extracted from 100 ms before, to 800 ms after picture onset, and baseline corrected (100 ms prior to stimulus onset). We analyzed the EEG signals coming from the lateral occipital electrodes in the time range between 240 and 300 ms, where the N2pc component was maximal. The N2pc was scored on the basis of maximal ERP mean amplitudes of the left-sided electrode cluster including P9, P7, PO7, O1, and right-sided electrode cluster including P10, P8, PO8, O2 (Figure. ). Based on the above, the lateralized N2pc component was calculated in accordance with the procedures proposed by Weymar et al. (Citation2011).
Figure 9. Biosemi Electrodes Layout. 64 + 2 channel Biosemi electrodes layout. The red circles indicate the electrodes used in this study
Obtained data were entered into a three-factor repeated measures ANOVA which included the facial expression (threatening vs. friendly), target position (left vs. right relative to fixation) and electrode site (left vs. right cluster). Seeing as the N2pc is a lateralized component, the occurrence of a reliable N2pc will be indicated by a significant interaction between target position and electrode site. Furthermore, facial expression effects (threatening vs. friendly) on the N2pc will be reflected by a significant three-way interaction between target position, electrode site, and the facial expression. The ANOVA was performed using IBM SPSS Statistics v. 23.0.
4.5.2. Results
As shown in Figure , an N2pc component was elicited approximately 240 ms post stimuli of lateral occipital scalp sites. The ANOVA revealed an interaction between the electrode site and target position, F(1,9) = 6.55, p < .05, indicating the presence of the N2pc. Moreover, there was an interaction between the facial expression, target position, and electrode site, F(1,9) = 3.47, p < .10, showing that the visual search for threatening tail lamp design induced a stronger N2pc amplitude than friendly tail lamp design (see Figure ).
Figure 10. Grand Average ERPs. The upper section shows grand averaged ERPs elicited in the 500 ms interval in response to threatening (black lines) and friendly (gray lines) target faces, both contra-lateral (solid lines) and ipsilateral (dashed lines) to the visual hemifield where the face was presented. The shaded area represents the time window (240–300 ms) used in the analyses. The lower section shows the topographical voltage maps (top views) for threatening and friendly targets presented on the right side (left maps) and left side (right maps), showing the distribution of N2pc negativity in the time interval 240–300 ms
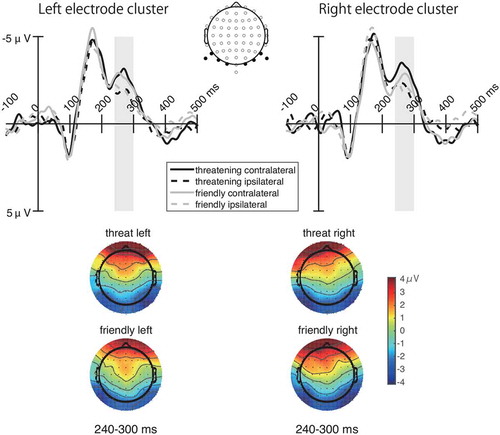
Figure 11. Comparison of the N2pc between Threatening and Friendly. Magnitude of the N2pc amplitude (contralateral minus ipsilateral)
4.5.3. Discussion
Neural responses showed the same tendency as has been found in earlier research where schematic faces are used (Weymar et al., Citation2011). The results indicate that threatening tail lamp designs capture more selective attention than friendly tail lamp designs, as is the case with the respective schematic faces.
5. Conclusion
In this study, we examined how visibility varies according to differences in tail lamp design. We conducted tests with a view of proposing a tail lamp design that is more noticeable to fellow drivers. Specifically, by focusing on perceptual sensitivity in human face recognition, we conducted a subjective evaluation experiment and visual search task.
The results revealed that humans’ impression of a vehicle rear design is structurally similar to their impression of a face, and that the tail lamp design affects response time. We noted that when a tail lamp design conveys an angry expression, the response time is shortest compared to tail lamp designs that convey other expressions. This result supports the anger-superiority hypothesis (Hansen & Hansen, Citation1988) and can be attributed to the fact that the visual stimuli used in this study were closer to the schematic face. Moreover, we validated the suitability of the results by EEG measurement.
These findings support the study of Weymar et al. (Citation2011) and suggest that a vehicle tail lamp will have a more striking appearance if it evokes angry emotion.
5.1. Implications
Among the results obtained, the impression structure of a car’s rear-shot is similar to that of a human face, which may lead to the application of various findings on face recognition research to design guidelines. In particular, studies on the influence of spatial information such as face parts and their arrangement on facial expression recognition (Boucher & Ekman, Citation2006; Calder et al., Citation2000) and color information, such as the interaction between facial expression and color (Nakajima et al., Citation2017; Stephen et al., Citation2012), are considered to be easier to incorporate into specific designs.
The results in the visual search task will lead to an efficient design of tail lamps that encourage rapid visibility of the target and avoidance behavior. The difference in reaction time obtained in this experiment is about 200 ms, which, when converted to distance, translates into a difference of 3.3 m at a speed of 60 km/h. This difference is considered to be very significant in terms of accident avoidance.
5.2. Limitations
A limitation of this study is that the visual stimuli in the visual search task are different from the actual driving environment in order to make a comparison with previous studies. Therefore, it is not certain that the same trend as the results obtained can be confirmed in the real environment. However, since the study showed almost the same trend as previous studies on schematic faces, some degree of universality can be expected.
Also, the other difference from the real environment is that the visual stimulus does not take into account the time change. Since The brightness and color of the tail lamps actually change over time, it is necessary to consider how they interact with the effects of spatial design.
In addition to the above, an ongoing challenge concerns the variation of the visual stimulus. In particular, it will be necessary to further examine the influence of the variation in the viewing conditions of 3DCG images such as weather conditions, illumination conditions, and observation conditions, and the morphological elements of rear design constituents other than the tail lamps.
As for the attributes of the participants, since all the participants were university students, there may be a bias in the results of the experiment due to the age. Abbruzzese et al. (Citation2019) has reported that there is no difference in the perception of anger expression between younger and older people. Therefore, it was judged that there was no significant effect of age bias on the experimental results. However, gender differences were observed in the perception of anger expressions (Abbruzzese et al., Citation2019). There is room for improvement in the selection and expansion of participants.
Finally, there is no denying the possibility that the rear design, which evokes angry emotions, may make other drivers consciously or unconsciously aggressive, making them more dangerous. Therefore, it is necessary to closely examine in the future what emotions the tail lamp design used as an experimental stimulus in this study evokes.
Additional information
Funding
Notes on contributors
Kensuke Tobitani
Kensuke Tobitani has been working as an Associate Professor in the Department of Information Systems, University of Nagasaki, Nagasaki, JAPAN. of interest includes machine learning, affective engineering, and computer vision. The author’s main research theme is the analysis of human sensibility by machine learning, and he has been engaged in research on modeling the relationship between physical properties of objects and the human In particular, he has published papers on understanding and analyzing the texture of objects and estimating human impressions of three-dimensional objects.
References
- Abbruzzese, L., Magnani, N., Robertson, I. H., & Mancuso, M. (2019). Age and gender differences in emotion recognition. Frontiers in Psychology, 10, 2371. https://doi.org/10.3389/fpsyg.2019.02371
- Allison, T., Puce, A., Spencer, D. D., & McCarthy, G. (1999). Electrophysiological studies of human face perception. i: Potentials generated in occipitotemporal cortex by face and non-face stimuli. Cerebral Cortex, 9(5), 415–21. https://doi.org/10.1093/cercor/9.5.415
- Alonso, F., Esteban, C., Montoro, L., & Serge, A. (2019). Conceptualization of aggressive driving behaviors through a perception of aggressive driving scale (pad). Transportation Research Part F: Traffic Psychology and Behaviour, 60, 415–426. https://doi.org/10.1016/j.trf.2018.10.032
- Bentin, S., Allison, T., Puce, A., Perez, E., & McCarthy, G. (1996). Electrophysiological studies of face perception in humans. Journal of Cognitive Neuroscience, 8(6), 551–565. https://doi.org/10.1162/jocn.1996.8.6.551
- Boehm, S. G., Dering, B., & Thierry, G. (2011). Category-sensitivity in the n170 range: A question of topography and inversion, not one of amplitude. Neuropsychologia, 49(7), 2082–2089. https://doi.org/10.1016/j.neuropsychologia.2011.03.039
- Bötzel, K., Schulze, S., & Stodieck, S. R. (1995). Scalp topography and analysis of intracranial sources of face-evoked potentials. Experimental Brain Research, 104(1), 135–143. https://doi.org/10.1007/BF00229863
- Boucher, J. D., & Ekman, P. (2006). Facial areas and emotional information. Journal of Communication, 25(2), 21–29. https://doi.org/10.1111/j.1460-2466.1975.tb00577.x
- Burra, N., Barras, C., Coll, S. Y., & Kerzel, D. (2016). Electrophysiological evidence for attentional capture by irrelevant angry facial expressions. Biological Psychology, 120, 69–80. https://doi.org/10.1016/j.biopsycho.2016.08.008
- Calder, A. J., Young, A. W., Keane, J., & Dean, M. (2000). Configural information in facial expression perception. Journal of Experimental Psychology: Human Perception and Performance, 26(2), 527–551. https://doi.org/10.1037//0096-1523.26.2.527
- Calvo, M. G., & Nummenmaa, L. (2008). Detection of emotional faces: Salient physical features guide effective visual search. Journal of Experimental Psychology: General, 137(3), 471–494. https://doi.org/10.1037/a0012771
- Cameron, D. L. (1995). Color-specificity to enhance identification of rear lights. Perceptual and Motor Skills, 80(3), 755–769. https://doi.org/10.2466/pms.1995.80.3.755
- Cavallo, V., Colomb, M., & Doré, J. (2001). Distance perception of vehicle rear lights in fog. Human Factors, 43(3), 442–451. https://doi.org/10.1518/001872001775898197
- Eimer, M., & Kiss, M. (2008). Involuntary attentional capture is determined by task set: Evidence from event-related brain potentials. Journal of Cognitive Neuroscience, 20(8), 1423–1433. https://doi.org/10.1162/jocn.2008.20099
- Eimer, M., Kiss, M., & Nicholas, S. (2010). Response profile of the face-sensitive n170 component: A rapid adaptation study. Cerebral Cortex, 20(10), 2442–2452. https://doi.org/10.1093/cercor/bhp312
- Flannagan, M. J. (1998). Photometric requirements for signal lamps using innovative light sources: Updating requirements based on lighted sections. Transportation Research Institute, UMTRI-98-19
- Fox, E., & Damjanovic, L. (2006). The eyes are sufficient to produce a threat superiority effect. Emotion, 6(3), 534–539. https://doi.org/10.1037/1528-3542.6.3.534
- Fox, E., Lester, V., Russo, R., Bowles, R., Pichler, A., & Dutton, K. (2000). Facial expressions of emotion: Are angry faces detected more efficiently? Cognition & Emotion, 14(1), 61–92. https://doi.org/10.1080/026999300378996
- Hansen, C. H., & Hansen, R. D. (1988). Finding the face in the crowd: An anger superiority effect. Journal of Personality and Social Psychology, 54(6), 917. https://doi.org/10.1037/0022-3514.54.6.917
- Hautière, N., Dumont, E., Brèmond, R., & Ledoux, V. (2009). Review of the mechanisms of visibility reduction by rain and wet road. In 8th International Symposium on Automotive Lighting, München, (pp. 445–455).
- Horstmann, G., & Bauland, A. (2006). Search asymmetries with real faces: Testing the anger-superiority effect. Emotion, 6(2), 193–207. https://doi.org/10.1037/1528-3542.6.2.193
- J.D. POWER. (2019). Nvis: New vehicle intender study. https://japan.jdpower.com/ja/press-releases/2019_Japan_New_Vehicle_Intender_Study
- Juth, P., Lundqvist, D., Karlsson, A., & Ohman, A. (2005). Looking for foes and friends: Perceptual and emotional factors when finding a face in the crowd. Emotion, 5(4), 379–395. https://doi.org/10.1037/1528-3542.5.4.379
- Khumalo, N. (2014). Visibility improvements through information provision regarding sun glare: A case study in Cape Town. [PhD thesis]. University of Cape Town.
- Kloth, N., Itier, R. J., & Schweinberger, S. R. (2013). Combined effects of inversion and feature removal on n170 responses elicited by faces and car fronts. Brain and Cognition, 81(3), 321–328. https://doi.org/10.1016/j.bandc.2013.01.002
- Llaneras, R. E., Neurauter, M. L., Perez, M. (2010). Evaluation of enhanced brake lights using surrogate safety metrics: Task 2 & 3 report: Development of rear signaling model and work plan for large scale field evaluation (Technical report).
- Lundqvist, D., Esteves, F., & Ohman, A. (1999). The face of wrath: Critical features for conveying facial threat. Cognition & Emotion, 13(6), 691–711. https://doi.org/10.1080/026999399379041
- Mori, K., Kato, T., Takahashi, T., Ide, I., Murase, H., Miyahara, T., & Tamatsu, Y. (2006). Visibility estimation in foggy conditions by in-vehicle camera and radar. In First International Conference on Innovative Computing, Information and Control-Volume I (ICICIC’06), (vol 2, pp. 548–551). Beijing, China: IEEE.
- Mortimer, R. G. (1995). Dynamic evaluation of automobile rear lighting configurations. Highway Research Record, 275, 12–22.
- Morton, J., & Johnson, M. H. (1991). Conspec and conlern: A two-process theory of infant face recognition. Psychological Review, 98(2), 164. https://doi.org/10.1037/0033-295X.98.2.164
- Nagamachi, M. (2011). Kansei/affective engineering. CRC Press.
- Nakajima, K., Minami, T., & Nakauchi, S. (2017). Interaction between facial expression and color. Scientific Reports, 7(1), 41019. https://doi.org/10.1038/srep41019
- Öhman, A., Lundqvist, D., & Esteves, F. (2001). The face in the crowd revisited: A threat advantage with schematic stimuli. Journal of Personality and Social Psychology, 80(3), 381. https://doi.org/10.1037/0022-3514.80.3.381
- National Highway Traffic Safety Administration. (2004). U.S. code of federal regulations. Title 49, Part 571, Standard 108 federal motor vehicle safety standards.
- Öhman, A., Juth, P., & Lundqvist, D. (2010). Finding the face in a crowd: Relationships between distractor redundancy, target emotion, and target gender. Cognition and Emotion, 24(7), 1216–1228. https://doi.org/10.1080/02699930903166882
- Plainis, S., Murray, I., & Pallikaris, I. (2006). Road traffic casualties: Understanding the night-time death toll. Injury Prevention, 12(2), 125–138. https://doi.org/10.1136/ip.2005.011056
- Regulation of The European Parliament and of the Council. (2009). Vehicle safety systems | Mobility and transport. https://ec.europa.eu/transport/themes/its/road/application_areas/vehicle_safety_systems_en
- Rossion, B., & Jacques, C. (2011). The n170: Understanding the time-course of face perception in the human brain. In Luck, S. and Kappenman, E (Eds.), The oxford handbook of ERP components (pp. 115–142). Oxford: Oxford University Press.
- Shibui, S., & Shigemasu, K. (2005). A model of two-dimensional placement of the facial expressions of emotion. Japanese Psychological Research, 76(2), 113–121. https://doi.org/10.4992/jjpsy.76.113
- Sivak, M., Flannagan, M. J., Miyokawa, T., & Traube, E. C. (2000). Color identification in the visual periphery: Consequences for color coding of vehicle signals. Transportation Human Factors, 2(2), 135–150. https://doi.org/10.1207/STHF0202_04
- Stephen, I. D., Oldham, F. H., Perrett, D. I., & Barton, R. A. (2012). Redness enhances perceived aggression, dominance and attractiveness in men’s faces. Evolutionary Psychology, 10(3), 147470491201000312. https://doi.org/10.1177/147470491201000312
- Tipples, J., Atkinson, A. P., & Young, A. W. (2002). The eyebrow frown: A salient social signal. Emotion, 2(3), 288. https://doi.org/10.1037/1528-3542.2.3.288
- Tobitani, K., Kato, K., & Yamamoto, K. (2013). Research of information presenting method based on characteristics of peripheral vision. IEEJ Transactions on Electronics, Information and Systems, 133(1), 2–7. https://doi.org/10.1541/ieejeiss.133.2
- Weymar, M., Low, A., Ohman, A., & Hamm, A. (2011). The face is more than its parts—brain dynamics of enhanced spatial attention to spatial threat. NeuroImage, 58(7), 946–954. https://doi.org/10.1016/j.neuroimage.2011.06.061
- Williams, M., Moss, S., Bradshaw, J., & Mattingley, J. (2005). Look at me, i’m smiling: Visual search for threatening and nonthreatening facial expressions. Visual Cognition, 12(1), 29–50. https://doi.org/10.1080/13506280444000193