
 ?Mathematical formulae have been encoded as MathML and are displayed in this HTML version using MathJax in order to improve their display. Uncheck the box to turn MathJax off. This feature requires Javascript. Click on a formula to zoom.
Abstract
In this project, the design of the center of pressure apparatus is attained to determine the static hydrostatic force exerted by a fluid on a submerged surface. It is also to perform a comparison of the measured magnitude and position of this experimental hydrostatic force with the theoretical one. One of the main goals of this research is to figure out the resultant hydrostatic force applied on a submerged surface. Moreover, it is to find out the experimental and theoretic center of pressure. The design of the center of pressure is completed with a demonstration for both two cases (partially submerged water surface and for the fully submerged plane area). The relationship between the theoretic hydrostatic force and experimental hydrostatic force is represented. In addition, the correlation between the experimental center of pressure and the theoretical center of pressure is demonstrated too. The results showed that there is a linear relationship between theoretic and experimental hydrostatic pressure force for the partly submerged surface and for the fully submerged surface plane is also linear too. The hypothetical forces compared to the calculated force were approximately comparable with a percent error of nearly 11%. However, the error in the distance to the center of pressure in comparison with the theoretical one was obviously high. Moreover, the correlation between hydrostatic force and the normal depths for partially submerged surface plane shows a power model with R2 is equal to 1. Otherwise, the model is linear for the correlation between theoretical hydrostatic force and the average depths for a fully submerged surface. Finally, it was found that the depth of immersion affects the center of the pressure system. For instance, the water level increased, the center of pressure is increasing too. But, the center of area is constant. Different fluids represent different results in both theoretical and experimental hydrostatic force and in the correlation between the depths of immersion and the theoretical hydrostatic force. This is related to the fluid properties such as viscosity, weight density, mass density, and others. To sum up, the errors existed in these analyses which could be related to the errors in measuring and reading, in the level of water, errors due to unbalanced weights.
PUBLIC INTEREST STATEMENT
The aim of our paper is to design a hydrostatic pressure apparatus. The apparatus consists of the weight of fluids at rest causes a pressure, which is termed as hydrostatic pressure. A force is exerted in which it is proportional to the size of the area by the pressure acts on any area that is in communication with the fluid. The paper is important to study the effect of hydrostatic pressure which is essential in many fields of engineering. The paper can be beneficial to study the effect of the center of pressure on many fields of engineering such as shipbuilding, in hydraulic engineering when designing locks and weirs, and in sanitation and building services. The paper studied the hydrostatic pressure in liquids (water and cleaning fluid) at rest. The effect of the hydrostatic pressure of fluids can be clearly shown at different liquid levels.
1. Introduction
When it is needed to deal with fluid mechanics, it is important to understand some phenomena that are dealing with such apparatus in a fluid. One of these apparatuses is called the center of pressure or the hydrostatic pressure apparatus. The properties of fluids at rest can be associated with some problems with fluid statics.
Fluid statics is utilized for several purposes such as it is utilized to figure out the forces acting either on submerged bodies or floating and other forces developed by apparatus like hydraulic presses and others. Using fluid statics for the determination of the forces on the surfaces is essential in the design of many engineering systems such as water dams and liquid storage tanks.
In many engineering application, there are submerged surfaces. Examples of submerged surfaces are dams, weirs, and water gates. Thus, studying the knowledge related to the force acting on submerged surfaces is significant. Furthermore, the pressure distribution which acts on the submerged area results when the pressures increase linearly with increasing depth.
The analysis of this situation involves determining a force which is equivalent to the pressure, and finding the line of action of this force.
Thus, design such an apparatus to deal with fluid static is important such as the design of hydrostatic force apparatus to determine the static thrust exerted by a fluid on a submerged surface. It is also to make a comparison between the experimental and theoretical hydrostatic force, the position of the center of pressure of the exerted force.
In general term, the center of pressure is located below centroid since pressure increase with depth. The determination of the center of pressure can be performed by equating the moments of the resultant and distributed forces about any arbitrary axis. The fluid pressure distributed over its surface can be achieved by several examples such as a plate exposed to the fluid.
Additionally, the hydrostatic forces on a plane surface form a system of parallel forces. There is a necessity to determine the magnitude of the force and its point of application in which this point is called the center of pressure.
To determine the hydrostatic pressure force on one side of a plane surface submerged in a static fluid, it is equal to the output of the fluid pressure at the centroid of the surface multiply the surface area in contact with the fluid. Consequently, basic physics states that the distributed load of the hydrostatic force is equal to the integral of the local pressure force over the area. Besides, the direction of the resultant force will always be normal to the surface because the pressure acts normal to a plane surface.
In this research, the center of the pressure apparatus will be designed. The moment due to hydrostatic pressure distribution on the vertical end of the water vessel should be involved in this design. Two different liquids will be demonstrated in this research which is water and cleaning fluid.
Besides, the objectives of this research are to comprehend the hydraulic pressure distribution and to validate the location of the center of pressure. Moreover, one of the main goals of this research is to design a center of pressure apparatus. Also, it is to verify the theoretical formula governing hydrostatic force and center of pressure on a submerged planner surface.
2. Literature review
Yamini et al. (Citation2019) stated that the use of ACB Mat (Articulated concrete block mattress) in the present study in the designing and implementing coastal protection structures such as implementation speed and construction cost. The investigation of the effect of different parameters is done to improve the existing scale model with the effects of mattress strength, construction slope, filter layer, ABC mat thickness, and friction coefficient. Several parameters are investigated in a new modified equation such as stability shifting factor, stability course factor, and stability shape factor
Yamini et al. (Citation2019) stated that by the use of suitable experimental equipment is to design relations for wave reflection and overtopping in ACB (Articulated concrete block) mattress Mats with granular and geo-textile filters. In this research, it represents the procedures to design ACB Mat to evaluate wave reflection and overtopping process. The results show that in increasing the relative freeboard with decreasing the overtopping discharge in the design.
Sengupta et al. (Citation2019) stated that the use of the Computational Fluid Dynamics (CFD) model (selecting the standard k–є model) is essential in the modified systems that have been designed. The modified systems are considered to be in two systems: one having a cylindrical boiling chamber (vessel) and the other one requiring a spherical boiling chamber (vessel). Those chambers are having a cocoon heating chamber that is connected with them. In the design systems, they are classified into two parts which are done on channel and nozzle type combustion chambers. Based on the analysis, the systems having cylindrical combustion chambers in which they are used in the silk production process are less effectual than the others in which having nozzle combustion chambers.
Boroomand and Mohammadi (Citation2019) stated that the simulation has been utilized using Fluent software on the offset jet phenomenon and their related issues. The jet is the resulting field that occurred in the case of flow inlet with a low thickness and high-velocity flow enter into the lower velocity. The jet can be classified as free jet and confined jets. The two categories of the jets are caused by the distance from the discharge to the limited boundary points. The offset jet depends on the boundary distance to the gap, and the jet extends toward the other boundary. The analyses have been done for the fluid flow in two cases: two- and three-dimensional finite volume method. The investigation of different models of turbulence k-ε is performed and the study also included the various boundary conditions, wall functions (standard and unbalanced wall functions), and other effective coefficients in the numerical model of the offset jet flow pattern. The results showed the attainable turbulent model is efficient for offset jet modeling and it can be utilized in correlated designs.
Lin (Citation2018) stated in his article that the ventilation technique is one of the systematic approaches used during the construction period in thelarge-scale infrastructures. Two stages of the construction ventilation system are utilized based on the completion status of shafts in the underground petroleum storage project which occurred in Jinzhou, China. In addition to the hypothetical investigation, numerical simulation using FLUENT software had been done in the first stage. The various outside temperatures in the construction ventilation system is studied to discuss the effect of ventilation performance. In the second stage of construction ventilation, the Gallery-type network ventilation technique (GNVT) is utilized. The traditional forced ventilation from the access tunnel has less performance than the GNVT. Detecting the ventilation effectiveness is performed with other properties. Based on the test results, the reduction coefficient of tunnel resistance is obtained from the tested wind speed, and anticalculated required airflow in the consideration of the super-large section. This research is useful for the construction of underground crude petroleum storage caverns, and it is considered as a case study for the construction ventilation technique. Finally, the difference between inside and outside temperature is used to save construction costs and develop energy-saving scheme.
3. Experimental side
3.1. Description
In the description part, the constructed quadrant mounted on a balance arm in which point’s edges correspond to the center of the arc of the quadrant is an essential section in the design of the center of the pressure apparatus. The moment about the knife-edge is provided by the hydrostatic force in which acts on the rectangular end face. Moreover, the balance arm has an amendable counterweight. It also has a balance pan for weights supplied (50, 75, and 100) g.
In the design of the center of pressure, a fabricated quadrant is attached to a balance arm, which pivots on knife-edges. The quadrant assemblage is fixed on top of an acrylic clear tank provided will level screws on its feet. The knife-edges coincide with the center of the arc of the quadrant. With the center of the arc of the quadrant, the knife edges coincide. The hydrostatic force is considered to be the only acted force on the quadrant in the case of immersion and acts on the rectangular end face in order to allow a rise to a moment about the knife-edges area. Moreover, an indicator mounted to the side of the tank shows when the balance arm is horizontal. The level of water is measured on a scale in which located on the side of the quadrant. Furthermore, using a flexible tube is utilized to admit water or any other fluid to the top of the tank and the drain off could be performed through a valve in the side of the tank.
Additionally, to assure the accuracy of the alignment, a spirit level is attached to the base of the tank. The reservoir tank could be filled with any type of fluid from the top and at the same time, the reservoir tank could be drained through a valve located at the side of the apparatus. On the side of the quadrant, there is a scale like a ruler to measure the level of water in the reservoir tank. Also, the measurement of the torque exerted by the hydrostatic thrust is indicated by the direct weighing. Investigations for the experiments could be implemented over a wide range of water levels or any other fluid level. Reading for the various heights of the water can be recorded in order to test the center of the pressure apparatus for demonstration. In Figure , it displays the hydrostatic pressure apparatus or the center of the pressure apparatus.
Figure 1. Hydrostatic pressure apparatus
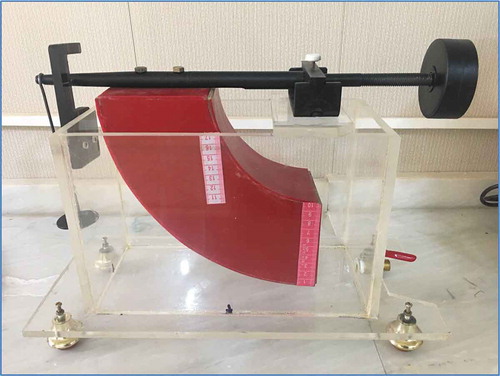
According to the center of pressure apparatus, the equipment specifications consist of: quadrant, reservoir tank, and balance arm. The quadrant material is from PVC with a total depth of quadrant, H (210 mm). Also, the height of the end surface is considered to be D is equal to (100 mm) and the width, B (80 mm). The reservoir tank is made from glass with a volume of 9.45 L. The overall dimensions of the tank are: (280 mm, length), (130 mm, width), and (height, 180 mm). Regarding the balance arm, the distance between suspended mass and fulcrum is considered to be (250 mm, length).
3.2. Experimental procedure
The procedure of the hydrostatic pressure apparatus can be listed as:
Set the center of the pressure device on top of a board.
The device should be set up properly as appeared in Figure .
Level the device using variable feet facilitate by the spirit level attached.
Adjust the counterbalance to set the balance arm to be in a horizontal position.
The drain cock should be locked. The water or any other kind of fluid should be added slowly into the reservoir tank until the fluid surface just touches the quadrant base. A datum level should be established corresponding to a zero at the level scale.
Put the first weight in which is equal to 50 g on the balance pan. Water or any other type of fluid should be added into the reservoir tank until the balance arm is to be in a horizontal position.
List the value of the mass (m) with the number immersed depth (d) as shown in Table , for partially submerged vertical plane.
Repeat the steps above (6 and 7 steps) in order to get more recording points for the heights of fluid in terms of trying various weights of mass. In general term, increasing inthe amount of weights until the tank is full, is essential to record the depth of immersion for a fully submerged vertical plane.
After the experiment is completed, drain off the water is attained for the next attempt.
This will be the end of the procedure.
Table 1. The formulas used for the hydrostatic pressure apparatus in the case for partially submerged vertical plane
Table 2. Experimental equations used for the fully submerged vertical plane
Table 3. The calculations for water for the partially submerged vertical plane
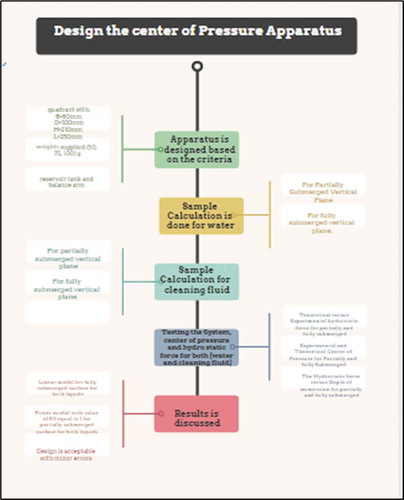
Based on the research methodology, the flowchart in Figure is performed in order to obtain the approach of the center of pressure apparatus with simple details for each process.
Figure 2. The flowchart of the methodology of the hydrostatic pressure apparatus
3.2.1. Sample calculation
Based on our design, the following criteria are needed:
B = 80 mm
D = 100 mm
H = 210 mm
L = 250 mm
For partially submerged vertical plane (as shown in Table ):
The measured moment (N.M) = m*g*L
The theoretical hydrostatic force (N) = ρ*g*
Experimental center of pressure (m) = h’’ = m*g*L/F
Theoretical center of pressure (m) = H-d/3
Experimental Hydrostatic force (N) = m*g*L/h’’
The calculated moment = hexp. * Fexp.
For fully submerged vertical plane (as shown in Table ):
The measured moment (N.M) = m*g*L
Theoretical hydrostatic force (N) = F =
Experimental center of pressure (m) = h’’ = m*g*L/F =
Theoretical center of pressure (m) = h’’ =
Theoretical hydrostatic force (N) = m*g*L/h’’
The calculated moment (N.M) = hexp.*Fexp.
3.2.2. Calculation for water
3.2.2.1. For partially submerged vertical plane
In Table , it is shown the calculations for water for a partially submerged vertical plane.
In Table , it is displayed the calculations for water for a fully submerged vertical plane.
Table 4. The calculation for water for the fully submerged vertical plane
3.2.3. Calculation for liquid (Cleaning fluid)
3.2.3.1. For partially submerged vertical plane
In Table , it is shown the calculations of cleaning fluid for a partially submerged vertical plane.
Table 5. The calculation of cleaning fluid for the partially submerged vertical plane
In Table , it is displayed the calculations of cleaning fluid for a fully submerged vertical plane.
Table 6. The calculation of cleaning fluid for fully submerged vertical plane
4. Results and discussion
4.1. Testing the system
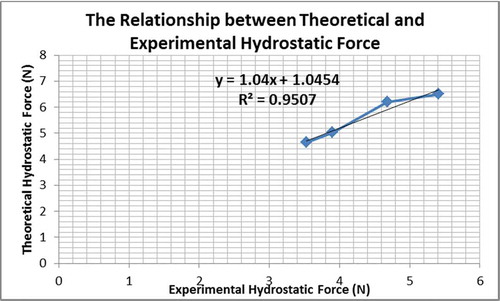
Based on Figure , it shows the relationship between theoretical and experimental hydrostatic force for a given mass. It is clear that there is a linear relationship between theoretical and experimental hydrostatic force for a partially submerged surface. Moreover, in Figure , it shows the theoretical versus experimental hydrostatic force relationship for a completely submerged area. It is obvious that there is a linear correlation between theoretical and experimental relationship. This relationship fits the force calculated from the hydrostatic force system for a fully and partially submerged surface. Thus, the calculated hydrostatic force is nearly identical to hypothetical force conforming to the used mass. Therefore, the calculated hydrostatic force by the pressure system is kind of precise. This relation fits the force measured from the hydrostatic pressure system with a value of R2 equal to 0.985 for partially submerged and with a value of 0.95 for fully submerged as well. Based on this analysis, the measured hydrostatic force is precise.
Figure 3. Theoretical versus experimental hydrostatic force for partially submerged
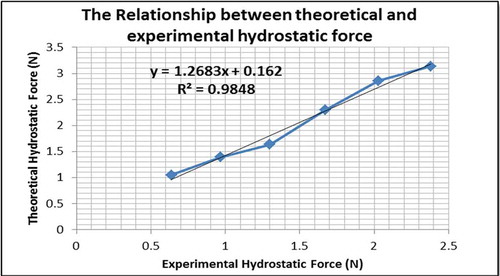
Figure 4. Theoretical versus experimental hydrostatic force for fully submerged
4.1.1. The center of pressure
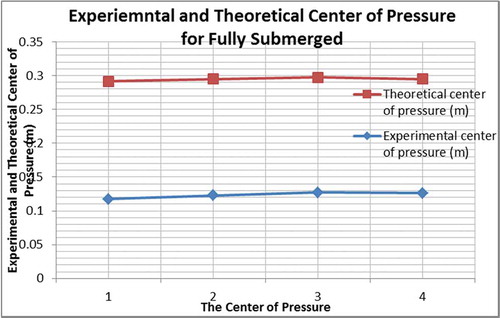
Based on our analysis, the distance to the center of pressure can be studied for both the partly submerged and completely submerged plane area. After that, the calculations for both the hydrostatic pressure force and distance to the center of pressure are accomplished. Form this once, the comparison between the theoretical values to the actual values is performed and the measurement for these values is completed. The present distinction between the measured and theoretic forces almost reached zero for all increments. In Figure , it shows the relationship between the depths to the center of pressure. It is obvious that the difference between the measured and theoretical center of pressure for partially submerged is 20%. Additionally, the relation between theoretical and measured center of pressure is investigated as shown in Figure . The present error between the theoretical and calculated center of pressure is 22% for a fully submerged surface. Based on the following data for both partially and fully submerged, it is obvious that they did have few discrepancies among the measured and theoretical center of pressure.
Figure 5. Experimental versus theoretical center of pressure for partly submerged
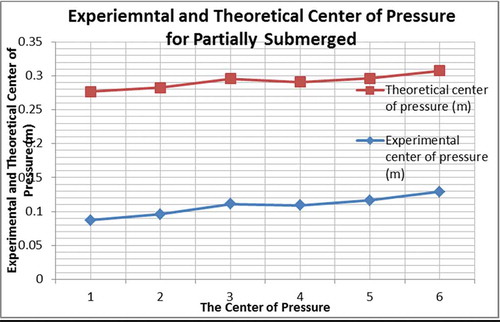
Figure 6. Experimental versus theoretical center of pressure for completely submerged
4.2. Hydrostatic force
As shown in the figure below (7), the relation between the immersed depth of and hydrostatic pressure for a partially submerged area is appeared. Clearly, there is increasing in the depth of water in the reservoir tank of the pressure system. Moreover, increase in the hydrostatic force on the vertical surface area of the quadrant is shown as well. Thus, there is a linear relationship between the height of water with the value of hydrostatic force. This model represents the relation between the measured height with a hydrostatic force. The height increases leading to cause an effect to increase as a result to the power relationship between variables. The R 2 value is equal to 1 with the power model. Thus, the regression model also supports the relation between hydrostatic force and the height as presented in the equation:
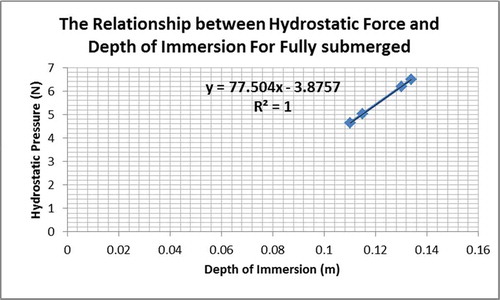
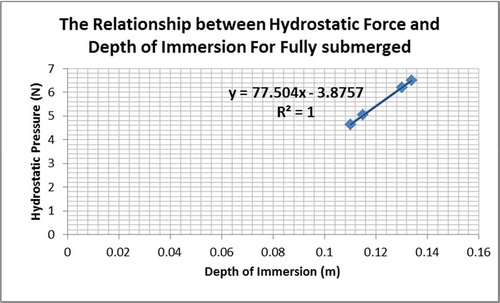
In Figure , it displays the relation between the hydrostatic pressure force and the immersed depth for a fully submerged surface. The model is linear and it fits the data with a value of R2 value is equal to 1 for a fully submerged surface. Thus, this model is also proportionate with the relation between the depths of water and the hydrostatic force in the equation below:
As exhibted in Figure , the hydrostatic force is growing gradually with the growth of the height of water in the chamber of the pressure system. Comparable outcome was seen in the study of slopes under drawdown conditions (Lane & Griffiths, Citation2000).
Figure 7. The hydrostatic force versus depth of immersion for partially submerged
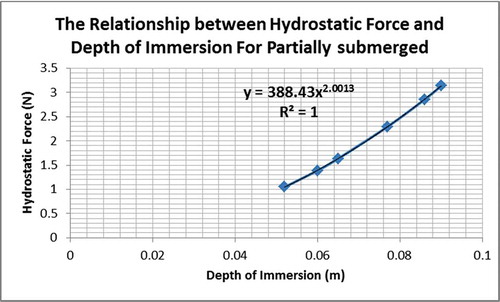
Figure 8. The hydrostatic force versus depth of immersion for fully submerged
4.3. Testing the system for cleaning fluid
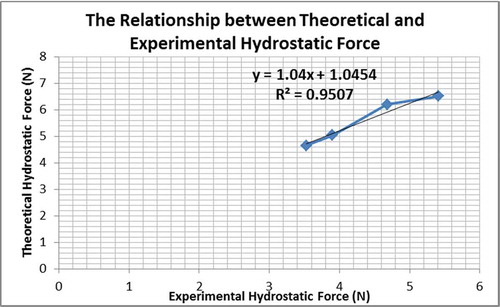
Based on the analyses, different fluids were tried to show the differences in several parameters in the case when the density of water is approximately 1000 Kg/m3. It has been replaced with a liquid that is cleaning fluid; its density is equal to 987.5 Kg/m3. Based on Figure , it displays the relation between theoretical and experimental hydrostatic force for the partially submerged surface. The fluid is a kind of cleaning fluid. The mass and weight density are various from the water. Thus, it is accurate that the results will be significantly different than the previous one. Because the properties of fluid such as mass density, weight density, viscosity, relative density, specific gravity, kinematic viscosity, and other criteria, the analysis could be various from one liquid to another. For both Figures and 1, which display the relationship between calculated and theoretical hydrostatic force for both partly and fully submerged area. The correlation is considered to be linear with a slope nearly reached to one for a partially submerged surface. Additionally, this correlation fits the force calculated from the hydrostatic pressure system with an R2 value of 0.9928 for partially submerged and 0.9507 for a fully submerged surface. Thus, the calculated hydrostatic force is nearly reached to the theoretic force in proportion to the given mass. As a result, the hydrostatic force calculated by the pressure system is precise. The calibration of the pressure system is not obligatory at all.
Figure 9. Theoretical versus experimental hydrostatic forces relationship for partly submerged surface
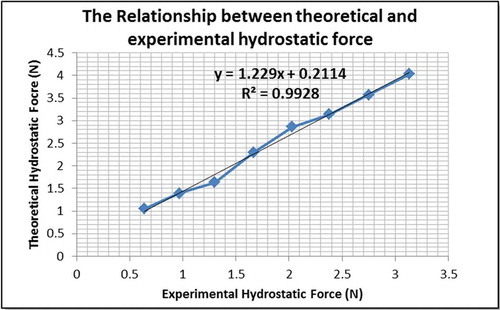
Figure 10. Theoretical versus experimental hydrostatic forces relationship for fully submerged surface
4.4. The center of pressure
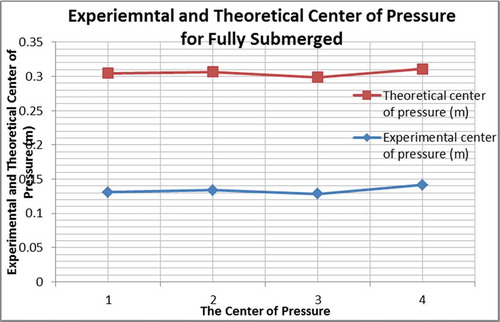
Based on Figures and 1, they display the relation between the theoretical and experimental center of pressure for both partly and fully submerged surface. Based on the analysis regarding the distance center of pressure, the theoretical hydrostatic force can be simulated. By collecting these data, the compassion could be made with the theoretical analysis based on the normal data. The present alteration can be determined. Therefore, the differences between experimental and theoretical depths to the center of pressure are 19% and 20%, respectively, for both partially and fully submerged surface plane. As a result, there is some inconsistency between the observed and theoretic depths to the center of pressure. The present errors of depths to the center of pressure ranged from 10% to 35%.
Figure 11. Experimental and theoretical center of pressure for partially submerged
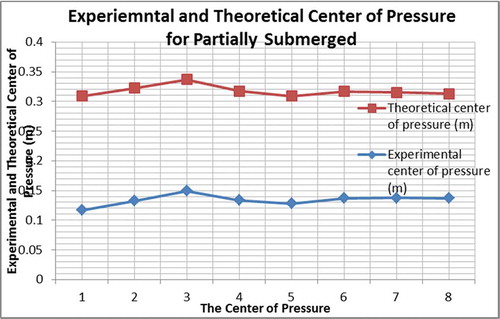
Figure 12. Experimental and theoretical center of pressure for fully submerged
5. Hydrostatic force
The graphs down below display the height of cleaning fluid for both partially and fully submerged surface plane. In Figure , it is clear that increase in the theoretical hydrostatic force also indicated an increase in the height of fluid. Additionally, a power model signifies the correlation between theoretical hydrostatic force and the measured height of fluid. The height of fluid increases due to the power relation with variables in which each little change would lead to the increasing in the number of hydrostatic force. The power regression model fits the data with the R2 values are equal to 1.
However, the relation between the theoretical hydrostatic pressure and the depths to the center of pressure for fluid is exhibited in Figure . This graph indicates the hydrostatic force versus the depth of immersion for a fully submerged surface. The model is a linear one with a value of R2 equal to 1. As shown in the figure below, an increase in the hydrostatic force indicates a steadily increasing in the measured height of fluid as represented in the pressure system.
Figure 13. Hydrostatic pressure force versus immersed depth relationship for partially submerged
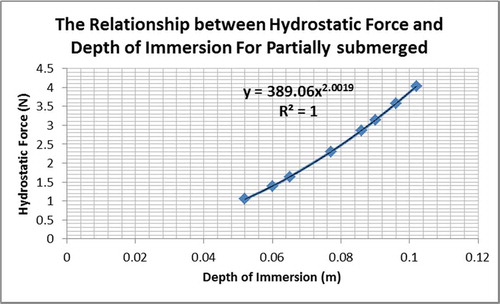
Figure 14. Hydrostatic pressure force versus immersed depth relationship for fully submerged
6. Conclusion and recommendation
The forces exerted due to the fluid are important to investigate and to make a special study to follow their effect especially when a plane area is submerged in a fluid. Thus, analyzing those forces in which develop on the surface due to the fluid is essential in the design of storage tank, weirs, and any type of hydraulic structures. Two phenomena occurred in dealing with the fluids sometimes fluid at rest and others fluids at moving. The force must be perpendicular to the surface since there are no shearing stresses present for the fluids at rest. If the fluid is incompressible, the pressure varies linearly with depths. For instance, in the calculation of the magnitude of the resultant force for a horizontal plane surface, the formula is considered to be: FR = pA where p is the uniform pressure on the bottom and A is the area of the bottom.
In this research, design a center of pressure apparatus with both submerged surface of plane and the fully submerged surface plane is performed with the demonstration for both cases. In conclusion, based on the analyses that have been done in this research, it represents the relationship between theoretical and experimental hydrostatic pressure for both partially and fully submerged surface plane. A linear model displays in this relationship for both partially and fully submerged surface plane. Moreover, the correlation between hydrostatic pressure force and mean depths for partly submerged surface plane shows a power model with R2 is equal to 1. Otherwise, the model is linear for the correlation between theoretical hydrostatic force and the average depths for a fully submerged surface.
In both water and cleaning fluid, the correlation between hydrostatic force and the depths of fluid height is considered to be a linear model for a fully submerged surface and a power model with a value of R2 equal to 1 for the partially submerged surface. Even with the differences in some properties between water and cleaning fluid, the results show no significant variety between the correlations between the depths of immersion with the theoretical hydrostatic force. Otherwise the chart of hydrostatic pressure and common depths for partly submerged is not appreciably linear for each water and fluid.
In addition, the theoretical hydrostatic pressure force in comparison to the measured hydrostatic pressure force becomes considerably comparable with apercentage error of 10%. In addition, the error in the distance to the center of pressure contrasted to the theoretic was considerably high with a present error of 20%. Thus, there is a percentage of error between the hypothetical and experimental center of pressure for both partially and fully submerged surface plane. Thus, the errors might be related to the measuring and reading, the errors in the level of the water, the error due to unbalanced weights.
Generally, the results appear to be likely with what was to be predicated. There is still some probability of the errors. It could be related to some variety of mistakes in the doing of the experimental parts of this study. For instance, it might be some human mistakes in the reading of the collecting data with balancing the bridge arm level with given mass. Thus, this could be leading to an inaccurate reading for fluid height. Moreover, the remaining calculated data will be imprecise based on the measured height of the fluid given either water or cleaning fluid. So, those human mistakes either in reading the measured height could be causing an effect in all succeeding calculations.
In the calculation of the experimental analysis, the causes of error do exist in the analysis in which might be related to the possibility for the fluid splashing onto the balance bridge arm while pouring. Thus, an increase in the artificial weight added to the weight in which performed due to the applied masses can be obtained related to these mistakes of errors in the performance of the design of this apparatus. Therefore, the hydrostatic force in the stabilizing to the mass moment might be falsely high and the depth of the fluid would be artificially high leading to a reading of the pressure system. The practical masses should be weighted before their implementation onto the balance bridge arm because of the increased in the wright of the applied masses due to the collection of oils from being handled. Therefore, this can cause a deceptively increasing in the applied masses in which they are recorded in which would cause enhancement in the height of fluid to be appeared too high. Thus, regarding these errors in which are considered to be minor errors even if they are present in this research, they have no effect or little effect on the results and the analysis during this design.
To sum up, more analysis is needed in order to investigate more different kinds of fluids. The design needs to be developed such as design a hydrostatic pressure apparatus with a hydraulic bench. By doing this, the same experimental process should be done and investigate the same parameter effect on the apparatus such as the correlations between the discharge and the time for the partially and fully submerged plane. It is essential to study various parameters on the apparatus such as the center of pressure, depth of immersion, theoretical, and experimental hydrostatic pressure.
A short summary about the author
This is a short summary in which the author (Nuralhuda Aladdin Jasim) uses her valuable enhancement in designing some hydraulic apparatus such as Reynolds Number apparatus, an open channel with hydraulic bench and hydrostatic pressure apparatus. The aim of the research is to design a center of pressure apparatus in order to determine the static hydrostatic force exerted by a fluid on a submerged surface. Moreover, it is allowed to make a comparison between the measured magnitude and position of the hydrostatic force with the simple theory. Thus, it is designed to determine the experimental and theoretical center of pressure and the resultant hydrostatic force applied on a submerged surface. The papers have been published depends on nanoparticles in which investigating the properties of natural organic matter (NOM) affect the impact of nanoparticles on plant. Also, she has designed a wastewater treatment plant in rural areas.
Acknowledgments
We thank the University of Babel for their support and guidance during our study and design. We acknowledge that our design is based on our idea and all data have been collected based on our design. Moreover, all data, models, and code produced during the study seem in the submitted article.
Data availability statement
All data, models, and code used during the study showed in the submitted article.
Additional information
Funding
Notes on contributors
Nuralhuda A. Jasim
Nurlhuda A. Jasim is an Assistant Lecturer in the college of engineering of civil engineering department at Wasit University in Iraq. She has been on the faculty at the Wasit University since 2016. She has her BS in Environmental Engineering from Al-Mustansiriyah University in 2010, and her MS in Environmental Engineering from SIUC (Southern Illinois University Carbondale) in United States of America in 2014. She has published more than 5 research articles in Cogent Engineering, Medwell Journal, IEEE, Key Engineering material (KEM) journal, and journal of water and environment technology. Her research interests include electrocoagulation, chemical coagulation, water resources, ANN analysis, GIS analysis, design wastewater treatment plant, GIS modeling, nanotechnology, nanoparticles dispersion, water treatment using natural coagulants, wastewater reuse, and others. Contact her at: [email protected].
References
- Armfield Limited. (2002). Instruction manual F1-16. BH24 1 DY England.
- Boroomand, M., & Mohammadi, A. (2019). Investigation of k-ε turbulent models and their effects on offset jet flow simulation. Civil Engineering Journal, 5(1), 127–21. https://doi.org/10.28991/cej-2019-03091231
- Cengel, Y. A., & Cimbala, J. M. (2014). In fluid mechanics fundamentals and applications (3rd ed.). McGraw-Hill Higher Education.
- Humpherys, A. S. (1991). Center-of-pressure gates for irrigation. Applied Engineering in Agriculture, 7(2), 185–192.
- Lane, P. A., & Griffiths, D. V. (2000). Assessment of stability of slopes under drawdown conditions. Journal of Geotechnical and Geo Environmental Engineering, 126(5), 443–450.
- Lin, F. (2018). Construction network ventilation system for underground LPG storage cavern. Civil Engineering Journal, 4(7), 1522–1541. https://doi.org/10.28991/cej-0309192
- Munson, B. R., Young, D. F., & Okiisshi, T. H. (1998). Fundamentals of fluid mechanics. John Wiley and Sons, Inc.
- Sengupta, A. R., Gupta, R., & Biswas, A. (2019). Computational fluid dynamics analysis of stove systems for cooking and drying of muga silk. Emerging Science Journal, 5(3), 285-292. https://doi.org/10.28991/esj-2019-01191
- Tadmor, R., & YadaV, P. S. (2007). As-placed contact angles for seessile drops. Journal of Colloid and Interface Sciense, 317(1), 241–246.
- White, F. M. (1999). Fluid mechanics. McGraw-Hill.
- Yamini, O., Kavianpour, M., & Mousavi, H. (2017). Experimental investigation of parameters affecting the stability of articulated concrete block mattress under wave attack. Applied Ocean Research, 64, 184–202. https://doi.org/10.1016/j.apor.2017.03.003
- Yamini, O., Mousavi, H., & Kavianpour, M. (2019). Experimental investigation of using geo-textile filter layer in articulated concrete block mattress revetment on coastal embankment. Journal of Ocean Engineering and Marine Energy, 5(1). https://doi.org/10.1007/s40722-019-00133-y