
 ?Mathematical formulae have been encoded as MathML and are displayed in this HTML version using MathJax in order to improve their display. Uncheck the box to turn MathJax off. This feature requires Javascript. Click on a formula to zoom.
Abstract
Understanding customer behaviour is crucial for business success. For achieving this goal, the Recency–Frequency–Monetary (RFM) model has been commonly recognised as an effective approach to analyse customer behaviour. However, the traditional RFM approach is a coarse method for quantifying customer loyalty and contribution that can only provide a single lump-sum value of the recency (R), frequency (F), and monetary value (M); hence, it discards information regarding customers’ product preferences. Typically, different customers make different purchases. Subsequently, purchases are likely to be different across customers. This creates data sparsity, which affects the performance of conventional clustering methods. In this study, we integrated the group RFM analysis and probabilistic latent semantic analysis models to perform customer segmentation and customer analysis. The results indicated that the developed approach takes into account the product preference and provides insight into and captures a wide variety of the types of true ordering behaviour of the company’s customers. The information allows the manager to improve customer relationships and build a personalised purchasing management system for grouping customers with similar purchasing patterns.
PUBLIC INTEREST STATEMENT
Understanding customer behaviour is essential for the businesses decision-making process. The RFM model is widely used to analyse customer behaviour. However, the traditional RFM only provides a single lump-sum value of the recency, frequency, and monetary value; hence, information regarding customers’ product preferences is discarded. Typically, different customers make different purchases. Subsequently, the purchases are likely to be different across customers. This creates data sparsity, which affects the performance of conventional clustering methods. In the present study, we integrated the group analysis and PLSA models to perform customer segmentation and customer analysis. The results indicated that the developed approach takes into account the product preferences and provides insight into and captures a wide variety of the types of true ordering behaviour of the company’s customers. This information allows the manager to improve customer relationships and build a personalised purchasing management system for customers with similar purchasing patterns.
1. Introduction
Understanding customer behaviour is crucial in business endeavours, as it can help businesses satisfy consumer expectations. Customer behaviour can cause a company to succeed or fail. Thus, insight into customer behaviour can be useful in developing a company’s marketing and operation strategy for satisfying customer requirements. Additionally, identifying customer behaviours plays a significant role in understanding factors that cause customers to buy a particular product. According to the wide varieties of products and customer needs, it is important to assess customer behaviours prior to releasing a product to the market. These problems are prevalent in the pork processing industry. Hundreds of customers order various products, which can be classified into different main meat cuts (i.e. ham, shoulder, collar, loin, tenderloin, belly, spare rib, and by-products). Additionally, the products are available in various sizes. A customer order may span many product categories. Customer segmentation (as related to product characteristics and the production process), is important for a company’s management, e.g., launching marketing strategies for each customer cluster and establishing customer priority to allocate products when the supply is insufficient to fulfil all the orders.
In a procurement system, product orders are converted into the number of live pigs required for each pig size. Fattening farms with pigs of the required sizes are then selected for harvesting. Prior to the harvesting, the pig sizes on each farm are primarily estimated using the ages of the pigs and the feed consumption. For pork processors in Thailand, the supply of live pigs to the plant typically does not satisfy the demand, because of two important factors. First, the pig size is not uniform for each farm; i.e. each farm has a distribution of sizes, and a single farm may have various pig sizes. Thus, the plant may not obtain a sufficient number of pigs of the required size from harvesting a set of farms. Second, the plant manager may not slaughter sufficient pigs to fill all the orders. All the meat cuts are co-products. One pig provides two pieces of each of the main meat cuts. For example, slaughtering 100 large pigs produces 200 large pieces of ham, shoulder, collar, loin, tenderloin, belly, and spare rib. To fill the orders for 200 large-sized ham and 300 large-sized shoulder products, 150 large-sized pigs should be procured and slaughtered, which results in an inventory of 100 large-sized hams. This inventory adds to the plant costs, because the product is perishable and requires temperature-controlled storage. To avoid such an inventory, a decision maker may decide not to satisfy all the orders; i.e. some orders may be delayed or undergo product substitutions. To maximise customer satisfaction during supply shortages, a company first attempts to fill the important customers’ orders. Currently, customer priority is based on the experience of the decision maker. Among the investigations to minimise the total inventory cost and to maximise the profit for multi-category products in supply chains, the following recent studies are highlighted. Sarkar and Giri (Citation2020) developed a two-echelon supply-chain model with a single buyer and a single vendor under stochastic demand. Gharaei et al. (Citation2020) extended the three-level supply-chain model to an integrated multi-product four-level supply chain with a joint economic lot-sizing policy under the stochastic condition. Hoseini Shekarabi et al. (Citation2019) modelled a multi-product, multi-wholesaler, multi-level, and integrated supply chain under conditions of a shortage and limited warehouse space. Kazemi et al. (Citation2018) presented an inventory management policy for items that considers the imperfections (quality) and emissions. Gharaei et al. (Citation2019a) developed an optimal replenishment policy for a multi-products inventory system by considering the quality control and green eco-friendly production policies. Gharaei et al. (Citation2019b) developed a multi-product, multi-buyer supply-chain model under penalty, green, and quality control policies and a vendor-managed inventory with a consignment stock agreement. Additionally, with the goal of inventory system management for real-world conditions, Gharaei et al. (Citation2020) proposed a realistic Economic Output Quantity (EPQ) model. The overall inventory cost and the profit function in a multi-product EPQ model were defined and optimised by taking into account the faulty products. They also developed a bi-objective EPQ model with defective and good items to determine the number of shipments and the quantity of each product shipment. Giri and Masanta (Citation2020) developed a closed-loop supply-chain model with price- and quality-dependent demand and learning in production in a stochastic environment. They considered a closed-loop supply chain with two suppliers, one manufacturer, and one retailer. The manufacturer produces a single product from fresh raw materials and used items collected by the retailer. Masoud et al. (Citation2020) presented a multi-period, multi-product model for the location–allocation supply-chain problem under different factors, e.g., customers, vehicle fleet technologies, and environmental and social impacts.
The obtained group information is useful in the formulation of proper promotion strategies for pricing policies to increase the customer response rate and the business profit. To obtain insight into the customer segmentation and analysis, several relevant studies were systematically reviewed. For example, Fang et al. (Citation2016) proposed a profitability model based on Big Data analytics considering the customer purchasing behaviour and foreseeable future cash flow in the insurance industry. Additionally, Tsai et al. (Citation2017) developed a shopping behaviour prediction system based on moving patterns and product characteristics indicating suitable strategies for an individual customer to increase profit. Another relevant study was conducted by Holý et al. (Citation2017), which was related to product categorisation based on customer behaviour using only market basket data. Finally, Wang and Tseng (Citation2015) work, which proposed the Naïve Bayes classifier-based approach for matching the customer requirements to existing products, provided a good foundation for this study. The literature review indicated that the proposed method provides a better understanding of customer preferences and requirements than previously reported methods, which can lead to marketing opportunities for companies.
The problem of identifying high-response rate customers for product promotion can be solved via both statistical and non-statistical methods (e.g., data-mining technology), including Recency–Frequency–Monetary (RFM) analysis, k-means clustering, classification and regression trees, logistic regression, supervised and unsupervised neural networks, support vector machines, finite mixture models, the Bernoulli–Gaussian mixture model, and the Naïve Bayes classifier (Calvet et al., Citation2016; Chen et al., Citation2007; Durango-Cohen et al., 2013; Wang & Tseng, Citation2015). RFM analysis—a widely used customer segmentation method—employs three variables, i.e. consumption recency (R), frequency (F), and monetary value (M), to model customers’ purchasing behaviour and evaluate their loyalty, contribution, and buying potential (Chang & Tsai, Citation2011). Because of its simplicity and reasonable performance, the RFM model is widely used to analyse customer behaviour (Chan et al., Citation2011; Coussement et al., Citation2014; Ha et al., Citation2002; McCarty & Hastak, Citation2007; Wu & Chou, Citation2011). However, the traditional RFM model is limited and has several significant disadvantages for application to customer or market segmentation (Coussement et al., Citation2014; Han et al., Citation2014; McCarty & Hastak, Citation2007). For example, Singh and Singh (Citation2016) reported that the weights are arbitrarily assigned in the traditional RFM approach and that the approach does not account for the risk of customers being inactive. Hence, Singh and Singh (Citation2016) suggested using data environmental analysis and the probability of being active, probability of reaching the minimum sales level required by the firm, and regularity of purchases to create an index called the risk-adjusted RFM. In our paper, we address the RFM approach for companies that offer a wide variety of products. For the multiple-product case, the traditional RFM only provides lump-sum evaluation indices, which are inaccurate in quantifying customer loyalty and contribution. The proposed model analyses customer behaviour for a whole category rather than for an individual product. The traditional RFM model analysis, not including consideration in each category, is based on the total purchase volume. As shown in , elaboration traditional RFM analysis assumes that there are transaction records of five customers. Each transaction consists of purchased items and monetary expenses. Examining the traditional RFM values for each product and the total purchase expense reveals that customers differ significantly in purchasing these products. Hence, using a lump-sum evaluation index is likely to categorise customers into different groups rather than considering it product-by-product. For considering the product category, Chang and Tsai (Citation2011) developed a group RFM (GRFM) framework to identify potential customers according to their purchases by hierarchically transforming purchased data into categories, applying constrained clustering to categories of purchased products, and obtaining the RFM value from the categories. Although this approach can reveal the true buying behaviour by deeply analysing and utilising the RFM value of the customer according to their purchased items, considerable computation effort is required to transform purchased data into similar purchased patterns. Additionally, because the method of Chang and Tsai (Citation2011) clusters customers according to their purchased items, a customer may be allocated to more than one cluster. Although allocating a customer to more than one cluster may be convenient when reviewing purchased items, in other circumstances, each customer belonging to one cluster may facilitate strategy execution. Chang and Tsai (Citation2011) carefully constructed an algorithm to transform the purchased data into categories and then cluster data with similar purchased records into groups. One reason is to avoid data sparsity problems. As shown in , typically, a customer may purchase some of the products but not all. Thus, the product purchase differs across customers. In this case, data sparsity occurs when only a small fraction of the items in any given row are nonzero or non-null. Consequently, the performance of conventional clustering methods for customer segmentation and analysis is affected. Without data sparsity, we could have used RFM values for each product as attributes to directly cluster customers.
Table 1. Example of five customers based on RFM values for overall and each product categories
Data sparsity is a common problem in text processing for text mining. Text data are typically high-dimensional and sparse. To address data sparsity in text mining, the probabilistic latent semantic analysis (PLSA) model, which was originally developed by Hofmann (Citation1999, Citation2001) is commonly used. Recently, the PLSA model has been successfully applied to various fields, e.g., image learning and quality assessment (Fernandez-Beltran & Pla, Citation2018), facial recognition (Zhou et al., Citation2019), topic modelling (Li et al., Citation2018; X. Wang et al., Citation2019), a movie recommender system (Huang et al., Citation2019), unsupervised mining of long time series (J. Wang et al., Citation2013), and fuzzy co-clustering and cluster splitting characteristics (Goshima et al., Citation2018). Therefore, the main objective of the present study was to investigate a customer segmentation and characteristic analysis approach for multi-category products in which the GRFM and PLSA methods are used for solving data sparsity problems.
2. Proposed methodology
In this study, a methodology is developed for segment-level customer behaviour analysis based on buying-data sparsity for multi-category products in the pork industry. For retaining the dynamic nature of the customer behaviour, this study is based on the GRFM model, and dataset segmentation principles are followed in accordance with the PLSA approach. The proposed methodology contains preprocessing, modelling, evaluation, and analysis phases. The preprocessing step focuses mainly on building a customer order corresponding to the RFM attributes for each multi-category product for each customer. The modelling and evaluation phase deals with two main decisions, including the selection of appropriate segments. In the analysis phase, the proposed methodology is applied to a case study. The detailed procedures of the methodology are described throughout this section.
2.1. Probabilistic latent semantic analysis (PLSA)
The PLSA model was originally used to find topics in a document: in this section, PLSA is adapted to the aforementioned problem of customer segmentation. More details on the PLSA model can be found in in Hofmann (Citation1999, Citation2001), Chen et al. (Citation2008), Lu et al. (Citation2010), Goshima et al. (Citation2018), J. Wang et al. (Citation2013), X. Wang et al. (Citation2019), and Zhou et al. (Citation2019).
Suppose the company contains N customers and M products, which are denoted by and
, respectively. The customer order data are then summarized in an
co-occurrence matrix
Each matrix element,
, is represented by the RFM score of the product pj for customer ci. There are also K hidden (latent) classes or group variables
which are associated with each occurrence of a product pj for customer ci. The customer order information can be used to determine the probability, P(ci), that customer i places an order, which is used to estimate the probability P(pj) that a product j is ordered; however, the probability
that customer ci exhibits features zk and the probability
that a product feature zk corresponds to a product pj are unknown. shows the graph of the aspect model.
Figure 1. Proposed methodology
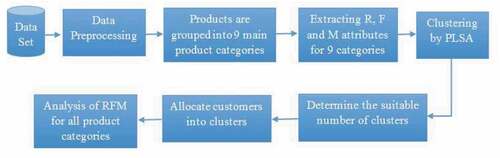
Figure 2. Graph of the aspect model
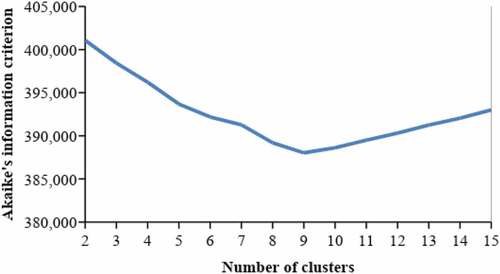
Figure 3. AIC values versus the number of clusters
The joint probability of customer ci and product pj (i.e., P(pj, ci)) can be expressed by EquationEquation (1)(1)
(1) . EquationEquation (2)
(2)
(2) describes the probability that product pj is ordered if customer ci places an order.
Substituting EquationEquation (2)(2)
(2) into (1) yields
As in Lu et al. (Citation2010)’s study, the observation pairs are assumed to be generated independently; the log-likelihood function can then be obtained from EquationEquations (4)
(4)
(4) and (Equation5
(5)
(5) ) given below:
The parameters and
can be estimated using expectation maximization (EM) to maximize the log-likelihood function. The EM algorithm consists of two steps, E and M.
In the E-step, the posterior probability is calculated for the latent variables using Bayes’ formula, resulting in EquationEquation (6)(6)
(6) :
In the M-step, the parameters are updated based on the expected complete data log-likelihood, which depends on the posterior probability calculated in the E-step (Chen et al., Citation2008). This probability is given by EquationEquations (7)(7)
(7) and (Equation8
(8)
(8) ):
The E and M steps are iterated to increase the likelihood function. The procedure is terminated when the specific conditions are met.
Thus, the EM algorithm estimates the model parameter values that maximize the likelihood of the observed data and returns appropriate probability distributions that can be used in the PLSA model.
2.2. Data description
The data used in this study were collected from a pork slaughtering house of a leading agriculture company in Thailand. There were 71,088 records of customer order data for 487 customers. The products are grouped into nine main product categories, including ham, tenderloin, loin, collar, shoulder, belly, spare rib, by-products and trimming meat. The nine product categories are used to analyze the purchasing/ordering behavior of the customers.
2.3. Novel approach
The GRFM and PLSA methods are used to develop a customer segmentation methodology for the pork processor case study. The proposed methodology can be broadly divided in 5 steps as shown in . The procedure is given below.
Step 1: Preprocess data
Preparing and preprocessing data are important processes for knowledge discovery in a database. In this step, the records of all of the orders are classified into nine product categories. Next, the recency (how long ago has the product been ordered for the last time), the average frequency (an average number of purchasing orders per month) and the average monetary values (an average of purchasing expenditure per order) are calculated for a customer in each product category.
Step 2: Assign R-F-M scores for 9 categories
In this step, scores are assigned to the recency (R), frequency (F) and monetary (M) values of a customer in each product category. The score scale ranges from 1 to 5. Scores “1” and “5” correspond to the largest and smallest contributions to the company revenue, respectively. The values of the data set are scored from 1 to 5 by sorting the original RFM values for all of the categories in descending order. Next, the RFM values in each category are divided into 5 equal parts. The values in the top 20% of the data set are given scores of 5, and the values in the next highest 20% of the data set are assigned scores of 4. The other scores (i.e., 3, 2 and 1) are similarly assigned. presents RFM criterion for all product categories. provides examples of RFM scores for various customers.
Table 2. RFM value criterion for all product categories
Table 3. P(Zk|Ci) matrix elements for 9 customer clusters
Step 3: Obtain L and
The RFM scores from the previous step are used to determine the variables L and using the PLSA model (EquationEquations (1)
(1)
(1) —(Equation8
(8)
(8) )), where k is the number of clusters.
Step 4: Determine the suitable number of clusters (K)
Generally, the number of clusters for a given data set is not known a priori. The Akaike information criterion (AIC) equation is used to determine the suitable number of clusters (K):
where L denotes the log-likelihood value, K denotes the number of clusters, and n and m are the number of parameters in the model. Normally, n and m are the numbers of rows and columns, respectively. In this study, the rows correspond to the customer numbers (i.e., n = 487), and m represents the number of features (i.e., m = 27 = 9 product categories x 3 R-F-M features). The suitable K value is that which provides the minimum AIC value.
Step 5: Allocate customers into clusters
In this step, the value of is used to allocate all of the customers into clusters. A customer ci is assigned to the cluster k with the highest
value.
3. Results and analysis
3.1. Customer clusters
The optimum number of clusters was determined using the AIC model. shows the AIC values for different cluster numbers ranging from 2 to 15. The results indicate that the lowest AIC value is obtained for nine clusters (k = 9), which is the optimum number of clusters in the case study. Examples of matrix elements obtained for nine customer clusters are presented in . The matrix elements indicate the probabilities of a customer belonging to each cluster. For example, the probabilities that customer N01 belongs to clusters 2, 3, 4, 8, and 9 are 0.10, 0.24, 0.13, 0.29, and 0.24, respectively. As the highest probability for customer N01 corresponds to cluster 8, customer N01 is considered to belong to that cluster.
3.2. Customer group description
After the customers are divided into nine clusters, the RFM analysis is performed to evaluate the customer value and define the group description in each segment.
In this process, the ↑ sign represents the status of a group with an RFM average that is higher than the average value for all the customers. The ↓ sign represents the status of a group with an average R-F-M value that is lower than the average value for all the customers (Ha, Citation2007; Ha & Park, Citation1998). The three R-F-M values correspond to segmenting the customers into eight (23) possible segments. For example, “R↑F↑M↓” signifies that the average M-value for this customer segment is lower than the total average M-value, whereas the R and F values are higher than the average R and F values for all the customers, respectively. In accordance with the works of Ha (Citation2007) and Ha and Park (Citation1998), these eight customer segments are denoted as follows: (1) valuable customers (R↑F↑M↑, VC), (2) shoppers (R↑F↑M↓, SH), (3) potential customers (R↑F↓M↑, PC), (4) new customers (R↑F↓M↓, NC), (5) churn customers (R↓F↑M↑, CC), (6) frequent customers (R↓F↑M↓, FC), (7) spenders (R↓F↓M↑, SP), and (8) uncertain customers (R↓F↓M↓, UC).
presents the results for the RFM pattern in each product category. These tables present the number of customers allocated to each customer cluster; the average actual values; the average R, F, and M scores; the RFM pattern; and the customer type. For example, for the ham product category, there are 58 customers in cluster 1. This cluster has average actual recency, frequency, and monetary values of 6.88 unit time, 21.95 times, and 4965.03 unit costs, respectively. The average R, F, and M scores for this cluster are 4.48, 2.88, and 2.5, respectively. This customer cluster is classified as the shoppers (SH) type because its average R and F scores are higher than the average R and F scores for all the customers (i.e. 4.48 > 4.17 and 2.88 > 2.01), but its average M score is lower than the total average (i.e. 2.5 < 2.78).
Table 4. Customer segments based on RFM values of the all product category
presents all the product categories. For example, the customers belonging to cluster 9 are valued customers for the ham, loin, shoulder, and belly categories and are the most valued customers considering all the product categories. presents the results for the case where the individual product categories are not considered. The solutions for these two scenarios (presented in ) are clearly different. More information is provided by the solutions in than for the solutions in . The information obtained using the developed method () can be used to identify the characteristics of each group and to capture a wider variety of the types of true ordering behaviours of the customers (compared with the case where the product category is not considered). This information can be used by plant managers to measure the loyalty and contributions of a customer segment for each product category, allowing them to develop better production and marketing strategies.
Table 5. Customer segments for all of the product categories
Table 6. Customer segments without considering product categories
3.3. Managerial implications
The main objective of this study was to provide decision support models for the environmentally responsible decision-making process in multi-category products under different customer demand patterns. The key objective in marketing is to increase the number of customer orders and persuade customers to spend more money on a company’s products; thus, information such as that presented in can help a company to formulate a marketing plan. The marketing plan can be designed for a specific customer cluster, a specific product, or a customer group for a specific product. For example, the customers in cluster 8 are considered to be churn customers in the shoulder product category (see ). These customers have high frequency and high monetary values in the shoulder product category but have not placed orders for a long time. Something may have gone awry with these groups of customers. The company can develop strategies for motivating these customers to purchase more shoulder products by launching a promotion on shoulder products for this group only. In the collar product category, none of the clusters have any valued customers. The company may need to tune its marketing plan to increase sales in this product category. Thus, the customers in cluster 9 exhibit a high potential to become valued customers in many product categories. Appropriate marketing strategies can increase the sales to and loyalty of this group of customers.
The information can also be used in order allocation to ensure customer satisfaction when the supply of specific meat cuts is insufficient to fill all the customer orders. A company typically caters to its highest-priority customers first. The information obtained from the model can help a decision maker to prioritise the company’s customers for specific product categories. For example, consider that there are 94, 350, 494, 362, and 230 live pigs of the extra small, small, medium, large, and extra-large sizes, respectively, which are supplied from contract farms to the processing plant. After the pigs are slaughtered and processed, the plant obtains 188, 700, 988, 724, and 460 pieces of each meat cut (i.e. ham, loin, and shoulder) in extra small, small, medium, large, and extra large sizes, respectively. We further assume that seven customers (N01–N07) have placed orders for extra large-sized ham, loin, and shoulder pieces, as shown in . There are 460 pieces of pork product available for each of the three meat cuts, resulting in a supply shortage. The decision maker must decide how to allocate the available products to these customers. The information in can be used to make this decision. Let us consider the ham product category. The highest-priority customers in allocating the orders should be customers N05 and N06 from the valued segment in this product category. After the N05 and N06 orders are filled, the remaining 20 pieces of available ham should be allocated to customer N01 from the shopper segment. The remaining customer orders should be delayed or substituted with other meat cuts, if this is an acceptable solution to the customers. The other products (i.e. the loin and the shoulder) can be managed using a similar strategy.
Table 7. Examples of customer orders
4. Conclusion
This study presents an approach for customer segmentation and characteristic analysis based on the GRFM values and the PLSA model. Historical data from the company were transformed into RFM scores, which were used in the PLSA model to cluster customers into specific product categories. Because the analysis takes into account the probability of purchasing items, it provides better insight into the customers’ preferences and captures a wider variety of the types of true ordering behaviours of the customers as a group than the traditional RFM analysis. This information can also be used in market planning and to determine the customer priority for each product category to increase company profits and customer satisfaction. Moreover, the company can develop effective strategies by measuring the loyalty and contributions for each segment to improve their customer relationship management, which can result in a competitive advantage. Additionally, the model framework can be applied to other businesses for the same purposes.
Acknowledgements
This work was financially supported by the Thailand Research Fund (TRF) and the Office of the Higher Education Commission [grant No. MRG6080180]. The authors also acknowledge Betagro Science Center Company Limited for assistance in collecting data, providing invaluable guidance and making this work possible.
Additional information
Funding
Notes on contributors
Arthit Apichottanakul
Arthit Apichottanakul is currently working as lecturer in the Faculty of Technology, Khon Kaen University, Thailand. He completed his PhD in Industrial Engineering from Khon Kaen University, Thailand. His current research interests include intelligent applications, optimization and data science in logistics and supply chain management.
Masayuki Goto
Masayuki Goto is a professor in the Department of Industrial Management and Systems Engineering, School of Creative Science and Engineering, Waseda University, Japan. His current research interests include data science, business analytics, machine learning, and Bayesian statistics.
Kullaprapruk Piewthongngam
Kullaprapruk Piewthongngam is a professor in the Faculty of Economics, Khon Kaen University, Thailand. Her current research interests include intelligent applications, optimization and agribusiness supply chain management.
Supachai Pathumnakul
Supachai Pathumnakul is a professor in the Department of Industrial Engineering, Faculty of Engineering, Khon Kaen University, Thailand. His current research interests include optimization and data science in logistics and supply chain management.
References
- Calvet, L., Ferrer, A., Gomes, M. I., Juan, A. A., & Masip, D. (2016). Combining statistical learning with metaheuristics for the multi-depot vehicle routing problem with market segmentation. Computers & Industrial Engineering, 94, 93–22. https://doi.org/10.1016/j.cie.2016.01.016
- Chan, C. C. H., Cheng, C. B., & Hsien, W. C. (2011). Pricing and promotion strategies of an online shop based on customer segmentation and multiple objective decision making. Expert Systems with Applications, 38(12), 14585–14591. https://doi.org/10.1016/j.eswa.2011.05.024
- Chang, H. C., & Tsai, H. P. (2011). Group RFM analysis as a novel framework to discover better customer consumption behavior. Expert Systems with Applications, 38(12), 14499–14513. https://doi.org/10.1016/j.eswa.2011.05.034
- Chen, Y., Tsai, F. S., & Chan, K. L. (2008). Machine learning techniques for business blog search and mining. Expert Systems with Applications, 35(3), 581–590. https://doi.org/10.1016/j.eswa.2007.07.015
- Chen, Y., Zhang, G., Hu, D., & Fu, C. (2007). Customer segmentation based on survival character. Journal of Intelligent Manufacturing, 18(4), 513–517. https://doi.org/10.1007/s10845-007-0059-z
- Coussement, K., Van den Bossche, F. A. M., & De Bock, K. W. (2014). Data accuracy’s impact on segmentation performance: Benchmarking RFM analysis, logistic regression, and decision tree. Journal of Business Research, 67(1), 2751–2758. https://doi.org/10.1016/j.jbusres.2012.09.024
- Durango-Cohen, P. L., Durango-Cohen, E. J., & Torres, R. L. (2013). A Bernoulli-Gaussian mixture model of donation likelihood and monetary value: An application to alumni segmentation in a university setting. Computers & Industrial Engineering, 66(4), 1085–1095. https://doi.org/10.1016/j.cie.2013.08.007
- Fang, K., Jiang, Y., & Song, M. (2016). Customer profitability forecasting using Big Data analytics: A case study of the insurance industry. Computers & Industrial Engineering, 101, 554–564. https://doi.org/10.1016/j.cie.2016.09.011
- Fernandez-Beltran, R., & Pla, F. (2018). Sparse multi-modal probabilistic latent semantic analysis for single-image super-resolution. Signal Processing, 152, 227–237. https://doi.org/10.1016/j.sigpro.2018.05.026
- Gharaei, A., Hoseini Shekarabi, S. A., & Karimi, M. (2020). Modelling and optimal lot-sizing of the replenishments in constrained, multi-product and bi-objective EPQ models with defective products: Generalised cross decomposition. International Journal of Systems Science: Operations & Logistics, 7(3), 262–274. https://doi.org/10.1080/23302674.2019.1574364
- Gharaei, A., Hoseini Shekarabi, S. A., Karimi, M., Pourgavad, E., & Amjadian, A. (2019a). An integrated stochastic EPQ model under quality and green policies: Generalized cross decomposition under the separability approach. International Journal of Systems Science: Operations & Logistics. https://doi.org/10.1080/23302674.2019.1656296
- Gharaei, A., Karimi, M., & Hoseini Shekarabi, S. A. (2019b). An integrated multi-product, multi- buyer supply chain under penalty, green, and quality control polices and a vendor managed inventory with consignment stock agreement: The outer approximation with equality relaxation and augmented penalty algorithm. Applied Mathematical Modelling, 69, 223–254. https://doi.org/10.1016/j.apm.2018.11.035
- Gharaei, A., Karimi, M., & Hoseini Shekarabi, S. A. 2020). Joint economic lot-sizing in multi- product multi-level integrated supply chains: Generalized benders decomposition. International Journal of Systems Science: Operations & Logistics,7(4), 309-325. https://doi.org/10.1080/23302674.2019.1585595
- Giri, B. C., & Masanta, M. (2020). Developing a closed-loop supply chain model with price and quality dependent demand and learning in production in a stochastic environment. International Journal of Systems Science: Operations & Logistics, 7(2), 147–163. https://doi.org/10.1080/23302674.2018.1542042
- Goshima, T., Honda, K., Ubukata, S., & Notsu, A. (2018). Deterministic annealing process for pLSA-induced fuzzy co-clustering and cluster splitting characteristics. International Journal of Approximate Reasoning, 95, 185–193. https://doi.org/10.1016/j.ijar.2018.02.005
- Ha, S. H. (2007). Applying knowledge engineering techniques to customer analysis in the service industry. Advanced Engineering Informatics, 21(3), 293–301. https://doi.org/10.1016/j.aei.2006.12.001
- Ha, S. H., Bae, S. M., & Park, S. C. (2002). Customer’s time variant purchase behavior and corresponding marketing strategies: An online retailer’s case. Computers & Industrial Engineering, 43(4), 801–820. https://doi.org/10.1016/S0360-8352(02)00141-9
- Ha, S. H., & Park, S. C. (1998). Application of data mining tools to hotel data mart on the Intranet for database marking. Expert Systems with Applications, 15(1), 1–31. https://doi.org/10.1016/S0957-4174(98)00008-6
- Han, S., Ye, Y., Fu, X., & Chen, Z. (2014). Category role aided market segmentation approach to convenience store chain category management. Decision Support Systems, 57, 296–308. https://doi.org/10.1016/j.dss.2013.09.017
- Hofmann, T. (1999). Probabilistic latent semantic indexing. Proceedings of the 22nd annual international ACM SIGIR conference on research and development in information retrieval (pp. 50–57). ACM.
- Hofmann, T. (2001). Unsupervised learning by probabilistic latent semantic analysis. Machine Learning, 42, 177–196. https://doi.org/10.1023/A:1007617005950
- Holý, V., Sokol, O., & Černý, M. (2017). Clustering retail products based on customer behaviour. Applied Soft Computing, 60, 752–762. https://doi.org/10.1016/j.asoc.2017.02.004
- Hoseini Shekarabi, S. A., Gharaei, A., & Karimi, M. (2019). Modelling and optimal lot-sizing of integrated multi-level multi-wholesaler supply chains under the shortage and limited warehouse space: Generalised outer approximation. International Journal of Systems Science: Operations & Logistics, 6(3), 237–257. https://doi.org/10.1080/23302674.2018.1435835
- Huang, L., Tan, W., & Sun, Y. (2019). Collaborative recommendation algorithm based on probabilistic matrix factorization in probabilistic latent semantic analysis. Multimedia Tools and Applications, 78(7), 8711–8722. https://doi.org/10.1007/s11042-018-6232-x
- Kazemi, N., Abdul-Rashid, S. H., Raja Ghazilla, R. A., Shekarian, E., & Zanoni, S. (2018). Economic order quantity models for items with imperfect quality and emission Considerations. International Journal of Systems Science: Operations & Logistics, 5(2), 99–115. https://doi.org/10.1080/23302674.2016.1240254
- Li, N., Luo, W., Yang, K., Zhuang, F., He, Q., & Shi, Z. (2018). Self-organizing weighted incremental probabilistic latent semantic analysis. International Journal of Machine Learning and Cybernetics, 9(12), 1987–1998. https://doi.org/10.1007/s13042-017-0681-9
- Lu, Z., Peng, Y., & Ip, H. H. S. (2010). Image categorization via robust pLSA. Pattern Recognition Letters, 31(1), 36–43. https://doi.org/10.1016/j.patrec.2009.09.003
- Masoud, R., Hosseini-Mokhallesun, S. A. A., Ordibazar, A. H., & Farrokhi-Asl, H. (2020). A hybrid robust possibilistic approach for a sustainable supply chain location-allocation network design. International Journal of Systems Science: Operations & Logistics, 7(1), 60–75. https://doi.org/10.1080/23302674.2018.1506061
- McCarty, J. A., & Hastak, M. (2007). Segmentation approaches in data-mining: A comparison of RFM, CHAID, and logistic regression. Journal of Business Research, 60(6), 656–662. https://doi.org/10.1016/j.jbusres.2006.06.015
- Sarkar, S., & Giri, B. C. (2020). Stochastic supply chain model with imperfect production and controllable defective rate. International Journal of Systems Science: Operations & Logistics, 7(2), 133–146. https://doi.org/10.1080/23302674.2018.1536231
- Singh, S., & Singh, S. (2016). Accounting for risk in the traditional RFM approach. Management Research Review, 39(2), 215–234. https://doi.org/10.1108/MRR-11-2015-0272
- Tsai, C. Y., Li, M. H., & Kuo, R. J. (2017). A shopping behavior prediction system: Considering moving patterns and product characteristics. Computers & Industrial Engineering, 106, 192–204. https://doi.org/10.1016/j.cie.2017.02.004
- Wang, J., Sun, X., She, M. F. H., Kouzani, A., & Nahavandi, S. (2013). Unsupervised mining of long time series based on latent topic model. Neurocomputing, 103, 93–103. https://doi.org/10.1016/j.neucom.2012.09.008
- Wang, X., Chang, M.-C., Wang, L., & Lyu, S. (2019). Efficient algorithms for graph regularized PLSA for probabilistic topic modeling. Pattern Recognition, 86, 236–247. https://doi.org/10.1016/j.patcog.2018.09.004
- Wang, Y., & Tseng, M. M. (2015). A Naïve Bayes approach to map customer requirements to product variants. Journal of Intelligent Manufacturing, 26(3), 501–509. https://doi.org/10.1007/s10845-013-0806-2
- Wu, R. S., & Chou, P. H. (2011). Customer segmentation of multi category data in e-commerce using a soft-clustering approach. Electronic Commerce Research and Applications, 10(3), 331–341. https://doi.org/10.1016/j.elerap.2010.11.002
- Zhou, D., Yang, D., Zhang, X., Huang, S., & Feng, S. (2019). Discriminative probabilistic latent semantic analysis with application to single sample face recognition. Neural Processing Letters, 49(3), 1273–1298. https://doi.org/10.1007/s11063-018-9852-2