
 ?Mathematical formulae have been encoded as MathML and are displayed in this HTML version using MathJax in order to improve their display. Uncheck the box to turn MathJax off. This feature requires Javascript. Click on a formula to zoom.
Abstract
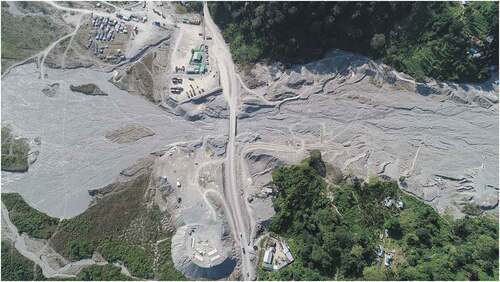
The research area falls at the downstream level of Bhalujhora landslide area in Alay which is located in Pasakha, Bhutan. Local Government authority proposed for construction of custom station between the commercial town Phuentsholing and Pasakha Industrial estate. However, downstream region which connects the core town to industrial estate are severely affected by the flash floods every year and the runoff causes huge sediment deposits leading risk for community and substantial damages to the infrastructures. The site is seasonally eroded and subsequently deposited by the sediments from upstream. Although, the formation level for infrastructure are proposed on the deposit layer, the assessment of soil parameters is necessary for design and planning to ensure the overall safety and long-term economic benefits. Through this study, the subsurface soil parameters are assessed by in-situ open pit investigation, geophysical survey and Standard Penetration Test (SPT), while the engineering properties of the sediment deposits were determined from laboratory tests. The field investigation was important to decide the suitability of foundation type and depth. Further, soil parameters were determined to classify the soil type, understand permeability characteristics, and predict shear strength parameters and compaction behaviour. The result shows that the sediments consist of mixture of natural aggregates and sand mixed with silt and clay. An estimate of sediment accumulation was carried out to determine the volume of the sediment deposited. The outcome will allow the relevant stakeholders to decide the management of the risk from this future disaster and propose alternative use of the sediment materials in road works.
PUBLIC INTEREST STATEMENT
Geotechnical investigation is conducted to assess the subsoil characteristics for infrastructure development projects in the study area. The investigated physical and mechanical parameters are mainly required for design of foundations, retaining structures and site development works. This study assures safety and economic benefit in long run in terms of functional and structural stability which may be caused due to deformation or settlement of subsoil and risk associated to natural hazards. Also, this geotechnical investigation will ensure precautions to minimize damages, cost savings and reduce frequency of future repair and maintenance. This geotechnical investigation will form a part of Detail Project Report (DPR) for strategic planning, technical feasibility and suitability of the area which is a pre-requisite in construction industry. The experimental results and quantity estimate of sediment deposit will allow the relevant stakeholders to propose alternate use of the sediment in road works.
1. Introduction
Soil settings of an area have a crucial role in construction of the building. Evaluation of the engineering properties of the subsoil at the project site is important for the generation of appropriate input data for the design and construction of foundations for the proposed structures, according to various researchers (Laskar & Pal, Citation2012; Oke & Amadi, Citation2008). The proper design and implementation of civil structures avoid an adverse effect on the environment or structural damage or post—project problems (Ngah & Nwankwoala, Citation2013; Oghenero et al., Citation2014; Youdeowei & Nwankwoala, Citation2013). In this regard, the data about the surface and sub-surface features is important for structural design and construction planning. The objective of this study is to determine the long-term structural safety of the infrastructures, since the proposed site is earmarked for development of land custom station which will cater to the major export and import transaction between the third country and the largest industrial hub of Bhutan—Pasakha. However, the site is characterized by layers of sediment deposit due to monsoon flash floods and runoff from upstream landslide () which requires appropriate engineering intervention to assess the sub-soil conditions and to further analyze the soil parameters for the use in planning and design. For geotechnical engineers such deposits are extremely challenging to deal with. Construction of the custom office on the deposited site requires information of the geotechnical conditions. When the bases of any building are founded on compressible earth, this results in settling. Awareness of the pace at which soil contraction occurs is crucial from proposed design. Soil properties such as plasticity, compressibility or soil hardness often influence building design. During the monsoon season, the area along the Pasakha highway in Phuentsholing outnumbers the frequency of landslide compared to any other regions in the country, therefore alarming the local municipal authority. Soil erosion during monsoon and fragile geology of the region are the main causes of landslides. In 1999, a slope failure occurred in Bhalujhora, Pasakha which consequently caused significant damage to agricultural lands and disrupting transportations network within the localities (Chettri, Sarkar et al., Citation2019). One of the significant factors for the rise and fall of the frequency of natural disasters is the existence of an interaction between the physical environment and socio-economic conditions (Mata-Lima et al., Citation2013). Transportation of sediment is generally a combination of fluid movement where the sediments are under the action of gravity or they are entrained. Catastrophic failure of buildings located near the coastal area is one of the effects of this problem (Zawawi et al., Citation2019). Ali and Fakhraldin (Ali & Fakhraldin, Citation2016) analyzed the behaviour of sediments under the action of structural loading in order to save costs of design and construction, after conducting a parametric study on sediments to prognose the geotechnical properties, subsurface materials’ nature and stratigraphy. For geotechnical engineers and geologists, the site investigation is the most important aspect of the work; without an accurate depiction of the sub surface conditions and the geology of the site, subsequent analysis is an assumed work (Tempa et al., Citation2016). In this study, soil parameters were extracted from geotechnical site investigation (GSI) using trial pits sampling and geophysical methods and the laboratory tests of the collected soil samples from the study location. The quantified and detailed information of the parametric analyses and statistical inference are presented in this paper. Statistical analysis of the rainfall pattern of the study area was conducted using 24 years of precipitation data (1996 to 2019) and quantity of sediment deposit were estimated.
2. Study area
The total population of Phuentsholing city in 2017 is 27,658 considering 3% growth rate and 30,518 considering 5% growth rate from 2012. Based on the land use pattern, the population of Pasakha in 2017 is 10,124 with the growth rate of 3% to 5% per year, in average of 4% annually (Phuentsholing Thromde, Citation2002).
Figure 1. Location of the study area: (a) Phuentsholing, Chhukha, Bhutan; (b) Location of trial pits for study area
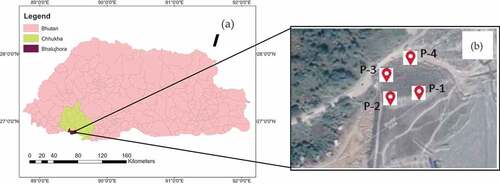
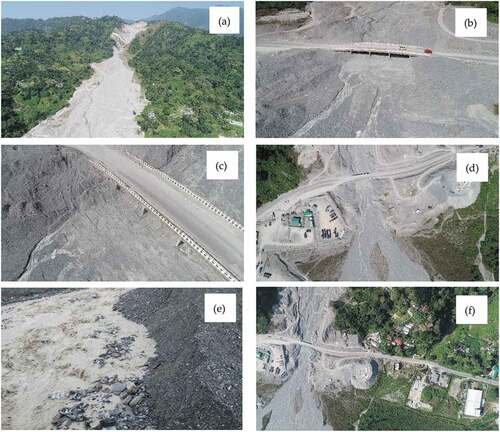
Figure 2. Pictorial representation of study area: (a) Upstream hill, (b) Near bridge sediments, (c) Downstream sediments, (d) Proposed area for developmental activities, (e) Runoff and sediment deposit and (f) Existing road infrastructure and settlements
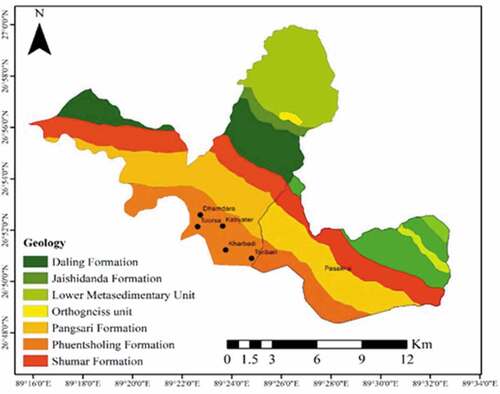
The study area stretches along with the Buxa group of Lesser Himalayan towards the Greater Himalayan rocks. The geology of the study area is presented in . The area considered falls in the structurally fragile crystalline weak sheet of bed rock mostly comprising paragneiss, quartzite, schists of Precambrian, orthogneiss and early Paleozoic ages and Miocene leucogranitic intrusions.
The bordering geology to the study area consists of different aged Tethyan sediments (Paleozoic to Eocene) predominated by limestone, shales and sandstones (Dini et al., Citation2019). These ideally mimic the fragile phyllite and quartzite that easily disintegrates during rainy season. Predominantly, Carbonaceous phyllite is the dominant rock type in the area followed by variegated phyllite and a thin band of greenish grey quartzite which gives rise to reddish brown to greyish brown residual soil (Department of Geology and Mines, Citation2010).
Figure 3. Geological setting of study region (Tempa et al., Citation2020)
3. Methodology
In the present study for assessing the surface and sub-surface soil geophysical setting to establish the custom station Open pit investigation, Standard Penetration Test (SPT), geophysical survey, laboratory test of soil properties () and measurement of sediment volume were carried out (). The location of four trial pits for geotechnical investigation of properties of the sediments is presented in . The detailed examination of the conditions of underlying soil and rocks for shallow depth can be performed through trial pits and trenches at relatively low cost.
Figure 4. Methodology adopted
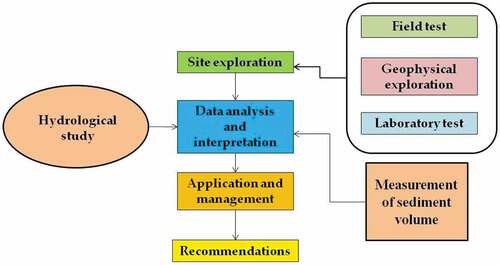
Table 1. Summary of in situ tests, sampling methods used and geophysical tests performed at the research site
3.1. Open pit investigation
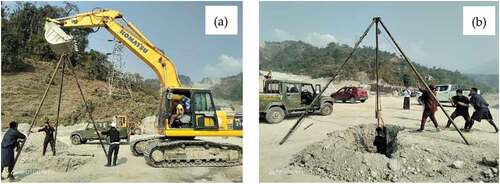
Exploration pits are considered as integral part of geotechnical investigation for exploring and sampling the significant variations in soil conditions that takes place either in vertical and horizontal direction. The detailed examination of the soil and rock conditions at shallow depths at relatively low cost can be performed by examining through open trial pits () and trenches. Moreover, it can also be extended to materials like debris, cobbles and boulders (non-soil) which cannot be sampled with conventional method. Soil profile is the natural strata below the ground surface which represents the alteration in the soil material as a result of numerous weathering processes (Chettri et al., Citation2019).
The open pits were excavated with mechanical equipment (backhoe). Investigation through open pit was carried out to study the nature of soil deposit along the depth below the ground surface which indicates the shallow soil profile (). This has allowed investigator to assess the suitability of the foundation depth as well as study the indication of presence of any water table at the investigated depth. To ensure that the uniform horizon of the depsosit was lifted each time during excavation, the bottom of the pit was kept relatively levelled. The excavated material for each level was stacked separately on the surface, in an orderly manner to identify the depth, against the adjoining pit which were used for sampling and conducting laboratory test. The sides of the pits were vertically and horizontally maintained so as to achieve a clean face of soil profile or rock face, if any.
Table 2. Location of the test pits
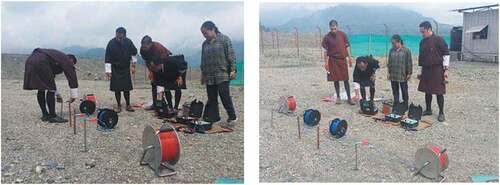
3.2. Standard penetration test (SPT)
The SPT test is one of the reliable in-situ tests used to measure penetration resistance which can be used for geotechnical design purposes (IS: 2131–1981). SPT was carried out at 2.0 m depth at two test pits where major structures are proposed and the no. of blows/penetration resistance value (N-value) was recorded (). The field N-values are further applied for overburden pressure correction to get the corrected value Ncor.
Figure 5. Field test by SPT in test pits P-2 and P-3; (a) Installation of SPT test; (b) Conduction of SPT test at pit
Since, there was no indication of ground water table, depth of water table was considered to be at a greater depth (Water table depth > B), hence effect due to water table on bearing capacity was neglected. SPT test is usually carried out to determine the resistance to penetration of the bearing soil. Penetration resistance is further used to compute the bearing capacity of soil at an identified location. The bearing capacity is determined based on the lower SPT test value at pit P-4 considering the worst-case scenario. Based on the corrected N-value, the angle of internal friction is estimated using Meyerhof, 1943 (Ranjan & Rao, Citation2000) (). Bearing capacity factors are based on ϕ-value proposed by Peck, Hanson and Thornburn, 1974 (Ranjan & Rao, Citation2000).
To account the shear criteria for non-cohesive soil, the Terzaghi’s ultimate bearing capacity is used for strip foundation (EquationEquation 1(1)
(1) ).
Where = γDf is overburden pressure (kN/m2), Nq and Nγ are bearing capacity factors (after Peck, Hanson and Thornburn, 1974), γ = bulk unit weight of soil (kN/m3), B = width of the footing (m) and corresponding ϕ = 30° (worst condition of pit P-3 and P-4). The bearing capacity factors are estimated to be Nq = 8.5 and Nγ = 15. The safe bearing capacity were obtained by applying factor of safety 3.0 as per IS code.
Similarly, the settlement criteria were checked as per Peck, Hanson and Thornburn (Oke & Amadi, Citation2008) with the following EquationEquation 2(2)
(2) .
Where qa-net = allowable bearing pressure (kN/m2), Cw is correction factor for water table position and Sa as recommended by IS code is the permissible settlement (25 mm for RCC structures) (Ranjan & Rao, Citation2000).
3.3. Geophysical survey
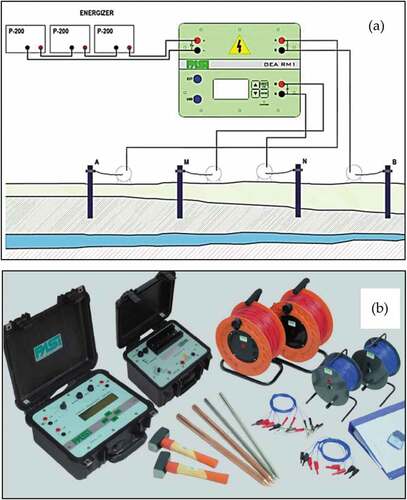
The study location was explored through geophysical survey to determine geological stratigraphy using Electrical Resistivity Tomography (ERT, Electrical Imaging) technique (). There are several geophysical investigation methods available based on different equipment and working principles to assess various physical properties (Tempa et al., Citation2020). For this study, the surface electrical resistivity method was used. Surface electrical resistivity survey works on the principle of potential gradient. The electrical resistivity of soil or rocks and their distribution decides on how the electrical potential in the ground around a current-carrying electrode is distributed. Four electrodes were pegged in the ground, where two were supplied with direct current (DC) while the difference of potential between the other two was measure. As depicted in , the potential electrodes were arranged in line between the current electrodes. Other than direct current, commutated direct current (a square-wave-alternating current) or alternating current of low frequency (typically about 20 Hz) can also be used.
Figure 6. (a) Schematic diagram of the electrical resistivity technique; (b) Electrical resistivity meter RM1 used for site exploration (https://www.pasisrl.it/)
Schlumberger Array-based system is followed for the electrode arrangement sequence which is pictorially depicted in . To investigate resistivity variation with depth, the electrode sizes can be changed. As the electrodes’ spacing is increased, the depth (material volume) largely increases which affects the apparent resistivity. Thus, vertical variations in resistivity can be inferred from a plot of apparent resistivity against electrodes’ spacing. Schlumberger Array system is most commonly used.
Figure 7. Schlumberger array
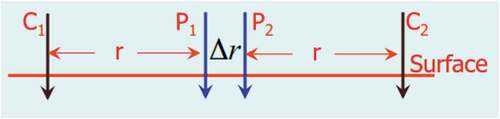
For this arrangement, as ∆r approaches zero, potential gradient at the midpoint of the array can be quantified by the value of V/∆r. The ratio of “r” to ∆r is limited, in practice, by the sensitivity of the instrument and it usually ranges from 3 to 30. Therefore, knowing the potential (v), current (I) and resistivity of medium, the geometric factor can be computed using EquationEquation 3(3)
(3) and a finite electrode spacing (Keller & Frischknecht, Citation1982).
Where, V is the potential difference between two potential electrodes (P1 and P2), ρ is the resistivity of the medium (i.e soil or rock strata or water table in the current case), I is the current flowing from electrode C1 to C2) and 1/K is the array geometric factor based on various electrode spacing among C1P1P2C2.
In the scenario, whereby the measurements are made over a real heterogeneous earth or the soil mass with varying depth, the symbol ρ (EquationEquation 3(3)
(3) ) is replaced by ρa for apparent resistivity. These enable the geotechnical engineer to have proper demarcation of anomalies subsurface strata. Therefore, equation in terms of apparent resistivity (ρa) is given by following EquationEquation 4
(4)
(4) .
The apparent resistivity () is given by EquationEquation 4
(4)
(4) :
Where, r = spacing between current electrode to potential electrode (i.e C1 to P1 or C2 to P2), ∆r is the spacing between potential electrode, V is the potential difference between two potential electrode and I is the current between current electrode (C1 and C2).
During the operations, the potential electrodes are fixed at a position and the current electrodes are positioned varying the distance “r” as per Schlumberger array. During the measurement, the spacing ∆r is changed decreasing sensitivity is observed. The spacing ∆r must always be smaller than 0.4s otherwise the assumption of potential gradient becomes invalid. The “r” must be held constant while the spacing between electrodes (∆r) needs to be changed, so as to find out the presence of local non-homogeneities or lateral changes in the vicinity of the inner electrodes. The electrical resistivity test was conducted along the stretches of sediments as highlighted in . Pre-feasibility studies were also conducted before the real field test.
Figure 8. Electrical resistivity test in the study site of Pasakha
3.4. Laboratory tests
For analysing the suitability of the study area for the construction of custom office laboratory test of soil properties was done. In , details of tests and testing method in laboratory are mentioned.
Table 3. Summary of laboratory tests performed on samples
3.5. Determination of sediments volume
Nowadays, sediment erosion is a global concern for researchers around the globe. Mohsen & Abayati (Mohsen & Abayati, Citation2009) suggested multifarious techniques to executive the process involve in the prediction of sediments transport and accumulation. 1D and 2D models are commonly used for predicting the sediment scour and deposition. Those models are adequate for many engineering applications; however, for some problem, only a three-dimensional model should be used. Several baseline studies have been carried out for determining the sedimentation rate out of which universal soil loss equation (USLE) is most common due to its simplicity. The main problem with USLE was that it was based on empirical erosion data collected from relatively small area giving results for limited situations (Kitahara et al., Citation2000). Revised version known as RUSLE Model was developed which could also incorporate GIS into the process of finding the sediments. It is commonly used and accepted model to predict the average soil erosion rate of area of interest (Gaubi et al., Citation2017). The RUSLE is expressed as shown in EquationEquation 5(5)
(5) .
where,
A = Average annual soil loss (metric tons Km−1year−1)
R = Rainfall/runoff erosivity (MJ mm h−1Km-1year−1)
K = Soil erodibility (metric tons Km−1MJ−1mm−1)
LS = Slope Length and Steepness Factor (Dimensionless)
C = Cover & management factor (Dimensionless: 0–1)
P = Support practice factor (Dimensionless: 0–1)
Source: Environmental GIS: Lab 10
Rainfall (R) plays a significant role in the process of runoff and it represents the relation between precipitation occurring over an area and its runoff potential. It is the product of the annual sum of the rainfall energy and the maximum 30-min rainfall intensity in each rainfall event of greater or equal to 13 mm per hour (Kitahara et al., Citation2000). Due to unavailability of 30-min rainfall data for the study area, alternative formulas developed by Jain et al., (2001) were used for computing R-factor for this study (EquationEquation 6(6)
(6) ). K factor represents the soil susceptibility to erosion (Cassol et al., Citation2018) and the amount and rate of runoff (Ashiagbor et al., Citation2012). It depends on the texture of soil, presence of organic matter, structure soil and permeability. The K factor is calculated using EquationEquation 8
(8)
(8) .
The Slope Length and Steepness Factors (LS) represents erodibility due to combinations of slope length and steepness relative to a standard unit plot. It expresses the effect of topography, specifically hill slope length and steepness on soil erosion. The slope length factor (L) is defined as the distance from the source of runoff to the point where either deposition begins or runoff enters a well-defined channel that may be part of a drainage network. On contrary, the steepness factor (S) reflects the influence of slope steepness on erosion. An increase in hill slope length and steepness results in an increase in the LS factor (Wordofa, Citation2011). These two factors are sometimes combined as single index (LS) known as topographic factor. Digital Elevation Model (DEM) is used to calculate the LS factor by most researchers, however, for the current study, field measurement (topographic survey) is done to obtain the parameters required in the Wischmeier’s formula and validation was done in Arc GIS. The modified equation for computing the topographic factor (LS factor) in GIS environment is employed by the formula recommended by (Wischmeier and Smith, 1978) in EquationEquation 6(6)
(6) .
Where ℓ is the cumulative slope length in feet (field measured); β is the downhill slope angle (field measured); m is a slope contingent variable; 0.5 if the slope angle is greater than 2.86 (Wordofa, Citation2011). The Arc GIS program that calculates the LS values requires a DEM coverage (90-meter resolution obtained from National Centre of Hydrology and Meteorology, NCHM) and two input values: the cell resolution units (feet or meters) and the cutoff slope angle required for identifying cells with net deposition rather than erosion. It is to note the limitation of the DEM resolution i.e. DEM resolution and accuracy increase, the landscape will be more accurately described and erosion estimates will approach actual values. Therefore, authors opted to scope out the same study in future with greater accuracy with the availability of input data. Cell size is the size of the cells being used in the grid-based representation of the landscape. Finally, the LS factor was derived using the above formula in ArcGIS spatial analysis raster calculator function.
The Cover and Management Factor, C is used in reflecting cropping and management practices’ effect on erosion rates and is used to make comparison of relative impacts of management options on mitigation plans. The C factor in landslide prone areas (as in the case of the current study area) is 0.0350 (Gaubi et al., Citation2017). The support practice factor, P is the ratio of soil loss with a specific support practice to the corresponding loss with upslope and downslope tillage (Dutta, Citation2016). A low P-factor (approaching 0) indicates effective conservation practices, while a high P factor (approaching 1.0) indicates ineffective conservation practices. As per the interviews with the locals it was found out that the entire-affected areas were once used for the agriculture. The area consists of an average slope percentage between 30°- 40° hence, the interpolated value of P = 0.25 is assigned to it (Wischmeier & Smith, Citation1978). For water bodies it is assigned P-value of 0 and other land use type P value is assigned 1. As RUSLE Model gives the gross soil erosion, and hence brief analysis is done using SDR. Sediment Delivery Ratio (SDR) is a fraction of gross erosion that is transported from a given area in a given time interval. It is also referred to as a transmission coefficient; fraction of gross soil erosion by water that is delivered to a particular point in the drainage system (Ouyang et al., Citation2005). In the current study the total soil loss from hill side was calculated based on field data collected. However, with the decrease in the velocity of runoff along the slope some sediments are deposited along the sediments channel and does not reach the slope end. Therefore, the actual sediments deposit was calculated analytically and compared with the empirical formula given by Vanoni (EquationEquation 7(7)
(7) ).
Where, RN = mean annual rainfall (mm). In the current study highest annual mean rainfall is taken as 6699 mm for the year 1998. Therefore, K factor can be calculated using the soil erodibility nomograph solution proposed by Wischmeier and Smith (1978) where the detail soil parameters are required as shown in EquationEquation 8(8)
(8) :
where,
M = particle size diameter
a = % organic matter
b = the soil-structure code used in soil classification, and
c = the profile-permeability class
These parameters are obtained by doing laboratory test and field test described in the paper. The product of all the factors (EquationEquation 5(5)
(5) ) will give the estimated total soil erosion in the catchment area hence sediment loss at each grid/cell can be deducted (Department of Engineering Services, Citation2020).
4. Results
The occurrence of the significant variation of soil conditions (horizontally and vertically), buried features and existence of huge soil and/or non-soil materials like boulders and debris, that cannot be sampled with conventional methods can be substantially determined by the trial pits (Mayne et al., Citation2002). Two open pit investigation was carried out at trial pit P-1 and P-2 and SPT test at test pit P-3 and P-4. The open pit investigation was carried out to a depth of 3.0 m below the formation level to determine the stratigraphy of the soil to ascertain the condition of the subsoil, material composition and relative density. Pit loggings were recorded and the soil samples were collected for laboratory analysis. Thus, the integral part of assessment of true character of a soil is through its soil profile, wherein there is a display of a succession of layers. Although various properties like color, texture, structure, biological composition, porosity, organic matter content, consistency and constitution of chemical may vary in those various layers. Unlike borehole and drill-hole investigation, the structure and stratification of the underlying ground can be seen and logged in 3D () with trial pitting method.
4.1. Textural characteristics of soil profile
Open pit investigation through open pit was carried out for analyzing the nature of soil deposit at different depth below the surface which indicates the shallow soil profile. For analyzing the suitability of the establishment of building as well as foundation depth on the deposited landform particularly, in the mountainous region it very essential to investigate subsurface soil condition and water table.
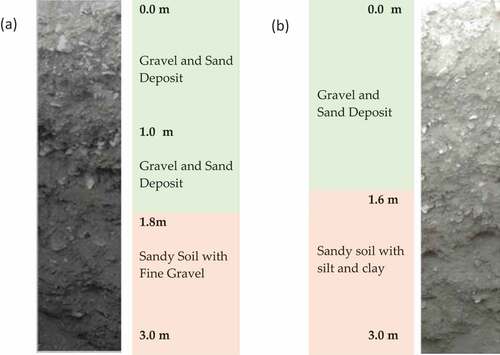
From open pit investigation, for test pit 1, up to 1.0 m depth the soil consists of mostly gravel with substantial amount of sand. Between 1 and 1.8 m, the soil consists of substantial amount of gravel and less amount of sand while from 1.8 to 3.0 m, the soil is sandy with some amount of gravel fractions. Similarly, for test pit P-2, up to 1.6 m the soil is mostly gravel with good amount of sand and between 1.6 to 3.0 m, the soil is mostly sand with some fractions of gravel. The actual distribution of the particles in each pits are discussed in section 4.4.2.
Figure 9. Soil profile/stratigraphy at trial pit P-1 and P-2 respectively
4.2. Penetration resistance/bearing capacity
SPT test was carried out for measuring the penetration resistance of the soil to establish a construction in the study site. In this test to estimate the ultimate bearing capacity, the basic equation proposed by Terzaghi (Ranjan & Rao, Citation2000) is used and settlement criteria are verified by using correlation proposed by Peck, Hanson and Thornburn (Ranjan & Rao, Citation2000) for permissible settlement of 25 mm for RCC structures as recommended by IS: 1904–1986 (Ranjan & Rao, Citation2000). The safe bearing capacity are further calculated by applying factor of safety (FoS) of 3.0 as suggested by IS code. The graphical representation of the results is presented in . For any infrastructure development, assessment of foundation subsoil becomes important in determining the safe bearing capacity and foundation depth. The safe bearing capacity of the subsoil decides the proportioning of the size and type of the footing to be proposed. shows the relationship between the footing width and the safe bearing capacity of the subsoil for the study area. The results indicate the increase in the bearing capacity as the width of the footing increases. In structural design for the footing, the ultimate design load is utilized, however it should not exceed the load-carrying capacity () corresponding to safe bearing capacity of the subsoil for required width of the footing. This has a direct cost and safety aspects of the foundation of the proposed project. The overburden correction for N-vales at 1.65 m embedment depth and corresponding angle of friction are presented in .
Figure 10. (a) Safe bearing capacity; (b) Load carrying capacity
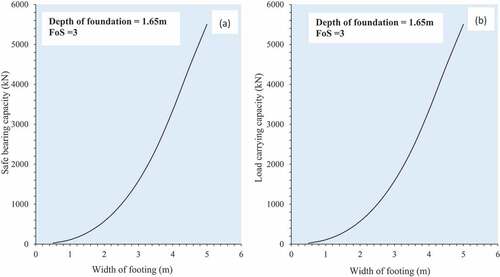
Table 4. Overburden correction to “N-values” filed value and corresponding angle of internal friction
4.3. Depth-wise resistance of soil
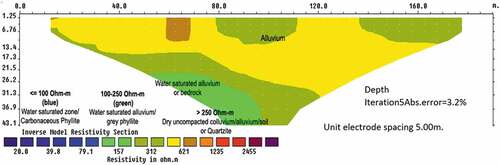
shows the result of the resistivity survey. The profile is located along the Phuentsholing- Pasakha highway at Bhalujhora adjacent to new bridge constructed by Construction Development Corporation Limited in 2019 which is currently covered by sediments. The depth of investigation is about 43.1 m with the profile length of 200 m. This is achieved by maintaining spacing of electrodes as 10 m. From , the results indicate the deposition of huge quantity of sediments (around 31.3 m) of alluvium typically of quartzite which are prone to erosion. Pockets of phyllite deposition are present along with the horizontal profile (80–120) m and in 160 m. A layer of phyllite was also detected beneath the quartzite deposition till the depth of 43.1 m. The phyllite layer is dissolvable, when water seeps during monsoon creating a huge plunge over the surface which is further filled by upcoming sediments.
Figure 11. Resistivity profile of the study area
4.4. Laboratory tests
Various tests were conducted in the laboratory to determine the physical properties of the sediment. All tests comply with the Indian standard IS codes.
4.4.1. Specific gravity
Specific gravity is the ratio of the weight of a given volume of material to the weight of an equal volume of water (at 20°C). The specific gravity indicates how much heavier (or lighter) the material is than water according to IS: 2720 (Part 3- section 2)-1980. Specific gravity is an integral gravimetric property useful for determining various soil properties such as the void ratio, unit weight, degree of saturation and most importantly the porosity of the soil. It can also be used in wet analysis for determining particle size. Thus, specific gravity of soil should be precisely determined. The Pycnometer method was adopted for determining specific gravity of soil for fraction passing 4.75 mm I. S. sieve and results are presented in .
Table 5. Physical properties of soil deposit
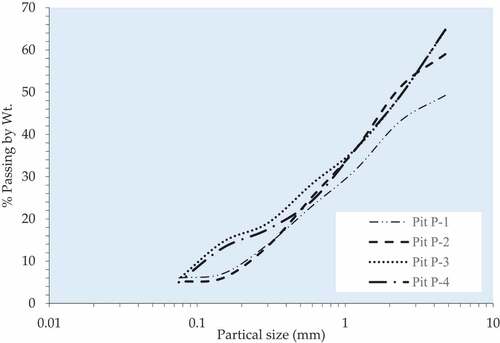
4.4.2. Particle size analysis
The soil classification is done Indian Standard Soil Classification System (ISSCS) which essentially gives particle size distribution of granular material materials by passing through different sizes arranged sieves as per the standard. Sieve analysis is used in engineering classification of soils, particularly coarse-grained soils. It is one of the suitability criteria to be accounted for the soils to be used for road, dam, airfield and other embankment construction. The soil water content/movement can be predicted from grain size analysis. Also, the grain size distribution is suitable parameter to predict phenomenon of frost action in soil in colder climate. From the grain size analysis (), soils are broadly classified as coarse and fine-grained soil. The sieve analysis was carried out according to IS: 2720 (Part 4)—1985.
Figure 12. Grain size distribution graph of four pits
4.4.3. Consistency limits
In multifarious states that the soil exists, the engineering properties of the soil vary based on behaviour of soil and its consistency. Thus, by properly examining the changes in soil’s behaviour, the boundary between each state can be defined. Therefore, Atterberg limits test based on IS guidelines is performed to distinguished properties of clay and silt. Liquid and Plastic limit test was conducted as per IS: 2720 (Part 5)-1995 with the soil passing through 0.075 mm IS sieve. The soil was found non-plastic in nature in all the test pits indicating larger portion of silt content. The soil samples are from depth 1.0 m to 3.0 m. Sieve analysis have also shown that the fraction passing 0.075 mm IS sieve is substantially less (4 to 6.5%) of the soil sample.
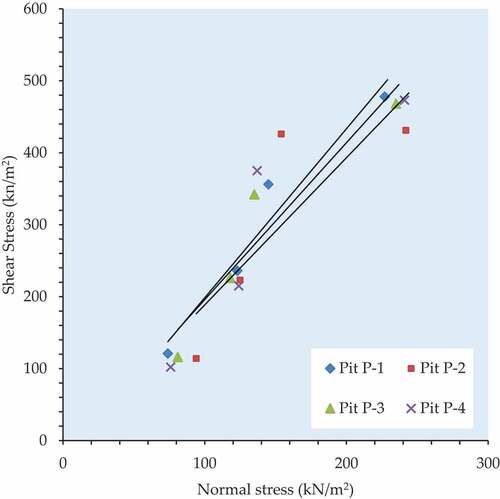
4.4.4. Direct shear
The objective of the direct shear test conducted as per IS: 2720 (Part 13)—1997 was to determine the mechanical properties such as cohesion (c) and angle of internal friction (ϕ) (). Shear strength parameters can be used to determine soil shear strength as well as to estimate the bearing capacity of the soil.
Figure 13. Relationship between normal stress and shear stress
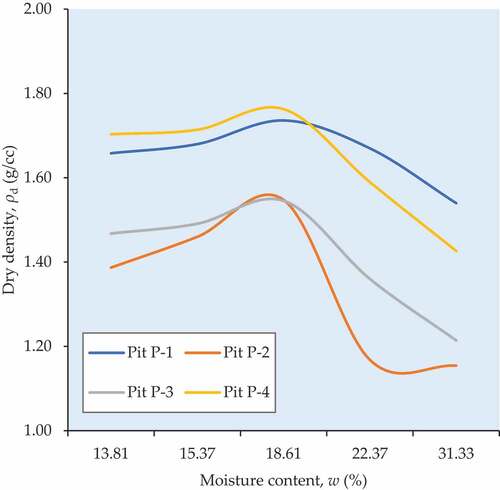
4.4.5. Compaction test
Modified proctor test refers to heavy compaction test, an improved version of light compaction test. The proposed site is expected to have heavy traffic load due to which settlement could be one issue. The daily traffic is more than 500 to 1500 CVPD (Department of Roads, Citation2005). To achieve the desired compaction, modified proctor test was conducted to determine Maximum Dry Density (MDD) and Optimum Moisture Content (OMC) (Ouyang et al., Citation2005). shows the relationship between the dry density and moisture content for each sample. To determine the degree of compaction in the field, field test could be conducted to achieve 98% of maximum dry density and + or—2% OMC for embankment, sub-grad, sub-base and base material (Department of Engineering Services, Citation2020). Based on the type of soil either core cutter or sand replacement methods can be used.
4.4.6. Permeability
The property of a soil which allows water to infiltrate through it, is called permeability. It is very important factor for the structures which are in contact with water. The permeability of a soil is paramount property and is useful in understanding various engineering issues, e.g., seepage analysis through soils, drainage, rate of settlement of compressible layers, etc. Prakash and Jain (2002) (Prakash & Jain, Citation2002) clarified that water flowing through the soil exerts a significant seepage forces which directly affect the safety of hydraulic structures. Any material having continuous voids is permeable. The permeability of different soils varies widely. Gravels and sands are more permeable as compared to silts, whereas clays are least permeable. The permeability of soil is apprised by permeability coefficient ’k’. It is measured as the velocity of flow under unit hydraulic gradient. The permeability of sediments is quantified based on IS: 5529 (Part-1)-1985 and projected in with other soil parameters.
Figure 14. Relationship between dry density and moisture content
4.5. Precipitation pattern in study area
Climate in Bhutan vagaries as a function of seasonal monsoon winds and the geographical conditions. The climatic zones widely vary from hot and humid tropical in the South to alpine in the North dividing Bhutan into the six major climatic zones (alpine, cool temperature, subtropical, tropical, tundra and warm temperate). Monsoon season in Bhutan falls within May to September where 90% of annual precipitation has been recorded by local meteorological agencies. The mean annual rainfall widely varies from as low as 250 mm in the North to a maximum of 6000 mm in South with an average rainfall of 2000 mm in most part of the country. Records show that uneven daily precipitation exist during monsoon whereby around 10% of the total annual rainfall occurs in one day whereas 50% of the total annual rainfall was observed in 10 days during summer. Such vagaries in the precipitation initiate extensive runoff of the top soil and sediments deposition in settlement area.
The studied area falls in the sub-tropical climate zone with warm to hot summer and pleasant to cold winter. From the past records the mean annual rain fall varies. There is a drastic fluctuation in annual rainfall. The maximum rain fall was recorded 6699 mm during the year 1998 and the minimum was in 2006 where the total rain fall recorded was 1996 mm (Department of Geology and Mines, Citation2010).
Figure 15. Variation of rainfall during peak monsoon in study area from May to September
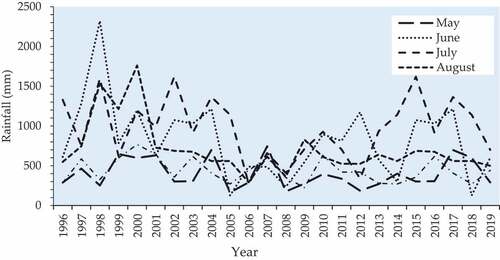
Figure 16. Variation of annual rainfall (1996–2019)
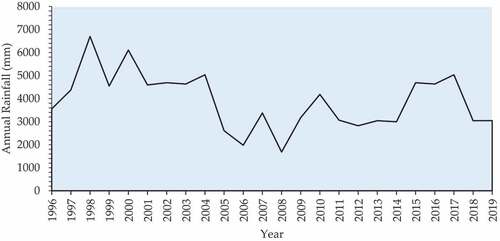
Figure 17. Double ring infiltrometer test
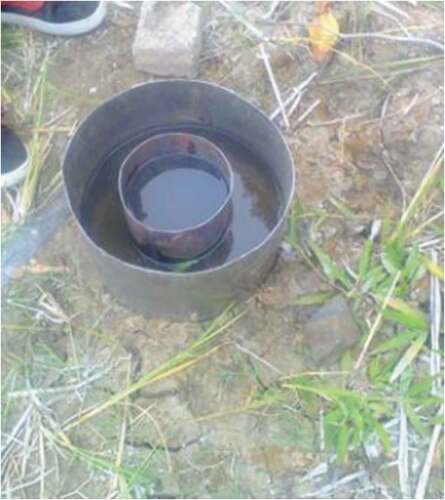
Double ring infiltrometer test was conducted as per ASTM D5093 in 26 pocketed locations within the study area as shown in . The highest Infiltration rate was found to be 23.29 mm/hr. on average. It depicts low runoff potential and high infiltration rates (Wischmeier & Smith, Citation1978). The soil-based on texture is categorized as well-drained sand and gravel.
4.6. Volume of sediments
The precipitation of the study area is as high as 6000 mm () in monsoon season which has led to high erosion at the upstream of the study area causing huge sediment deposit at the downstream. For this reason, measuring the sediment volume is essential for the study site. RUSLE was used for measuring the sediment volume of the study area. It was confirmed that no organic materials are presents in the sediment and predominant soil deposit is grey phyllite sand whose particle size varies to 4.25 mm. The test for permeability was conducted and results obtained are used in the calculation. It was found out that total soil loss from the hill slope is 593,267,807.9 tons/Km2/year. Sediment delivery ratio was calculated using Vanoni SDR equation i.e. SDR = 0.42 *A − 0.125. The actual total sediment deposited was roughly estimated in the basin area (3 Km x 2 Km) as 144,600,000 tons/Km2/year. However, using SDR ratio the sediments yield was found out to be 199,173,322.1 tons/Km2/year.
5. Conclusions
In the present study, the subsurface soil parameters were assessed by in-situ open pit investigation, geophysical survey and Standard Penetration Test (SPT), while the engineering properties of the sediment deposits were determined from laboratory tests. Following conclusions are drawn from the present study:
Based on the geotechnical investigation, the sediment deposit at the study area is coarse-grained soil, in which 35–50%—gravel, 50–60%—sand and 4–6.5% fines in all the four test pits.
As per Indian Standard Soil Classification System (ISSCS), the soil is classified as SG-SM (Sandy Gravel-Sandy silt), non-plastic soil.
The depth of foundation of 1.65 m from prepared or reclaimed ground level is proposed based on the present investigation
There is no influence of water table in the current study.
Proper drainage system around the planed area is highly proposed.
The study indicated huge volume of sediments and geophysical survey validated the deposit up to depth of 43.1 m.
An alternative use of the sediment deposit is recommended as cost recovery measures such as in road works: sub-base and base course prior to relevant quality test.
Acknowledgements
The authors are thankful to College of Science and Technology, Royal University of Bhutan and Department of Geology and Mines for providing technical reports.
Additional information
Funding
Notes on contributors

Karma Tempa
Karma Tempa is Lecturer and Head of Department in Civil Engineering and Architecture Department at College of Science and Technology, Royal University of Bhutan, Phuentsholing, Bhutan. He is also Program Leader for B.E. in Engineering Geology program. He has MSc in Civil Engineering from Università degli Studi del Sannio, Benevento, Italy and B.E. in Civil Engineering from College of Science and Technology. He has worked as Construction Manager for Royal Government of Bhutan for public infrastructure development projects. He has continuously supported Construction Development Board (CDB) in training contractors to enhance quality in Bhutanese construction industry. He has worked as principal investigator for World Bank project, South Asia Subregional Economic Cooperation-SASEC project and R&D-based project with Druk Holding and Investment (DHI). His research interest includes landslide hazard vulnerability and susceptibility assessment, geotechnical site characterization, local seismic response studies, geohazards risk management and pavement geotechnology.
References
- Ali, T. S., & Fakhraldin, M. K. (2016). Soil parameters analysis of Al-Najaf City in Iraq: Case study. Journal of Geotechnical Engineering, 3(1), 1987–21. http://engineeringjournals.stmjournals.in/index.php/JoGE/article/view/3749
- Ashiagbor, G., Forkuo, E. K., Laari, P., & Aabeyir, R. (2012). Modeling Soil erosion using rusle and Gis tools. International Journal of Remote Sensing & Geoscience (IJRSG), 2(2), 7–17. http://www.ijrsg.com/Issue.aspx?IssueId=24
- Cassol, E. A., da Silva, T. S., Eltz, F. L. F., & Levien, R. (2018). Soil erodibility under natural rainfall conditions as the K factor of the universal soil loss equation and application of the nomograph for a subtropical Ultisol. Revista Brasileira de Ciencia do Solo, 42, 1–12. https://doi.org/10.1590/18069657rbcs20170262
- Chettri, N., Chhetri, I. B., & Yangzom, K. (2019). Profile of subgrade subsidence in Sorchen. International Journal on Integrated Education, 2(6), 47–54. https://doi.org/10.31149/ijie.v2i6.197
- Chettri, N., Sarkar, R., Adhikari, K., & Chettri, I. B. (2019). Forecasting landslide in Chukha from index properties of soil-research to policy making. World Scientific News an International Scientific Journal, 135, 227–248. http://psjd.icm.edu.pl/psjd/element/bwmeta1.element.psjd-e322eeac-ef79-42d1-9c71-85f0a50c0682
- Department of Engineering Services. (2020). Specifications for building and road works. Ministry of Works and Human Settlement.
- Department of Geology and Mines. (2010). Technical Report on proposed landslide mitigations in Phuentsholing Thromde (pp. 1–60). Ministry of Economic Affairs.
- Department of Roads. (2005). Pavement design manual. Ministry of Works and Human Settlement.
- Dini, B., Manconi, A., & Loew, S. (2019). Investigation of slope instabilities in NW Bhutan as derived from systematic DInSAR analyses. Engineering Geology, 259, 105111. https://doi.org/10.1016/j.enggeo.2019.04.008
- Dutta, S. (2016). Soil erosion, sediment yield and sedimentation of reservoir: A review. Modeling Earth Systems and Environment, 2(3), 1–18. https://doi.org/10.1007/s40808-016-0182-y
- Gaubi, I., Chaabani, A., Ben Mammou, A., & Hamza, M. H. A. (2017). A GIS-based soil erosion prediction using the revised universal soil loss equation (RUSLE) (Lebna watershed, Cap Bon, Tunisia). Natural Hazards, 86(1), 219–239. https://doi.org/10.1007/s11069-016-2684-3
- Keller, G. V., & Frischknecht, F. C. (1982). Electrical methods in geophysical prospecting (5th ed.). Pergamon Press.
- Kitahara, H., Okura, Y., Sammori, T., & Kawanami, A. (2000). Application of universal soil loss equation (USLE) to Mountainous Forests in Japan. Journal of Forest Research, 5(4), 231–236. https://doi.org/10.1007/BF02767115
- Laskar, A., & Pal, S. K. (2012). Geotechnical characteristics of two different soils and their mixture and relationships between parameters. EJGE, 17, 2821–2832. http://www.ejge.com/2012/Ppr12.261alr.pdf
- Mata-Lima, H., Alvino-Borba, A., Pinheiro, A., Mata-Lima, A., & Almeida, J. A. (2013). Impacts of natural disasters on environmental and socio-economic systems: What makes the difference? Ambiente e Sociedade, 16(3), 45–64. https://doi.org/10.1590/S1414-753X2013000300004
- Mayne, P. W., Christopher, B. R., & DeJong, J. (2002). Subsurface investigations — Geotechnical site characterization reference manual. U.S. Department of Transportation Federal Highway Administration.
- Mohsen, M., & Abayati, A. (2009). Review study on sediment models. Journal of Engineering and Applied Sciences, 4(2), 152–160. https://medwelljournals.com/abstract/?doi=jeasci.2009.152.160
- Ngah, S. A., & Nwankwoala, H. O. (2013). Evaluation of geotechnical properties of the sub-soil for shallow foundation design in Onne, Rivers State, Nigeria. The IJES, 2(11), 08–16. http://www.theijes.com/papers/v2-i11/Part.3/C02110308016.pdf
- Oghenero, A. E., Akpokodje, E. G., & Tse, A. C. (2014). Geotechnical properties of subsurface soils in Warri, Western Niger Delta, Nigeria. Journal of Earth Sciences and Geotechnical Engineering, 4(1), 89–102. http://www.scienpress.com/Upload/GEO/Vol%204_1_8.pdf
- Oke, S. A., & Amadi, A. N. (2008). An assessment of the geotechnical properties of the sub-soil of parts of Federal University of Technology, Minna, Gidan Kwano Campus, for foundation design and construction. Journal of Science Education and Technology, 1(2), 87–102. https://www.researchgate.net/publication/317851129_An_assessment_of_the_geotechnical_properties_of_the_subsoil_of_parts_of_Federal_University_of_Technology_Minna_Gidan-Kwano_Campus_for_foundation_design_and_construction
- Ouyang, D., Bartholic, J., & Selegean, J. (2005). Assessing sediment loading from agricultural croplands in the Great Lakes Basin. The Journal of American Science, 1(2), 14–21. doi: 10.7537/marsjas010205.03
- Phuentsholing Thromde. (2002). Urban development plan: 2002-2017.
- Prakash, S., & Jain, P. K. (2002). Engineering soil testing. Nem Chand & Bros.
- Ranjan, G., & Rao, A. S. R. (2000). Basic and applied soil mechanics (2nd ed.). New Age International (P) Ltd.
- Tempa, K., Chhetri, N., Bdr, I., & Yangzom, D. (2016). Subsurface exploration for road sinking at Sorchen and counter measures. International Civil Engineering Congress: Karachi, Pakistan, 8, 295–303. http://iepkarachi.org.pk/8th_International.html?fbclid=IwAR29Y0DnCWvF4X99-7QBX1QpQgLVlmpqnAcjAWt_d9N431jAAHYEf-whuFM
- Tempa, K., Sarkar, R., Dikshit, A., Pradhan, B., Simonelli, A. L., Acharya, S., & Alamri, A. M. (2020). Parametric study of local site response for bedrock ground motion to earthquake in Phuentsholing, Bhutan. Sustainability, 12(13), 5273. https://doi.org/10.3390/su12135273
- Wischmeier, W. H., & Smith, D. D. (1978). Predicting rainfall erosion losses: A guide to conservation planning. Science and Education Administration, United States Department of Agriculture in cooperation with Purdue Agricultural Experiment Station, U. S.
- Wordofa, G. (2011, June). Soil erosion modeling using Gis and rusle on the Eurajoki Watershed Finland [Bachelor’s degree, Tampere University of Applied Sciences].
- Youdeowei, P. O., & Nwankwoala, H. O. (2013). Suitability of soils as bearing media at a freshwater swamp terrain in the Niger Delta. Journal of Geology and Mining Research, 5(3), 58–64. https://doi.org/10.5897/JGMR11.046
- Zawawi, M. H., Azman, A., Radzi, M. R. M., Abas, A., & Aziz, N. A. (2019). Coastal sediment transport study along shoreline by using smooth particle hydrodynamics. IOP Conference Series: Materials Science and Engineering.