
 ?Mathematical formulae have been encoded as MathML and are displayed in this HTML version using MathJax in order to improve their display. Uncheck the box to turn MathJax off. This feature requires Javascript. Click on a formula to zoom.
Abstract
Progressive collapse assessment of a reinforced concrete (RC) building designed only for gravity loads and lacking a dedicated lateral load resisting system was carried out using the alternate load path (ALP) method and finite element method (FEM) numerical model created in software SAP2000. Plastic hinge capacity of the members was evaluated considering flexure (M), axial force (N) and shear force (V) interaction and a validated procedure was devised to incorporate the plastic hinge capacity based on M-N-V interaction into the results obtained from the FEM model. It was found that consideration of M-N-V interaction resulted in plastic hinge capacities that were lower than the flexure-only capacity of the plastic hinges available in the FEM software which caused the progressive collapse to initiate at a lower load and also resulted in increased collapse area. In the second part of the study, it was demonstrated that the progressive collapse resistance of the building for the interior and the edge column removal scenarios was appreciably improved after ordinary moment frames were cost-effectively designed at selected locations without increasing member cross-sectional dimensions. However, key element design concept approach was needed for improving the progressive collapse performance for the corner column loss scenarios. Relative reduction in the plastic hinge capacity due to M-N-V interaction as compared to flexure-only hinge capacity was found to be lower for the redesigned building due to improved member capacity.
PUBLIC INTEREST STATEMENT
Progressive collapse is the spread of local failure of a structural element that results in the collapse of the entire structure or a disproportionately large part of it. Mid-rise reinforced concrete residential buildings designed only for gravity loads and having open ground floor due to local building code requirements seems to be vulnerable to progressive collapse as the columns are exposed to potential damage from accidental or deliberate abnormal loadings such as gas explosion, vehicle impact, or terrorist attack. As these buildings are designed for gravity loads only, therefore the structural configuration is not robust enough to redistribute the gravity load after partial removal of a vertical support. Additionally, such buildings are located in high population density neighborhoods; therefore, the social and economic impact of their progressive collapse could be disproportionally high. The objective of this study is to evaluate the vulnerability of such buildings to progressive collapse and to suggest cost-effective remedial measures to enhance their progressive collapse resistance.
1. Introduction
The spread of an initial local failure from element to element resulting eventually in the collapse of an entire structure or a disproportionately large part of it is termed as “progressive collapse” (ASCE, Citation2016). The philosophy commonly used in design codes to prevent progressive collapse is based on a threat-independent approach in which vertical load carrying members (columns or walls) are sequentially removed and ensuing response of the structure is examined. Accordingly, the structure is either to be designed for preventing the local failure (i.e., key element design) or limiting its spread (i.e., alternative path method, ALP). Detailed rules for designing collapse-resistant buildings have been codified in the USA in the General Services Administration guidelines (GSA, Citation2016) and the United Facilities Criteria by the Department of Defense (DoD, Citation2009).
Past studies on progressive collapse fall into three broad categories: (i) numerical simulations, (ii) experimental/onsite studies, and (iii) theoretical analysis. Adam et al. (Citation2018), Byfield et al. (Citation2014), Kiakojouri et al. (Citation2020), Yagob et al. (Citation2009), and Mohamed (Citation2006) have provided excellent reviews on the states of knowledge and practice of progressive collapse in building structures. The use of finite element method (FEM) based numerical analysis is the preferred method to study the progressive collapse behavior of reinforced concrete (RC) building structures (Ren et al., Citation2014).
FEM models with concentrated hinges are the most commonly used analytical models for progressive collapse studies (NIST, Citation2017). Capacity of these hinges is based on the theoretical moment-curvature (M-ϕ) relationships of the cross sections (FEMA, Citation2000) for the given axial load. Interaction of axial load and bending moment (M-N) in columns is accounted for in most of the FEM software used for progressive collapse studies while shear strength of beams and columns is independently assessed without considering flexure interaction. Sagiroglu and Sasani (Citation2014) examined the impact of axial load on plastic hinge capacity of beams during progressive collapse analysis and noted significant changes in the plastic hinge capacity due to M-N interaction. However, there is a lack of studies that include interaction of shear force with axial load and moment in plastic hinges for progressive collapse assessment of buildings. It is well known that plastic hinge capacity is affected by M-V interaction (Dang‐Vu et al., Citation2020; Mander et al., Citation1993; Recupero et al., Citation2005; Russo et al., Citation1991). (Lee & Elnashai, Citation2002) noted that considering flexural and shear failures independently may result in overestimation of member capacity. In order to overcome this limitation, a procedure is devised in this study to incorporate effect of M-N-V interaction on plastic hinge capacities for progressive collapse assessment of building structures when using FEM software that lacks M-N-V interaction capabilities.
Another practical area of progressive collapse research relates to the evaluation of the design codes to mitigate progressive collapse of gravity-load designed building structures (Parisi & Scalvenzi, Citation2020; Helmy et al., Citation2012; Salem et al., Citation2011; Brunesi & Parisi, Citation2017; etc.). Different analysis approaches (e.g., finite element method (FEM), applied element method (AEM), lumped plasticity, fiber models etc.) were adopted in these studies. Despite differences in the adopted analysis approaches, similar conclusions were reached in these studies that structures designed to ordinary design provisions were highly susceptible to progressive collapse. Progressive collapse resistance of gravity-load designed RC structures for which earthquake is the governing lateral load has been investigated in the past (Hayes et al., Citation2005; Ioani et al., Citation2007; Lin et al., Citation2017; Tsai & Lin, Citation2008). However, wind load is the only dominant lateral load in many parts of the world. In one study, Gerasimidis and Baniotopoulos (Citation2011) investigated the effect of wind load on the progressive collapse of 2D steel moment frames and concluded that wind loads in frames more than six stories (>18 m) tall play a significant role in structural performance when subjected to sudden corner column loss scenario. Similar studies for mid-rise reinforced concrete (RC) buildings for which wind is the dominant lateral load are not available in the literature. The second objective of this study is to fill this gap.
Khan (Citation1967) demonstrated that mid-rise (up to 12 story tall) residential RC buildings do not incur any “premium for height” for wind loads. Similarly, Oda (Citation2017) observed that gravity load design alone is usually deemed sufficient for such RC structures that are located in moderate design wind speed regions (<145 km/h). Occupant perception of the drift caused by wind load in these structures is also low due to low building period, stiff interior partitions and lack of an exterior flexible curtain wall (Al-Balhawi & Zhang, Citation2018). All these factors contribute to the general practice of ignoring lateral loads in the design of mid-rise RC residential structures located in regions of low seismicity and moderate wind speed. This design practice often results in building structures that lack continuity, ductile detailing, and absence of a dedicated lateral load resisting system. This study aims to investigate the progressive collapse performance of one such building based on its original design as well as after its redesign that includes a lateral load resisting system.
2. Motivation and Objectives
The study presented herein investigated the progressive collapse potential of a 9-story RC residential building that was designed only for gravity loads and lacked any lateral load resisting system. Progressive collapse analysis of the building was conducted using GSA (Citation2016) guidelines and 3D non-linear static FEM analysis of the building in SAP2000 (CSI, Citation2019). Mid-rise multistory residential buildings, as depicted in , seem to be vulnerable to progressive collapse due to the presence of open ground floor in which columns are exposed to potential damage from accidental or deliberate abnormal loadings such as gas explosion, vehicle impact or terrorist attack. As these structures are designed for gravity loads only, therefore the structural configuration may not be not robust enough to redistribute the gravity load after partial removal of a vertical support. Additionally, such structures when located in high population density neighborhoods may result in a disproportionally high social and economic impact due to progressive collapse. The objective of this study is to evaluate the vulnerability of such buildings to progressive collapse and to suggest cost-effective remedial measures to enhance their progressive collapse resistance.
Figure 1. Typical mid-rise residential building with open ground floor

In the present study, the selected building with original design was investigated first for progressive collapse using the GSA procedure for flexure-only plastic hinges as well as plastic hinges with M-N-V interaction. Thereafter, it was designed for lateral wind loads by providing rigid frames in both directions according to ASCE-7 and ACI-318 and progressive collapse potential of the building was re-assessed. A comparison of both designs was made and conclusions were drawn regarding the effectiveness of wind design for resisting progressive collapse in such gravity-load designed structures and the influence of M-N-V interaction on the progressive load capacity.
3. Assumptions, adopted analysis procedure, and procedure verification
This section presents the assumptions made in the FEM modelling and progressive collapse analysis of the building along with a description of the adopted procedure that incorporates M-N-V interaction in the plastic hinges for assessment of the collapse load. Verification of the adopted procedure for prediction of the collapse load is included in the last sub-section by comparing the predicted results with the experimental ones available in the literature.
3.1. Assumptions
Progressive collapse assessment in the study was carried out through 3D non-linear static FEM modeling and analysis in commercially available software SAP2000 (CSI, Citation2019). In the 3D model of the building, only RC frame members, i.e., beams and columns were modeled and supplementary contribution to progressive collapse resistance from the slab and infill walls was conservatively neglected. Justification for adopting these assumptions is provided in the following.
The protocol of modeling RC slab as equivalent flanges of the beams has been successfully adopted in the past (Li et al., Citation2016; Sasani, Citation2008; Sagiroglu & Sasani, Citation2014; Ren et al., Citation2014; Tsai & Lin, Citation2008; among others). Additionally, inability of the current FEM software to incorporate flexural hinges in shell elements used for modeling slabs as well as inability of the non-linear shell elements for allowing transition from flexure to membrane to catenary action also precludes its effective use in progressive collapse studies (Adam et al., Citation2018). These limitations tend to accentuate the contribution of slab towards progressive collapse capacity, as the shell elements are not capable of exhibiting true non-linear behavior. Yu et al. (Citation2018) demonstrated through experimental studies that for small deflections (< ¾ beam depth), contribution of slab to progressive collapse capacity was around 10% and increased to a maximum of 30% for larger deflections. Similarly, Botez et al. (Citation2016) found contribution from the slab membrane action to be maximum of 15% to the overall flexural capacity. In light of these studies, it was reasonable to conclude that neglecting the slab in the FEM model was not likely to cause significant errors that can jeopardize the validity of the results presented herein.
The decision to neglect infill walls from the 3D FEM model was based on two additional facts: (i) infill walls were not extended to the ground level due to the imposed requirement of open ground floor—a reason as cited in Sagiroglu and Sasani (Citation2014) for neglecting infill walls from their model and (ii) use of lightweight autoclaved aerated concrete (AAC) blocks instead of concrete blocks around the building perimeter as infill for thermal insulation. ACC blocks have a compressive strength of less than 3 MPa and exhibit poor lateral load performance when used as infill (Hammoudah et al., Citation2018). Therefore, in the current study, infill walls were taken as a load on the RC framing and no effect from their presence was considered in the progressive collapse resistance.
3.2. Adopted modelling and analysis procedure
3D non-linear static FEM analysis of the building frame was conducted for progressive collapse evaluation using the concentrated hinge model based on the recommendation of NIST (Citation2017). In this type of model, the effect of dynamic inertia and damping was compensated through the dynamic load factor (DLF) (GSA, Citation2016). Geometric non-linearity in the 3D FEM model was considered through P-Δ option in SAP2000 whereas material non-linearity was modeled through concentrated hinge component model.
Modeling of the concentrated plastic hinges was carried out according to the FEMA-356 hinge procedure (FEMA, Citation2000) based on the moment-curvature (M-ϕ) relationship of the cross sections. These M-ϕ plastic hinges were defined at member ends in SAP2000 after extracting yield and ultimate capacity for each member from section analysis carried out in Response-2000 (Bentz, Citation2000). Prediction of the collapse load in SAP2000 is based on the plastic hinge capacity using M-ϕ relationships without considering M-N-V interaction. In this study, accurate assessment of the final collapse load was done by considering M-N-V interaction in the plastic hinges as explained below.
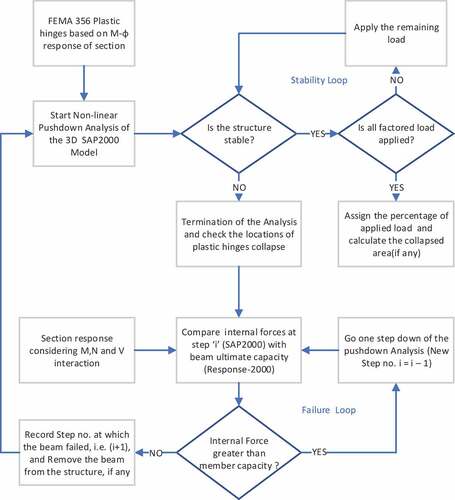
The adopted progressive collapse assessment procedure utilized the ALP method of GSA (Citation2016) and its various steps are depicted in . The static non-linear analysis was carried out by modeling the structure in SAP2000 and assigning member plastic hinges based on M-ϕ relationships using FEMA-356 plastic hinge definition. Pushdown analysis was carried out by threat-independent sudden removal of one of the columns and dynamically amplified factored load was gradually applied in a stepwise manner. The structure was deemed to have adequate resistance to progressive collapse if no instability was encountered after application of full factored load i.e. insufficient number of plastic hinges were formed that reached their ultimate capacity. This part of the analysis is contained in the “stability loop” as depicted in the top right of . However, if the structure became unstable before application of the full factored load, then members with collapsed plastic hinges were further investigated by comparing the member capacity including M-N-V interaction to the member internal loads as indicated by the “failure loop” in the bottom right of . The load step at which member internal forces at the plastic hinge location(s) were just inside the M-N-V capacity envelope was taken as the collapse step and the applied factored load at this step was noted and the said member was removed from the structure. The next stage(s) of pushdown analysis was continued with the truncated structure until the truncated structure was stabilized under full load or fully collapsed.
Figure 2. Flowchart of the adopted progressive collapse analysis procedure
3.3. M-N-V interaction using modified compression field theory
M-N-V interaction is taken into account through the modified compression field theory (Vecchio & Collins, Citation1986). M-V interaction diagram for a RC section was computed under a constant axial force (N) by an iterative process considering force equilibrium, enforcing compatibility conditions through relationships between average strains and inclination of the diagonal compressive stresses (θ) and relating stresses and strains in the cracked concrete through constitutive relationships. Salient features of these steps are summarized below.
The stress–strain relationships for cracked concrete are given as (Vecchio & Collins, Citation1986):
The compatibility conditions are enforced through the following relationships (Wagner, Citation1929):
The equilibrium equations for N, V and M take the following form (Collins & Mitchell, Citation1991):
Variables in the above relationships are defined as: f1 = principal tensile stress; f2 = principal compressive stress; fc’ = concrete cylinder strength; ε1 = principal tensile strain; ε2 = principal compressive strain; εc’ = strain at fc’; εx = longitudinal strain at the centroid of tensile reinforcement; εt = strain in transverse reinforcement; θ = inclination of diagonal compressive stress (= the angle of diagonal cracks); Es = modulus of elasticity of steel; As = area of longitudinal steel; Av = area of transverse steel; fsx = stress in longitudinal steel; fv = stress in transverse steel; dv = effective shear depth; s = spacing of transverse steel and bw = web width. Concrete stress-strain constitutive model proposed by Popovics (Citation1970) was used in the analysis while the constitutive model adopted for reinforcing bars was linear up to yield (GPa), flat post yield (
) and quadratic post strain-hardening (
and εrup = 0.106); in which
and
are the start of strain-hardening, ultimate and rupture strains respectively.
The procedure of creating an M-V interaction diagram involved choosing a value of ε1 and making an initial guess for θ and fv. Thereafter, values of f1, f2, εx, εt and ε2 were determined and N and V were computed from the equilibrium equations (EquationEqs. 5(5)
(5) & Equation6
(6)
(6) ). If equilibrium was satisfied within the prescribed error range, then the moment value was determined from EquationEq. (7)
(7)
(7) and the next value of ε1 was chosen and the steps were repeated. However, if the desired convergence was not achieved in the equilibrium equations (EquationEqs. 5
(5)
(5) & Equation6
(6)
(6) ), then the values of θ and fv were adjusted to achieve this objective.
3.4. Procedure verification
In order to validate the adopted progressive collapse analysis procedure, a comparison was made with the experimental study of Yi et al. (Citation2008). In the experiment of Yi et al. (Citation2008), collapse assessment of a four-bay and three-story one-third scale model was conducted by removing a lower story column and a vertical load was applied gradually to the middle column until failure. The frame and experimental parameters were modelled in SAP2000 using the afore-mentioned modelling and analysis procedure. The FEM model with flexure-only hinge lengths of 10% and 20% failed at deflections of 749 mm and 1485 mm, respectively, as depicted in at load steps 35 and 34, respectively. Internal forces in the hinge were tracked and compared with the M-N-V interaction envelope for the section depicted in . It was found that the section reached failure at load step 30 when deflection was 81 mm and 151 mm for 10% and 20% hinge lengths, respectively.
Figure 3. (a) Various SAP2000 models compared to experimental study of Yi et al. (Citation2008), (b) M-N-V interaction diagram for beam cross-section.
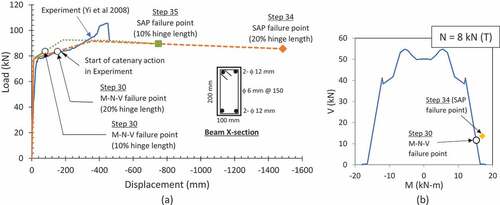
In the experiment, start of the catenary action was noted at a deflection of 160 mm until the specimen failed at 450 mm deflection as depicted in . It was noted that member deformation response as well as section strength response was over-predicted when flexure-only hinges were employed in the FEM model without M-V interaction. However, when M-N-V interaction was considered for 20% hinge length, the experimental response was replicated until the onset of catenary action. Formation of catenary action in a member requires deformations to be at least equal to the section depth during the plastic hinging phase (Lew et al., Citation2011; Orton, Citation2007; Xiao & Hedegaard, Citation2018). The member will fail without initiation of catenary action if it is incapable of reaching this limiting deflection. For structures designed only for gravity load, it is reasonable to assume low ductility and hence, a lack of catenary action. Therefore, 20% hinge length with M-N-V interaction seems to be the most suitable modelling choice for such members and was adopted in the study presented herein. This assumption was later verified by noting and comparing the nodal deflections during the push-down analysis in Section 4.3.3.
4. Progressive collapse assessment—application
This section deals with the progressive collapse assessment of a gravity load designed mid-rise residential building located in a low seismicity and moderate wind zone. Description of the building is presented in Section 4.1 followed by the salient details of the numerical FEM model in Section 4.2. Progressive collapse assessment of the building using the ALP method and incorporating M-N-V interaction in the plastic hinges is detailed in Section 4.3.
4.1. Building Description
The building is a residential apartment building with a total foot print area of 860 m2 and includes a basement, ground floor and eight typical floors, each with a covered area of 268 m2. The building rises 40.45 m above the ground level. The building is made of reinforced concrete frame structure that consists of RC columns founded in a 750 mm thick raft foundation. The structural configuration of the floors consists of 120 mm thick solid two-way RC slabs that are supported by beams and girders as shown in .
Figure 4. Typical structural framing layout plan and column removal scenarios
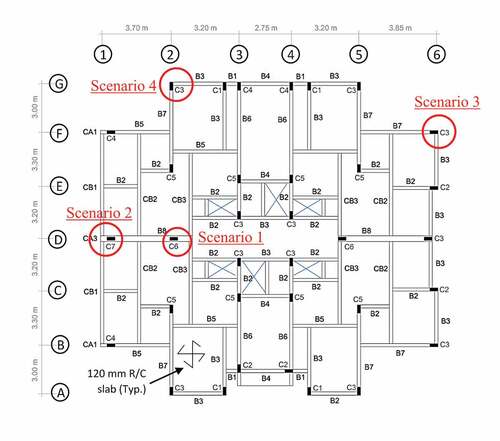
The building was designed according to ACI 318–02 and ASCE 7–05. Structural elements were designed for superimposed surface dead load of 2 kN/m2, unreducible live load of 3 kN/m2 and partition load varying from 5.8 to 11.5 kN/m in addition to its own weight. The structure was not designed for any lateral load as seismicity of the region is low and wind loads are considered only for structures exceeding 12 stories in height based of the local design practice. Therefore, most of the beams in the building were designed as simply supported beams and no shear wall or moment frames were present in the building to cater for the relatively moderate lateral loads.
Columns varied in size from 200 × 550 mm to 300 × 1250 mm while the beams had sizes ranging from 150 × 300 mm to 350 × 650 mm. Column and single span beam schedules of the building are presented in and of the Appendix, respectively. Similarly, details of reinforcement in the continuous beams are presented in of the Appendix. The design compressive cylinder strength (fc’) of concrete was 25 MPa for beams and slabs and 30 MPa for columns. The used steel rebars were of ASTM A615 Grade 60 with yield and ultimate strength of 420 and 530 MPa, respectively. Additional details are documented in Abdulsalam (Citation2019).
4.2. 3D FEM modelling
The 3D non-linear FEM numerical model of the building was created in two stages: (a) preliminary stage and (b) plastic hinge stage. Description of both stages is presented below:
Preliminary modelling stage
The preliminary modelling stage included defining geometry of the model and assigning material and section properties and then building the structural elements with the appropriate boundary conditions in the 3D FEM Model in SAP2000. The 3D non-linear numerical model of the building was created using two-node frame elements with six DOFs at each node. There were 1134 frame elements (828 as beams & 306 as columns) in the 3D FEM model of the building. Beam sections were assigned M-ϕ capacities for positive and negative moment based on the provided reinforcement as described in Section 4.1. This approach ensured that a plastic hinge will form at that beam end where the applied factored moment exceeds the section capacity independent of the assigned end fixity.
Beam-column joints in the FEM model of the building were modelled with appropriate assignment of rigid zones in the framing elements and rotational spring in the panel zone of the joint to ensure that flexibility of the beam-column joint was appropriately taken into consideration during the non-linear analysis. A rigid zone factor of 0.5 was assigned to the elements framing in a joint which made 50% of the offset between the face of the element and the center of the joint rigid. The panel zone rotational spring was assigned based on the properties of the column. Column to foundation joint was assumed to be fixed due to the provision of 750 mm thick reinforced concrete raft foundation.
(b) Plastic hinge stage
The plastic-hinge stage included determining the plastic hinge properties of each member by conducting section analysis in Response-2000 as explained in Section 3.3 and then assigning these properties in the FEMA-356 M-ϕ backbone hinge curve to the members in the 3D FEM model created in SAP2000.
4.3. Alternative Load Path method for Progressive collapse assessment
The static nonlinear analysis approach was adopted to perform progressive collapse assessment of the building. It was done by employing pushdown analysis based on displacement control of the joint just above the removed column as well as force control based on the applied load combination. The load combination considered for the analysis was: 2*(Dead Load + 0.25 Live Load), in which the factor 2 represents the dynamic load factor (GSA, Citation2016). The analysis procedure involved increasing the applied load incrementally until maximum factored loads were applied or sufficient number of plastic hinges formed to cause collapse. Formation of the plastic-hinges and the internal forces of the members were monitored step-by-step during the analysis to determine failure of member(s) and collapsed area as explained in section 3.2 and .
4.3.1. Column removal scenarios
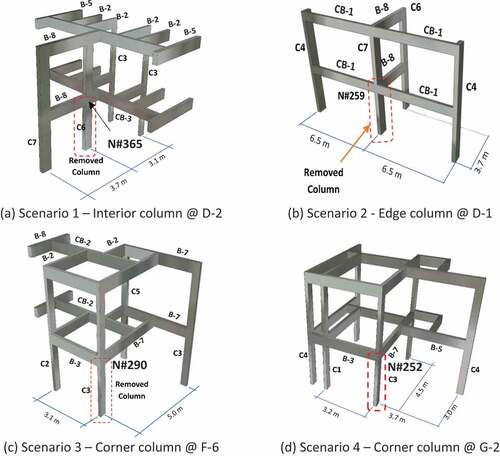
Different scenarios of sudden column removal at the ground floor level were considered to examine the potential for progressive collapse as recommended in the GSA guidelines for the alternative load path method (ALP) as depicted in . The first scenario incorporated the removal of an internal column, the second incorporated the removal of an edge column, and the last two incorporated removal of a corner column as depicted in in the plan view and partial 3D views in . The selected column removal scenarios represented the worst cases for each scenario based on the column size, tributary area and impact on the progressive collapse resistance. Other cases of column removal for these scenarios were likely to be less critical.
Figure 5. Partial 3D view of the structure for column removal scenarios
4.3.2. Load re-distribution mechanisms
(i) Scenarios 1 & 2—interior and edge column removal
depicts the internal force diagrams for scenarios 1 and 2 which related to an interior and an edge column removal. After removal of the interior column C6 at grid D-2 in scenario 1, beam B-8 became a cantilever beam that supported continuous beam CB-3 at the cantilever end. The load re-distribution after removal of column C6 was mainly due to the Vierendeel or frame action that developed between the floor beams and the vertical members as depicted in ).
Figure 6. Bending moment and axial force distribution in the frames for Scenarios 1 & 2
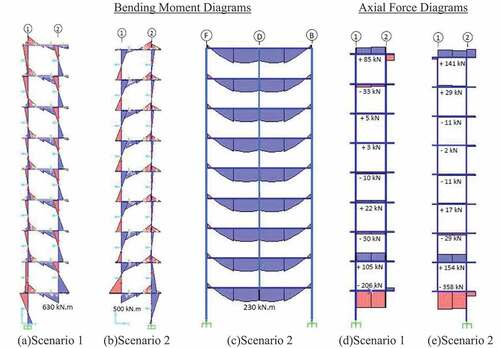
Two distinct load re-distribution mechanism were activated in scenario 2 after removal of the edge column C7 at grid D-1. The first mechanism involved beams B-8 and interior column C6 at grid D-2 that formed a vertical Vierendeel mechanism as the simply supported beams B-8 became cantilever beams and supported at their tips the middle reaction of the continuous beams CB-1 running along grid 1. Bending moment diagram for this mechanism is depicted in ). The second load re-distribution mechanism in scenario 2 was formed by columns C4 at grids B-1 and F-1 and continuous beams CB-1 along grid 1. The two span continuous beams CB-1 became single span beams after the removal of column C7 at grid D-1 and the load redistribution took place mostly by flexural action in beams CB-1. Vierendeel mechanism was not prominent in this case due to relative flexibility of beams CB-1 as can be noted in the moment diagram depicted in ).
Salient feature of both scenario 1 and 2 was the introduction of axial compressive and tensile forces in beams B-8 along grid D in an almost alternating manner and double curvature of beams and columns as depicted in ) and 6(e) respectively. On the contrary, due to the absence of the Vierendeel action, very little axial load was introduced in continuous beams CB-1 in the second load redistribution mechanism of scenario 2. Axial load in the columns above the removed columns dropped to zero in both scenarios indicating redistribution of loads within the members of the same floor.
(ii) Scenarios 3 & 4—corner column removal
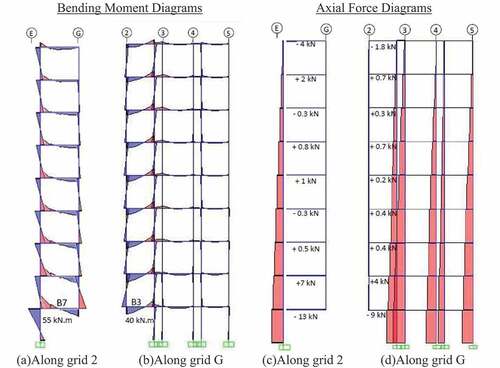
presents the bending moment and axial force diagrams along two grids for loading stage 1 of scenario 4 in which column C3 at grid G-2 was removed. Beams B-3 and B-7 were designed and detailed as simply supported beams supported by the removed column C3 at one end and columns C1 and C5 on the other ends respectively. A weak Vierendeel mechanism formed at the lower stories along both grid lines 2 and G in the frame as can be seen in ) and 7(b). However, the value of bending moment was low due to limited capacity of the beams. A very small axial load was induced in the beams as depicted in ) and 7(d). Also, axial load in the columns above the removed column dropped to zero immediately after removal of the ground column. Therefore, load redistribution took place among members of the same floor only. After failure of beams B-7 and B-3 in stages 1 and 2, respectively, load redistribution took place through floor beams only in scenario 4. Load redistribution in scenario 3 was similar to scenario 4 whose details are not presented due to space limitations.
Figure 7. Bending moment and axial force distribution in the frames for Scenario 4—Loading Stage 1
4.3.3. Push-down analysis results and progressive collapse assessment
Observations related to the performance of various structural elements in progressive collapse performance of each scenario of the push-down analysis are summarized in this section. Progressive collapse performance based on M-ϕ plastic hinge capacity (as in SAP2000) is compared to the one based on M-N-V interaction and the differences are highlighted for each scenario.
(i) Scenario 1—interior column removal
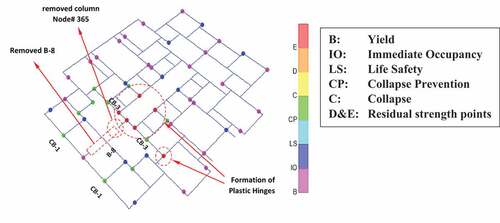
The response of the structure was monitored step-by-step according to the analysis procedure described in Section 3.2. In this scenario, a plastic hinge first exceeded the ultimate capacity at the supported end of beam B-8 at the first floor after application of 78.7% of the total factored load at the end of load step 25.
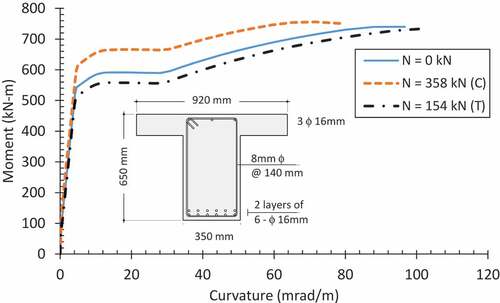
The plastic hinge defined in SAP2000 was based on M-ϕ relationship only and no interaction of bending moment (M), shear force (V) and axial force (N) was considered in its definition. presents the comparison in M-ϕ behavior of beam B-8 for the maximum axial loads observed in scenarios 1 and 2. It can be noted that axial compression increased the moment at yield while tensile axial load reduced it. However, there was no significant impact on the value of ultimate moment.
Figure 8. Effect of Axial Force on M-ϕ relationship for beam B-8 in Scenarios 1 and 2
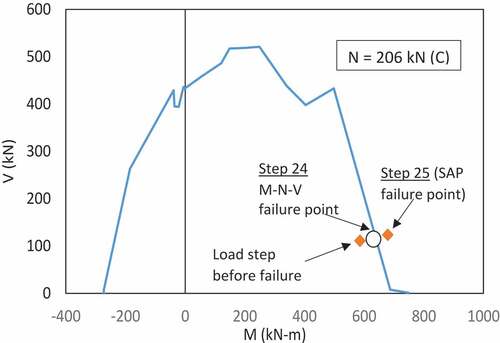
In addition to the impact of axial force on plastic moment capacity of RC members, it is well known that plastic hinge capacity is also affected by M-V interaction as noted in Section 1. SAP2000 considers flexural and shear failures separately and lacks the capability of failure determination through M-N-V interaction. Therefore, the internal forces in beam B-8 at load step 25 were compared to beam capacity with M-V interaction as determined from software Response-2000 following the procedure outlined in Sections 3.2 & 3.3. depicts the M-V capacity diagram for beam B-8 at this step from SAP2000. It can be observed that the internal forces are plotted outside the capacity envelope and therefore the beam had failed due to M-V interaction before reaching the pure flexural capacity. Therefore, internal forces at the previous step (# 24) were found from SAP2000 and plotted on the M-V capacity curve. It was noted that the plotted point was within the M-V curve. Therefore, load at step 24 (i.e., 75.7%) was taken as the failure load for this stage of loading.
Figure 9. M-V envelope of beam B-8 and actual failure load step
Stage 2 of the analysis was continued after removing the failed beam B-8 at the first floor from the structure. Beams CB-3 & B-2 at the first floor developed several plastic hinges and failed immediately after running the analysis as shown in without any increase in the applied factored load. The failure of beams CB-3 & B-2 was confirmed by following the same procedure as described earlier for beam B-8. Hence, the left portion of the structure collapsed progressively at 75.7% of the total load for this scenario. After removal of all failed beams, the structure sustained 100% of the factored load without developing any new plastic hinges which was indicative that progressive collapse was limited to the area bounded by the failed beams only. Estimate of the collapse area in each scenario is presented in the next section.
Figure 10. Formation of plastic hinges in the 2nd Stage of the 1st Scenario analysis
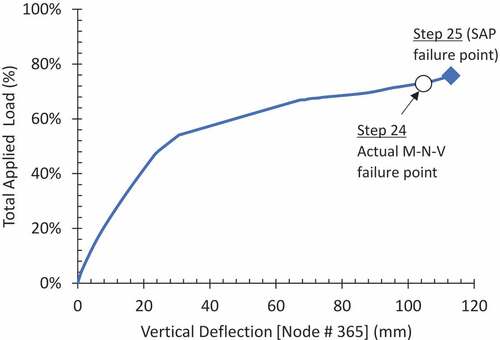
The relation between the applied load and the vertical deformation of node no. 365, which is directly above the removed column, is shown in until the application of 75.7% of total load. The vertical deflection noted at failure was less than 20% of the beam depth and such limited vertical deflection was insufficient to initiate catenary action (Lew et al., Citation2011; Orton, Citation2007; Xiao & Hedegaard, Citation2018). Therefore, it was reasonable to assume that the structure will collapse without any increase in applied load due to the catenary action. This observation held true for subsequent scenarios as well and validated the assumption made in Section 3.4 about applicability of the catenary action.
Figure 11. Total applied Load vs Vertical Deflection for Scenario 1
(ii) Scenario 2—edge column removal
Non-linear push-down analysis was carried out for scenario 2 in the similar manner as for scenario 1. Full application of the factored load in an incremental manner did not happen and the analysis was terminated at step no. 418, after application of 79.5% factored load, due to formation of sufficient number of plastic hinges and instability in the 3D FEM model. Beams B-8 at various stories were highlighted at the end of SAP2000 non-linear push-down analysis to have developed plastic hinges based on flexural capacity alone. Therefore, internal forces and capacity of these beams were investigated based on M-V interaction analysis done in Response 2000 to establish the actual failure load and loading step.
It is to be noted that beams B-8 were part of the Vierendeel frame in the first load redistribution mechanism for this scenario as depicted in . Beams B-8 on the lower floors had significant amount of axial force as noted in . Therefore, M-ϕ curves for beams B-8 with different level of axial force were re-computed and are depicted in .
The re-computed M-ϕ relationships for beams B-8 were utilized to establish the failure sequence based on M-V interaction curves for beam B-8 by comparing the M-V internal force pair with the M-V capacity diagram shown in . It was determined that the beam B-8 located at the 2nd floor was the first one to fail as it had the maximum tensile axial force of 154 kN. This beam failed at step number 224 when the total applied load was 56.8%. The load was significantly less than the value at which SAP2000 terminated the analysis due to formation of flexure-only plastic hinges (i.e., 79.5%) as depicted in . This indicates that ignoring the M-V interaction can significantly over-estimate the failure load. Similar backtracing of internal forces indicated failure of beams B-8 at the 3rd, 4th and 1st floor at load steps 238, 291 and 332, respectively. depicts the sequence of failure as well as deflection of the node from which the column was removed. Beam B-8 on the first floor failed in the last as it had significant amount of axial compression that improved its M-ϕ capacity. Continuous beam, CB-1 at the first floor failed soon after failure of beam B-8 at the first floor at load step 335 when the total applied load was 67.6%.
Figure 12. M-V interaction diagram for scenario 2 and tracing of beam B-8 failure at various floors
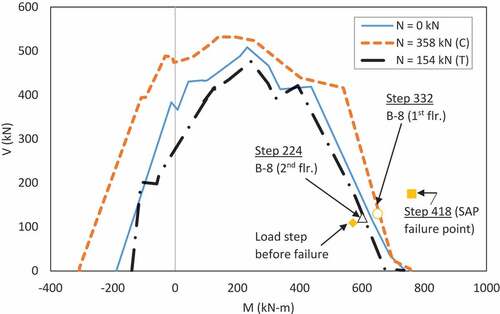
Figure 13. Deflection of node # 259 and failure sequence of various beams - Scenario 2
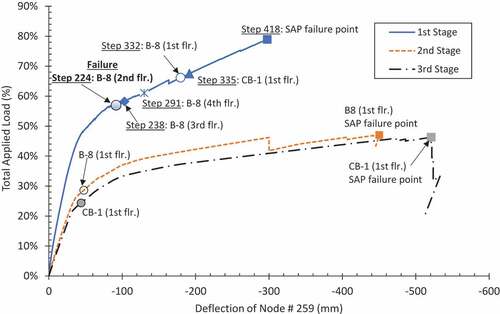
After establishing the sequence of beam failure during stage 1 of the loading, the failed members were sequentially removed from the model in the next stages of analysis. In the 2nd stage, beams B-8 at 2nd, 3rd and 4th floor were removed and the pushdown analysis was started again. It was noticed that the analysis was terminated in SAP2000 after application of 46% of total factored load and the corresponding load at failure in Beam B-8 at the first floor after taking M-V interaction into account was 29%. As the load failed to increase beyond the first stage (in fact it was even lower than the first stage loads), this indicated immediate failure of beam B-8 at the first floor. The analysis stage is depicted in and indicates large deformations of node 259.
In the third stage of analysis, beam B-8 at the first floor was also removed. The analysis was terminated at 46% of the total factored load in SAP2000 and beam CB-1 actually failed at 25% of the applied load under M-N-V interaction. This indicated failure of beam CB-1 at the first floor as well as subsequent upper floors. This means that the total load sustained in this scenario was 56.8% as sustained in the 1st stage.
(iii) Scenario 3—corner column removal
In stage 1 of the analysis for this scenario, SAP2000 indicated failure of beams B-3 and B-7 at step 78 (57.3% load) as shown in load-deformation response of node number 290 in . However, beam B-3 failed at step 41 when only 20.6% of the total factored load was applied when M-V interaction was taken into account as depicted in (a). Beam B-7 failed immediately after beam B-3 was removed from the structure due to loss of support.
Figure 14. Deflection of node # 290 and beam failure in stages 1 and 2—Scenario 3
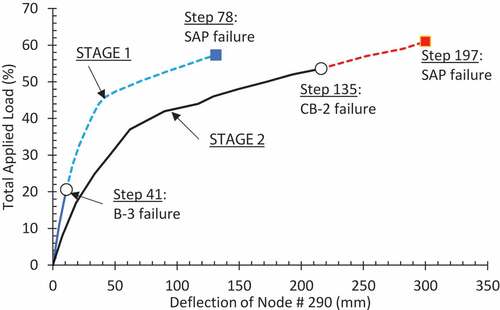
Figure 15. M-V interaction diagrams and tracing of failure point in beams B-3 and CB-2 for scenario 3
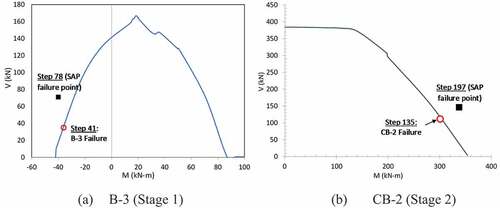
Stage 2 of the pushdown analysis was continued after removal of beams B-3 and B-7. The analysis stopped at 61.0% of the total factored load at step no. 197 indicating failure in beam CB-2 as shown in . Therefore, capacity of beam CB-2 was investigated with M-V interaction at prior load steps to find the failure load step and value of the failure load for beam CB-2. It was found that beam CB-2 reached its ultimate capacity at step no. 135 when the total factored applied load was 53.6% as depicted in (b).
(iv) Scenario 4—corner column removal
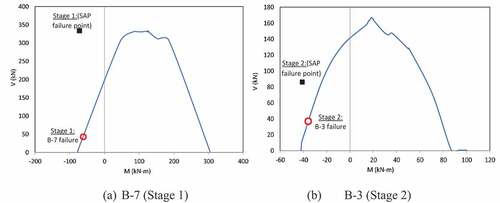
This scenario was investigated to compare the impact of inclusion of moment frames (discussed in Section 5) around the corner column on the progressive collapse performance. The chosen column was located at grid G-2 as shown in . Beam B-7 was the first to fail in stage 1 of loading at 80% of total load according to SAP2000 as depicted in . However, comparison with M-V diagram of the beam, shown in ) indicated the failure at a much lower (9%) of the total load. Stage 2 of the loading was analyzed after removal of beam B-7 and beam B-3 reached its ultimate capacity at 40% of the total load according to SAP2000 as shown in . However, beam B-3 failed at 23% of the load when M-V interaction was taken into account as shown in ). Subsequent stages of loading (i.e. 3, 4 and 5) with SAP2000 failure points and actual failure with M-V interaction are depicted in . The results showed that the interior beam B-5 failed at 46.7% of the total load (stage 3), followed by exterior beam B5 (stage 4) at 53.4% and beam B2 at 63.3% (stage 5) of the total factored load considering M-V interaction. After removal of all failed beams, the structure sustained 100% of the factored load without developing any new plastic hinges which was indicative that progressive collapse was limited to the area bounded by the beams failing in the described load stages only.
Figure 16. Deflection of node 252 and beam failure in various stages of loading—Scenario 4
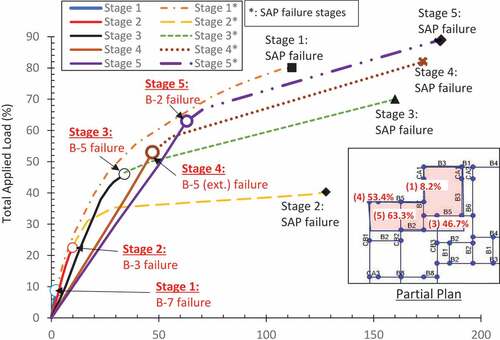
Figure 17. M-V interaction diagrams and failure points in beams B-7 and B-3 for scenario 4
4.3.4. Estimation of collapsed area
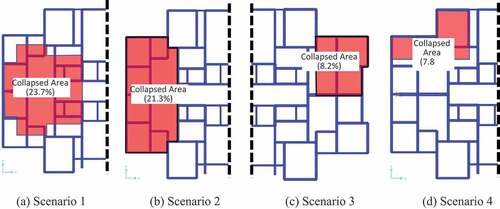
presents the visual depiction of collapsed area in each scenario of column removal based on the area bounded by the beams failing in various stages of loading in each scenario. The estimated collapsed area was 23.7, 21.3, 8.2, and 7.8% for scenarios 1 to 4, respectively.
Figure 18. Partial plans showing collapsed areas for various column removal scenarios
5. Redesign for wind load and re-evaluation of progressive collapse potential
This section deals with the progressive collapse performance of the building after it was redesigned to include a lateral load resisting system for wind loads followed by comparison of its performance with the original building. Last sub-section presents findings related to the effect of ignoring M-N-V interaction in plastic hinges on the collapse load for the original and the redesigned building.
5.1. Redesign for wind load
It was pointed out in the introduction that based on the current design practices, buildings up to 12 stories are designed only for gravity loads and no provisions are made for lateral load design due to wind forces. As a result of this design practice, most of the beams were simply supported with no framing action with the columns. This was one of the reason that the building was found to be in a high risk of progressive collapse as demonstrated in Section 4.
The building was re-designed considering lateral wind load according to ASCE 7–05 for a basic wind design speed of 40 m/s with an exposure category of B and importance factor of 1.0. Lateral load resisting system consisting of ordinary reinforced concrete moment frames and a global drift limit of h/300 was adopted for their design. A symmetric lateral load resisting system was designed such that torsional moments were kept almost zero and there was no change in the location and dimensions of the existing beams and columns. Therefore, only the end conditions of beams were changed and the beam reinforcement was redesigned. shows the layout of the moment frames while provides a comparison between the original and redesigned top reinforcement in beams in the rigid frames. There was no change in the bottom reinforcement. Columns that became a part of the moment frames were checked for the additional wind load combination and were found to have adequate strength.
Figure 19. Plan view of moment frames for lateral wind load
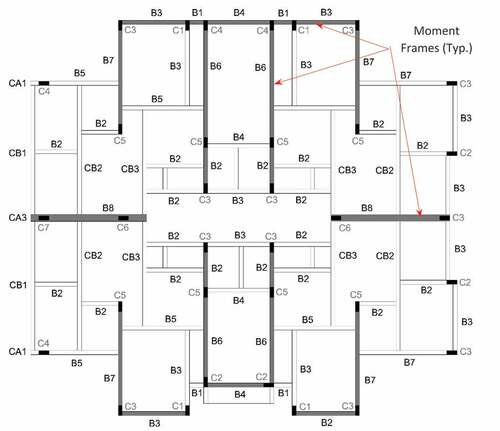
Table 1. Reinforcement details before and after providing rigid frames
5.2. Progressive collapse assessment of the redesigned building
Progressive collapse potential for the redesigned building was carried out for the same four scenarios as reported in Section 4 and the results were compared with the original design. The failure loads were determined by considerring M-N-V interaction in plastic hinges following the procedure adopted in Section 4 and thier details are omitted herein for the sake of berivity. A brief description of the investigated column removal scenarios is presented below.
5.2.1. Scenario# 1: Removal of internal column
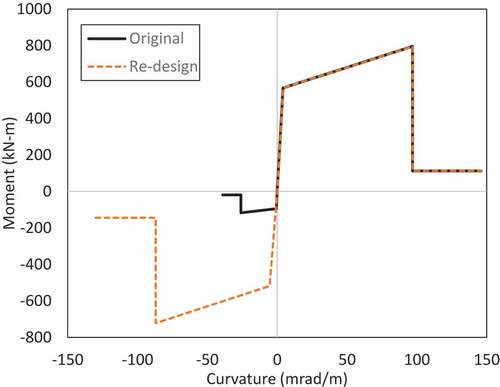
For scenario# 1, i.e. removal of the internal column, the re-designed structure resisted 100% of the factored load with no plastic hinge reaching the ultimate capacity for any of the members and no collapsed area. Load redistribution in this scenario was mainly dependent on the performance of beam B-8. Beam B-8 was now a part of the rigid frame and its negative moment capacity was increased due to the provision of fixed beam ends as compared to the simply supported ends in the original design as shown in .
Figure 20. Comparison of FEMA plastic hinge properties of original and redesigned beams B-8
5.2.2. Scenario# 2: Removal of the edge column
There were two load redistribution mechanisms in this scenario as discussed in Section 4. The first mechanism depended on the performance of beam B-8 while the other on beam CB-1. Beams B-8 were redesigned as part of the moment frames to resist lateral wind loads while no redesign was carried out for beams CB-1. Due to the enhanced design of beams B-8, the structure was capable of resisting 80% of the total factored load as compared to 56.9% in the original design. This enhanced performance also resulted in limiting the total collapsed area to 16.4% form 21.3% in the original design.
5.2.3. Scenario# 3: Removal of the corner column
In the third scenario, that incorporated removal of a corner column, the benefit of providing rigid frames was almost negligible as the total factored load increased from 53.6 to 58.2% only. The reason for this inadequate performance was the location of the corner column that did not include any moment frame in the redesigned structure. The slight enhancement in the load capacity was due to the increase in capacity of beam B-8 that provided the intermediate support for continuous beam CB-2. There was no change in the collapsed area as compared to the original design.
5.2.4. Scenario # 4 Removal of the corner column
In the redesigned building, beams B-3 and B-7 were part of the rigid frames. After removal of the corner column, these beams became cantilever beams and failed after application of 41.2% and 45.9% of the total factored load in load stages 1 and 2, respectively. The building analysis was re-run after removing these beams and interior beam B5 failed at 55.3% of the total load followed by exterior beam B5 at 59.5% and interior beam B2 at 68.2% of the total factored load in load stages 3 to 5, respectively. Collapsed area for the scenario remained at 7.8% as was in the original building design.
5.3. Comparison of progressive collapse performance of original and wind-designed building
presents a comparison of percentage load applied and the collapse area for the cases of original design and redesign with moment frames for wind lateral loads for the four column removal scenarios. The failure point reported herein is based on the combined M-N-V interaction in the plastic hinge. It can be noted that for scenarios 1 and 2, there is a marked improvement in the progressive load performance of the building both in terms of total factored load applied and reduction in collapse area for the case of wind designed building. However, improvement in the corner column removal scenarios 3 and 4 was only marginal. Further insight on this performance is presented in the next section.
Table 2. Progressive collapse performance of original and re-designed structure
5.3.1. Performance of corner column removal scenarios and key element design
As compared to the interior and edge column removal scenarios, no significant improvement was noted for building progressive collapse performance for the corner column removal scenarios 3 and 4. Lack of improvement in performance of scenario 3 is understandable as design of the beams framing into the corner column was not revised as this column and the framing beams were not part of the lateral load resisting system. However, inclusion of moment frames in both directions at corner column in scenario 4 resulted in only 5% improvement in the total applied load and no improvement in the collapse area. It was observed that although the total applied load in the first and the second stages of loading was significantly improved (from 8.2% to 41.2% and 22.5% to 45.9%), there was no significant increase in the final collapse load. Helmy et al. (Citation2012) and Abdelwahed et al. (Citation2018) rightly pointed out to adopt innovative solutions for improving progressive collapse resistance for the case of corner column loss. This means that other methods including the “key element design” concept (DoD, Citation2009) needs to be adopted for improving progressive collapse performance for the corner column removal scenarios.
The key element design concept was applied to beams B3 and B7 involved in scenario 4 and these beams were designed as intersecting cantilevers interconnected at the corner column location with appropriate design for flexure, shear and torsion in the beams as well as the corner knee joints. The beams were redesigned to carry all floor load without any support from the corner column. The function of the corner column in this redesign was only to transfer the lateral wind loads. Beam width was kept as in the original design (i.e. 200 mm) while beam depth was increased to 900 mm to cater for the revised loads and structural actions. Although increase in beam depth solved the structural problem but it interfered with the architectural functioning that required a reduction in window size. The consequences of reduced window size were to be resolved with the architect before adoption of this solution.
5.4. Effect of ignoring M-N-V interaction in plastic hinges
The effect of M-N-V interaction was ignored in the definitions of plastic hinges in SAP2000 which influenced the progressive collapse capacity of the building as demonstrated in Section 4. presents a comparison of the failure loads in various column removal scenarios for the two definitions of plastic hinge failure. Collapse load in the final stage only is reported in for scenarios with multiple load stages.
Table 3. Effect of M-N-V interaction in plastic hinges on collapse load
It can be noted that ignoring M-N-V interaction resulted in an over-estimation of the progressive collapse load of 4%, 39%, 14% and 80% for the origanl design and 0%, 21%, 36% and 44% for the revised design for scenarios 1 to 4 respectively. This over-estimation of the progressive collapse load led to an unconservative evaluation of the progressive load potential for the structure in majority of the SAP2000 analysis scenarios. Therefore, it is important that plastic hinge capacity should be determined using M-N-V interaction for the case of concentrated plastic hinges in SAP2000 (or similar software) for a realistic estimate of the progressive load. It is also noted in that the effect of M-N-V interaction in reducing the collapse load is less for the redesigned building for all scenarios except #3. This reduction is attributed to the increased capacity of the members in the redesigned building.
6. Conclusions
Progressive collapse analysis of a mid-rise gravity-load designed reinforced concrete building is presented using the ALP method. Highlight of the presented procedure is an integration between FEM software, SAP2000, and R/C section analysis program, Response 2000, through which M-N-V interaction in plastic hinges was considered for the prediction of the final collapse loads due to various column removal scenarios used for simulating progressive collapse of the building. The following conclusions are drawn from this study:
3D FEM modeling and non-linear static push-down analysis in SAP2000 software was used to assess the progressive collapse potential of a typical gravity-load designed mid-rise reinforced concrete building with open ground floor. It was found that potential of progressive collapse in this type of buildings was high based on GSA guidelines. The collapse area ranged from 8% to 24% for various scenarios of sudden column removal.
Inclusion of M-N-V interaction to determine failure capacity of concentrated plastic hinges was found to be an important factor in correctly predicting the progressive collapse load for members with limited displacement capacity and lack of catenary action. Compressive axial loads generally increased the yield moment capacity while tensile loads had the opposite effect. However, presence of both types of axial loads decreased the ultimate curvature as well as ultimate moment capacity. M-N-V interaction resulted in a significant decrease (up to 80% for some scenarios) in the progressive load capacity of the building. It was demonstrated that section analysis software like Response-2000 can be effectively utilized for this purpose in conjunction with general FEM analysis software.
The study demonstrated that the progressive collapse performance of the buildings located in a non-seismic zone, could be improved by providing ordinary moment resisting frames that satisfies the drift limits for wind loads. Redesign of the building for wind load reduced the collapse area to zero for the interior column removal scenario after application of full factored load. Improvement in reduction of collapse area was 30% for the edge column removal scenario accompanied by an increase of 33% in the total factored load sustained by the building. However, collapse area and sustained loads did not show significant improvement for corner column removal scenarios even when the removed column was part of the lateral load resisting system in both orthogonal directions.
Vierendeel frame action along the height of the building and redistribution of loads through structural framing members of the same floor were the main actions that were instrumental in redistribution of floor loads and attaining equilibrium of forces after sudden removal of columns for the interior and edge column removal scenarios. Vierendeel frame action was observed to be weak for the case of corner column removal due to the structural configuration (simply supported edge beams) and load redistribution was mainly through horizontal structural framing members (i.e. beams and girders).
Key element design concept was successfully used to improve the progressive collapse performance of the building in the case of corner column loss. However, the design resulted in increase of the beam depth that interfered with the architectural requirements.
Conflicts of Interest
The authors declare no conflict of interest.
Acknowledgements
Support of College of Graduate Studies, Kuwait University, Kuwait is gratefully acknowledged.
Additional information
Funding
Notes on contributors
Meshal A. Abdulsalam
Meshal Abdulsalam is a civil design engineer working at Kuwait National Petroleum Company. He got his Master degree in structural engineering from Kuwait University. Meshal’s major field of study is civil engineering and specialized in structural engineering. His passion in structural engineering is to explore the design and construction of mega structures. He is interested in structural dynamics, nonlinear analysis, FEM modeling, progressive collapse, reinforced concrete material modeling and codes & standards.
Muhammad Tariq A. Chaudhary
Muhammad Tariq Chaudhary is an academician and structural engineer currently working as a faculty member in the civil engineering department of Kuwait University. Dr. Chaudhary has doctoral and master’s degrees from University of Tokyo, Japan and University at Buffalo, New York, respectively. His industry experience spans design of highway bridges, industrial facilities, high-rise buildings, and large capacity storage tanks. His research interests include earthquake engineering, soil–structure interaction, structural health monitoring, and FEM modeling.
References
- Abdelwahed, B., Belkassem, B., & Vantomme, J. (2018). Reinforced concrete beam-column inverted knee joint behaviour after ground corner column loss-numerical analysis. Latin American Journal of Solids and Structures, 15(10), 10. https://doi.org/10.1590/1679-78254515
- Abdulsalam, M. A. (2019). Progressive collapse assessment of a gravity-load designed mid-rise reinforced concrete building, M.S. thesis, Department of Civil Engineering, Kuwait University.
- ACI. (2002). ACI 318-02, Building code requirement for structural concrete and commentary. American Concrete Institute Committee.
- Adam, J. M., Parisi, F., Sagaseta, J., & Lu, X. (2018). Research and practice on progressive collapse and robustness of building structures in the 21st century. Engineering Structures, 173, 122–27. https://doi.org/10.1016/j.engstruct.2018.06.082
- Al-Balhawi, A. L. I., & Zhang, B. (2018). Acceleration responses for tall reinforced concrete office buildings under wind loading. 6th European Conference on Computational Mechanics (ECCM 6), 11 – 15 June 2018, Glasgow, UK.
- ASCE. (2016). ASCE/SEI 7-16. Minimum design loads for buildings and other structures. American Society of Civil Engineers; Reston, VA.
- Bentz, E. C. (2000). “Response-2000: sectional analysis of reinforced concrete members”, PhD Thesis, Department of Civil Engineering, University of Toronto, 316 pp.
- Botez, M., Bredean, L., & Ioani, A. M. (2016). Improving the accuracy of progressive collapse risk assessment: Efficiency and contribution of supplementary progressive collapse resisting mechanisms. Computers & Structures, 174, 54–65. https://doi.org/10.1016/j.compstruc.2015.11.002
- Brunesi, E., & Parisi, F. (2017). Progressive collapse fragility models of European reinforced concrete framed buildings based on pushdown analysis. Engineering Structures, 152, 579–596. https://doi.org/10.1016/j.engstruct.2017.09.043
- Byfield, M., Mudalige, W., Morison, C., & Stoddart, E. (2014). A review of progressive collapse research and regulations. Proceedings of the Institution of Civil Engineers-Structures and Buildings, 167(8), 447–456. https://doi.org/10.1680/stbu.12.00023
- Collins, M. P., & Mitchell, D. (1991). Prestressed concrete structures. Prentice Hall, Englewood Cliffs, NJ. 766 pp.
- CSI. (2019). SAP2000 - Integrated software for structural analysis & design. Computers & Structures Inc.
- Dang‐Vu, H., Lee, D. H., Shin, J., & Lee, K. (2020). Influence of shear‐axial force interaction on the seismic performance of a piloti building subjected to the 2017 earthquake in Pohang Korea. Structural Concrete, 21(1), 220–234. https://doi.org/10.1002/suco.201800291
- DoD. (2009). Design of buildings to resist progressive collapse. In Unified Facilities Criteria, UFC (Vol. 4, pp. 23–30). Department of Defense.
- FEMA. (2000). FEMA-356, Pre-standard and commentary for the seismic rehabilitation of buildings. Prepared by American Society of Civil Engineers for Federal Emergency Management Agency.
- Gerasimidis, S., & Baniotopoulos, C. C. (2011). Evaluation of wind load integration in disproportionate collapse analysis of steel moment frames for column loss. Journal of Wind Engineering and Industrial Aerodynamics, 99(11), 1162–1173. https://doi.org/10.1016/j.jweia.2011.09.009
- GSA. (2016). Progressive collapse analysis and design guidelines for new federal office buildings and major modernization projects (p. 2016). U.S. General Services Administration.
- Hammoudah, S. M., Chaudhary, M. T., & Essawy, A. S. (2018). Experimental investigation of interface stiffness between concrete masonry infill and reinforced concrete frames. Engineering Structures, 171, 779–793. https://doi.org/10.1016/j.engstruct.2018.06.035
- Hayes, J. J., Woodson, R., Pekelnicky, S. C., Poland, R. G., Corley, C. D., G, W., & Sozen, M. (2005). Can strengthening for earthquake improve blast and progressive collapse resistance? Journal of Structural Engineering. 131(8), 1157–1177. https://doi.org/10.1061/(ASCE)0733-9445(2005)131:8(1157)
- Helmy, H., Salem, H., & Mourad, S. (2012). Progressive Collapse assessment of framed reinforced concrete structures according to UFC guidelines for alternative path method. Engineering Structures, 42, 127–141. https://doi.org/10.1016/j.engstruct.2012.03.058
- Ioani, A. M., Cucu, H. L., & Mircea, C. (2007). Seismic design vs. progressive collapse: a reinforced concrete framed structure case study. 2007. In Fourth international structural engineering and construction conference (ISEC-4), Melbourne, Australia.
- Khan, F. R. 1967. Current trends in concrete high-rise buildings. A. Coull & B. S. S. Pergamon Eds.., April 1966. Tall buildings. the proceedings of a symposium on tall buildings with particular reference to shear wall structures, held in the department of civil engineering. University of Southampton. 571–590.
- Kiakojouri, F., De Biagi, V., Chiaia, B., & Sheidaii, M. R. (2020). Progressive collapse of framed building structures: Current knowledge and future prospects. Engineering Structures, 206, 110061. https://doi.org/10.1016/j.engstruct.2019.110061
- Lee, D. H., & Elnashai, A. S. (2002). Inelastic seismic analysis of RC bridge piers including flexure-shear-axial interaction. Structural Engineering and Mechanics, 13(3), 241–260. https://doi.org/10.12989/sem.2002.13.3.241
- Lew, H. S., Bao, Y., Sadek, F., Main, J. A., Pujol, S., & Sozen, M. A. (2011). An experimental and computational study of reinforced concrete assemblies under a column removal scenario. In NIST Technical Note 1720 (pp. 104). National Institute of Standards and Technology, Gaithersburgh, MD.
- Li, Y., Lu, X., Guan, H., Ren, P., & Qian, L. (2016). Probability-based progressive collapse-resistant assessment for reinforced concrete frame structures. Advances in Structural Engineering, 19(11), 1723–1735. https://doi.org/10.1177/1369433216649385
- Lin, K., Li, Y., Lu, X., & Guan, H. (2017). Effects of seismic and progressive collapse designs on the vulnerability of RC frame structures. Journal of Performance of Constructed Facilities, 31(1), 04016079. https://doi.org/10.1061/(ASCE)CF.1943-5509.0000942
- Mander, J. B., Waheed, S. M., Chaudhary, M. T. A., & Chen, S. S. (1993). Seismic performance of shear-critical reinforced concrete bridge piers, Report No. NCEER-93-0010, National Center for Earthquake Engineering Research, University at Buffalo.
- Mohamed, O. A. (2006). Progressive collapse of structures: Annotated bibliography and comparison of codes and standards. Journal of Performance of Constructed Facilities, 20(4), 418–425. https://doi.org/10.1061/(ASCE)0887-3828(2006)20:4(418)
- NIST. (2017). Guidelines for nonlinear structure analysis for design of building: part i – general, NIST GCR 17-917-46v1 prepared for applied technology council. National Institute of Standard and Technology.
- Oda, D. A. (2017). Wind design loads on high-rise reinforced concrete buildings in maysan province southern Iraq, International Journal of Innovative Research in Science, Engineering and Technology, 6 (7):12451–12471. https://doi.org/10.15680/IJIRSET.2017.0607001.
- Orton, S. L. (2007). Development of a CFRP system to provide continuity in existing reinforced concrete buildings vulnerable to progressive collapse. In Ph.D. dissertation (pp. 381). Univ. of Texas at Austin.
- Parisi, F., & Scalvenzi, M. (2020). Progressive collapse assessment of gravity-load designed European RC buildings under multi-column loss scenarios. Engineering Structures, 209, 110001. https://doi.org/10.1016/j.engstruct.2019.110001
- Popovics, S. (1970). A review of stress-strain relationships for concrete. ACI Journal, 67(3), 243–248.
- Recupero, A., D’Aveni, A., & Ghersi, A. (2005). Bending moment-shear force interaction domains for prestressed concrete beams. Journal of Structural Engineering, 131(9), 1413–1421. https://doi.org/10.1061/(ASCE)0733-9445(2005)131:9(1413)
- Ren, P., Li, Y., Guan, H., & Lu, X. (2014). Progressive collapse resistance of two typical high-rise rc frame shear wall structures. Journal of Performance of Constructed Facilities, 29(3), 04014087. https://doi.org/10.1061/(ASCE)CF.1943-5509.0000593
- Russo, G., Zingone, G., & Puleri, G. (1991). Flexure-shear interaction model for longitudinally reinforced beams.” ACI Structural Journal, 88(1), 60–68.
- Sagiroglu, S., & Sasani, M. (2014). Progressive collapse-resisting mechanisms of reinforced concrete structures and effects of initial damage locations. Journal of Structural Engineering, 140(3), 04013073. https://doi.org/10.1061/(ASCE)ST.1943-541X.0000854
- Salem, H. M, El-Fouly, A. K., & Tagel-Din, H. S. (2011). Toward an economic design reinforced concrete structures against progressive collapse. Engineering Structures, 33(12), 3341–3350. https://doi.org/10.1016/j.engstruct.2011.06.020
- Sasani, M. (2008). Response of a reinforced concrete infilled-frame structure to removal of two adjacent columns. Engineering Structures, 30(9), 2478–2491. https://doi.org/10.1016/j.engstruct.2008.01.019
- Tsai, M., & Lin, B. (2008). Investigation of progressive collapse resistance and inelastic response for an earthquake-resistant RC building subjected to column failure, Engineering Structures, 30(12),3619–3628. https://doi.org/10.1016/j.engstruct.2008.05.031.
- Vecchio, F. J., & Collins, M. P. (1986). The modified compression-field theory for reinforced concrete elements subjected to shear. ACI Journal, 83(2), 219–231.
- Wagner, H. (1929). Ebene blechwandträger mit sehr dünnem stegblech (metal beams with very thin webs). in zeitschrift für flugtechnik und Motorloftschiffahr (Magazine for Flight Technology and Motorized Aviation), 20(8), 8–12, Berlin.
- Xiao, H., & Hedegaard, B. (2018). Flexural, compressive arch, and catenary mechanisms in pseudostatic progressive collapse analysis. Journal of Performance of Constructed Facilities, 32(1), 04017115. https://doi.org/10.1061/(ASCE)CF.1943-5509.0001110
- Yagob, O., Galal, K., & Naumoski, N. (2009). Progressive collapse of reinforced concrete structures. Struct. Eng. Mech, 32(6), 771–786. https://doi.org/10.12989/sem.2009.32.6.771
- Yi, W., He, Q., Xiao, Y., & Kunnath, K. (2008). Experimental study on progressive collapse resistant behaviour of reinforced concrete frame structures. ACI Structural Journal, 105(4), 433–439.
- Yu, J., Luo, L., & Li, Y. (2018). Numerical study of progressive collapse resistance of RC beam-slab substructures under perimeter column removal scenarios. Engineering Structures, 159, 14–27. https://doi.org/10.1016/j.engstruct.2017.12.038
Appendix
The Appendix contains three tables detailing the size and reinforcement of structural elements of the building.
Table A1. Column sizes (in cm) and reinforcement details
Table A2. Dimensions and reinforcement details in simply supported beams
Table A3. Dimensions and reinforcement details in continuous beams