
 ?Mathematical formulae have been encoded as MathML and are displayed in this HTML version using MathJax in order to improve their display. Uncheck the box to turn MathJax off. This feature requires Javascript. Click on a formula to zoom.
Abstract
This paper presents simultaneous radial distribution network reconfiguration and switched capacitor bank allocation to enhance the performance of distribution systems. The paper primarily targets minimizing active and reactive power losses and improving the voltage profile of all buses. In the paper, network re-structuring and switched capacitor bank integration are performed to optimally allocate and size switchable capacitor banks and to select the optimal structure of the network. Additionally, a modified particle swarm optimization (MPSO) algorithm is incorporated for both network reconfiguration and optimal capacitor bank allocation, considering different loading condition scenarios such as light, normal and heavy load. The simulation results show that the voltage deviation and active and reactive power losses are substantially reduced for all loading scenarios when the proposed method is applied. This shows that MPSO algorithm is effective in maintaining the bus voltage profile within the allowable threshold value and in significantly minimizing the corresponding power losses. Furthermore, the performance comparison of MPSO and conventional particle swarm optimization in terms of voltage profile and active and reactive power loss has been conducted, and it has been found that the proposed method (MPSO) is more effective to enhance the performance of radial distribution systems.
PUBLIC INTEREST STATEMENT
In this paper, automatic distribution system automation is performed to significantly minimize the line losses and to enhance the bus voltage profile using simultaneous network reconfiguration and switched capacitor bank allocation. One of the metaheuristic optimization algorithm, so-called selective particle swarm optimization, is also incorporated to identify the optimal location and size of the required capacitor bank along with the optimal structure of the network. The proposed method is tested using IEEE-33 radial network, considering a variety of loading conditions such as light, normal, and heavy loading conditions. The results obtained using the proposed algorithm in MATLAB software are encouraging as it substantially reduces both the active and reactive power losses and keeps all the node voltage above the minimum threshold value. Furthermore, the performance comparison of modified particle swarm optimization and conventional PSO in terms of voltage profile and active and reactive power loss is conducted, and it has been found that the proposed method (MPSO) is more effective.
1. Introduction
Nowadays, electricity has become the backbone for sustainable development of the world, and it has a substantial impact for the betterment of human life. Hence, many scholars have been proposing effective techniques to reach electricity in the most optimal and cost-effective way. Mostly, generation stations are located very far from the consumers, and hence, the generated power from the generating station should be transmitted through a high voltage transmission system to a distribution system and finally to end customers, ideally without disturbances and losses. Practically, the generated power at the generating station does not reach entirely to the end customers because of generation losses, transmission losses, distribution losses, and other types of technical losses (Tahir, Latiff, Alam & Mazliham, Citation2018). However, significant power is lost at the distribution level as compared with the power losses at the transmission and generation levels. This is due to the fact that the voltage at the distribution level is low, whereas the current is high which in turn causes substantial power losses. Additionally, the resistance of distribution lines (proportional to power losses) is extremely considerable when compared with transmission line resistance counterparts (Rajalakshmi et al., Citation2017).
There are basically three types of distribution system structures such as radial, loop and network/ring to reach electricity to the end consumers. However, the first distribution system structure is quite common in almost all developing countries though it has numerous associated drawbacks. The radial configuration of distribution systems is also widely used, especially for the supply of low-load consumers and remote areas ((xxxx), Citation2018; Landeros, Citation2018). The main advantages of this configuration are the simplicity in operation and design along with the reduced construction cost in contrast to the loop and meshed configurations. On the other hand, such configuration has considerable power losses and low reliability in the case of faults because downstream nodes are easily isolated since all buses are supplied from only one side (Kouzou & Mohammedi, Citation2015; CitationKargar and Maleki (yyyy)). Hence, the network should be optimally structured to have very low power loss and improved voltage profile.
There are several techniques to enhance the performance of distribution system from which network reconfiguration is one of the best alternatives, especially for radial type of structure. It is the process of changing the distribution network topology by altering the switching events of sectionalizing and/or tie switches as the load varies with time (Kouzou & Mohammedi, Citation2015; Zhang et al., Citation2012). It has numerous advantages such as reduction of power loss, voltage profile improvement, system reliability and security improvement, and feeder overloading alleviation. However, it may result in high power losses and low voltage profile if the network is not reconfigured optimally (Niazi & Lalwani, Citation2017; Ma et al., Citation2012), and hence, artificial intelligence optimization techniques must be incorporated to restructure the topology of the network, thereby the reliability and security can be also improved (CitationKargar and Maleki (yyyy); Rezaei & Vakilian, Citation2010).
Since a few decades ago, several methods have been proposed in numerous technical papers to solve distribution network problems. Meta-heuristic optimization algorithms, particularly particle swarm optimization (PSO) and genetic algorithms, were introduced by Kouzou and Mohammedi (Citation2015) for network reconfiguration in distribution systems. Rajalakshmi et al. (Citation2017) presented a new technique to alter distribution system topology using loss sensitivity factor (LSF) for deciding the best switch combinations. The objective of this study was to minimize resistive line losses and improve the voltage profile under normal operating conditions. Raut and Mishra (Citation2018) in 2017 suggested a new method, so-called graph theory-based genetic algorithm power distribution network reconfiguration for loss reduction. This technique was implemented on the IEEE 30-bus, 69-bus, 84-bus, and 114-bus distribution networks, and the results obtained are encouraging as compared to the previous research outputs. Nevertheless, its performance on voltage profile improvement and reactive power loss is not explicitly shown when the load varies with time.
The research works reviewed in Rajalakshmi et al. (Citation2017), Kouzou and Mohammedi (Citation2015), Zhang et al. (Citation2012), Raut and Mishra (Citation2018), and Sajir et al. (Citation2017) demonstrated that power loss and poor voltage profile substantially affect the performance of distribution systems. Therefore, several studies have used various approaches to minimize power losses in distribution systems, such as shunt capacitor placement, distributed generation (DG) integration, and network reconfiguration out of which the last approach has shown superior performance for loss minimization and voltage profile enhancement (Kumar, Citation2017); Esmaeilian & Fadaeinedjad, Citation2013; Esmaeilian & Fadaeinedjad, Citation2015). In all these studies, PSO was commonly applied to identify the optimal switch combinations in the system. However, a new stochastic search algorithm called modified particle swarm optimization (MPSO) for power system application, in particular for utility grids, was proposed in 2016, but it attempts to improve the performance of the system during normal load condition only (Tahir et al., Citation2018).
Capacitor placement in distribution systems also plays a vital role to reduce the power losses and enhance the voltage profile at various loading conditions. It is mostly used at the distribution level for compensation purpose as it can supply reactive power during heavily loaded cases and hence improve the voltage profile of the system. On top of that, capacitor bank integration close to the distribution level improves the power factor of the entire system along with mitigating transmission line overloading. This is the reason why reactive power compensation has to be a local phenomenon. However, it may also cause overvoltage problem and high-power losses if its optimal location and size are not optimally determined (Alrashidi et al., Citation2010; Shetty & Ankaliki, Citation2019; Tahir et al., Citation2018).
The problems in power distribution system to improve its performance are size and location determination of capacitors and DGs and/or optimal combination of tie switches in reconfiguration process. Details of PSO, particularly for power system application, can be accessed in Alrashidi et al. (Citation2010) and Shetty and Ankaliki (Citation2019). Therefore, this study focuses on the application of MPSO to search a selected space for the best switching conditions and identify the optimal locations of switched capacitors, which in turn can result in minimum possible line losses and improved voltage profile.
It has been shown previously that several researchers have proposed different techniques to solve the power loss and poor voltage profile problems in distribution systems. Among these, capacitor placement, network reconfiguration, DG integration, and simultaneous network reconfiguration and switchable capacitor insertion are the most effective mechanisms to reduce the active and reactive power losses and maintain the voltage profiles of all the nodes within the acceptable IEEE range. Previously done researches usually consider optimal capacitor placement and optimal network reconfiguration techniques separately, and much effort has been contributed to solve both optimal capacitor bank placement and network reconfiguration techniques using different modern optimization algorithms with various multi-objective functions.
All in all, previously done researches did not explore much about the impact of simultaneous capacitor allocation and network reconfiguration on power factor though it has a substantial impact on the performance of the distribution system. Therefore, this research work mainly focuses on reduction of power losses, enhancement of voltage profile, and power factor of the system.
2. Backward and forward load flow analysis
Forward/backward sweep-based power flow algorithms generally take advantage of the radial network topology and consist of forward and/or backward sweep processes (Ramesh et al., Citation2009). The forward sweep is mainly the node voltage calculation from the sending end to the far end of the feeder and laterals, whereas the backward sweep is primarily the branch current and/or power summation from the far end to the sending end of the feeder and laterals. The forward and/or backward load flow analysis technique can be briefly discussed using the following n-bus radial distribution network (Ramesh et al., Citation2009) as depicted in . As it is shown in the figure, the current flows from the substation to the downstream nodes, and hence, the conventional load flow techniques such as Gauss–Seidel and Newton–Raphson iterative methods are inconvenient to conduct distribution load flow analysis since they cannot converge in few iterations.
Figure 1. Single-line diagram of the main feeder of distribution system
shows branch “k” between a bus “i” and bus “i + 1” which represents active power (Pi+1) and reactive power (Qi+1) that can be calculated by using backward sweep.
The voltage magnitude and its angle at each node can be calculated using the forward direction as already shown in the following equation.
The real and reactive power loss in the distribution line can be formulated as,
The proposed load flow algorithm is briefly presented in the following flow chart (). As it is shown, the distribution system data like line resistance and reactance and active and reactive power will be first read and then the iteration begins. Following will be the calculation of effective real and reactive power flows in each branch line using backward load flow sweep. Here, the currents are also determined using the same procedures of power calculations. After the currents and line flow active and reactive power are determined, the voltage of each nodes beginning from the substation will be calculated using forward load flow propagation. Finally, the active and reactive power losses of the system will be evaluated if the voltages at each node converges to the predefined limit.
Figure 2. Flowchart of the proposed load flow algorithm
3. Proposed methodology
In this research, the IEEE 33-bus radial distribution test system with time-varying loads is considered as a case study which consists of 33 buses and 32 branches (CitationAdegboyega Gabriel and Franklin (yyyy); Sedighizadeh et al., Citation2014). Each bus has a voltage level of 12.66 kV. The network is fed by a substation (root node), and the total active and reactive power of the system are 3.715 MW and 2.3 MVAr, which are connected to 32 buses at different power factors, respectively (Kumar, Citation2017). The single-line diagram of the test system is shown in (Dixit et al., Citation2017; Sedighizadeh et al., Citation2014).
Figure 3. Single-line diagram of the test system with basic loops. For the system shown above, the basic loops are formulated as depicted in the following manner
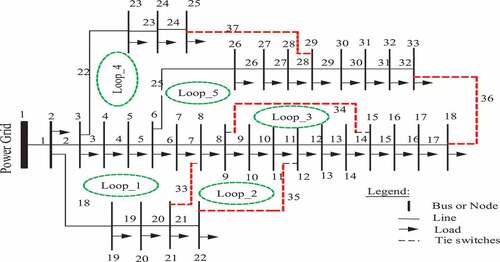
Loop1: (Rajalakshmi et al., Citation2017; Landeros, Citation2018; Kouzou & Mohammedi, Citation2015; CitationKargar and Maleki (yyyy); Kumar, 2017; Zhang et al., 2012; Esmaeilian and Fadaeinedjad, 2015; Tahir et al., 2018; Alrashidi et al., 2010), Loop2: (Niazi & Lalwani, Citation2017; Ma et al., 2012; Rezaei and Vakilian, 2010; Raut & Mishra, Citation2018; Shetty & Ankaliki, Citation2019 33 35), Loop3: (Ab Ghani et al., Citation2014 1314 34), Loop4: (Ramesh et al., Citation2009; CitationAdegboyega Gabriel and Franklin (yyyy); Sedighizadeh et al., 2014; Dixit et al., 2017; Rao et al., 2013; Baran and Wu, 1989; System et al., 2013 37), Loop5: (Pavani and Singh, 2014; Nasir et al., (yyyy); Vita, 2016; Dinakara, 2013; Tapia-Juárez and Espinosa-Juárez, 2015; Shuaib et al., 2015; Shuaib et al., 2014 36).
The study considers modern optimization technique, namely, MPSO algorithm, to optimally locate and size the required capacitor banks and determine the combination of switches to be opened and closed. The search space is also determined by using two methods which are sensitivity analysis factor and PSO. The following sections briefly discuss capacitor bank size calculation and sensitivity factor analysis for optimal location identification.
3.1. Capacitor bank size determination
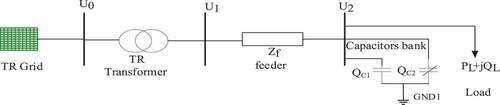
Capacitor banks integrated into the distribution system can be either fixed or switched as shown in . However, the switched capacitors are more convenient for time-varying loads since their corresponding size can be altered following the load variations, whereas the fixed capacitors have only limited sizes and it is impossible to increase or decrease the required size (kVAr) as the load varies. Computing the capacitive size is highly necessary to reach a higher power factor in distribution systems which can be done using the following formula (Rao et al., Citation2013). The power factor improvement of the system when the capacitor and the network reconfiguration are applied is also calculated using the following formula.
Figure 4. Representation of capacitor placement in a distribution line
The required capacitor bank is also determined by the following formula.
3.2. Sensitivity factor analysis
Computation of real power loss in branch “k” can be formulated as:
From the above equation, the LSF can be calculated as shown below (Niazi & Lalwani, Citation2017).
The allocation of candidate buses is determined using voltage sensitivity factor which is the ratio of the base case voltage magnitudes at buses V(i) and the minimum limit of the IEEE voltage level (0.95 p.u.) as shown in the following equation (Niazi & Lalwani, Citation2017).
4. Problem formulation
A multi-objective optimization algorithm is used in this research which incorporates real power losses, reactive power losses, and cumulative voltage deviation. The problem formulation for network reconfiguration and capacitor placement when considered independently is summarized in the following sections.
4.1. Problem formulation for network reconfiguration
The sum of the individual objective function such as real power loss, reactive power loss, and cumulative voltage deviation is merged together to get one multi-objective minimization function as shown below.
The above equation can be rearranged to get a more expanded multi-objective optimization problem as illustrated in the following equation.
4.2. Problem formulation for optimal capacitor bank placement
The objective function for capacitor size and location determination is formulated as follows.
5. Modified particle swarm optimization
One of the metaheuristic optimization algorithms, so-called MPSO, is applied to minimize the above formulated multi-objective optimization function. In the conventional PSO, the search space is a real-valued space, whereas in the case of MPSO, the search space is a set of 0’s and 1’s.
The velocity of the particle in the proposed algorithm is updated using Equation 14, and evaluation of the particle swarm optimization is modified at several iterations. To achieve this change, the sigmoid transformation is considered. The ith particle position at a dimension “d” is a selective value which can be updated using Equation 15.
For i = 1, 2 … n & d = 1, 2 … m
In this study, the design variables are dependent on power loss minimization techniques such as,
6. Simulation results and discussion
The simulation results encompass comparison of different scenarios for both network reconfiguration and optimal allocation of switched capacitor banks in the test system. Subsequent is the presentation of each scenario considered in this research, and the sequential scenario area is also illustrated below.
● Base case: base case load flow results.
●Scenario-1: optimal capacitor placement and sizing alone.
●Scenario-2: optimal network reconfiguration alone.
●Scenario-3: simultaneous capacitor placement/sizing and network reconfiguration.
For test system, three load levels are considered: SLight = 0.5 p.u., SNormal = 1.0 p.u., and SHeavy = 1.3 p.u. (CitationKargar and Maleki (yyyy)), and duration of each load level is as follows: TLight = 1,000 h, TNormal = 6,760 h, and THeavy = 1,000 h: The weighting factors for real power loss, reactive power loss, and voltage deviation are also set equal (Wr = Wx = Wv = 0.3333).
6.1. Base case load flow results
The base case load flow analysis is performed using backward and/or forward load flow algorithm without integrating capacitor banks and applying network reconfiguration. The voltage profiles of each bus in the distribution lines are computed accordingly and presented in . The minimum voltage of the system at light load, normal load, and heavy load is 0.9583, 0.9130, and 0.8841 p.u., respectively. As it can be noted in the figure, the voltage profile of all nodes except the first five buses is below the minimum threshold values (0.95 p.u), and this implies that the far end customers frequently suffer from undervoltage problem. However, a sudden voltage change in all loading scenarios is shown when we go from bus 18 to bus 19, and this happens basically due to the fact that bus 19 is very close to the supplying substation as compared to bus 18 as shown in .
Figure 5. Base voltage profile of IEEE-33-bus distribution system
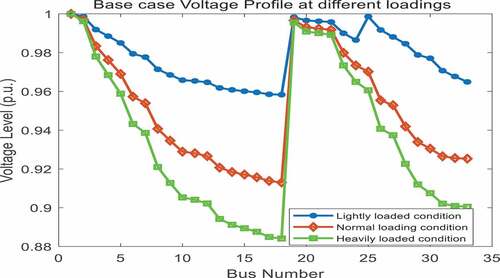
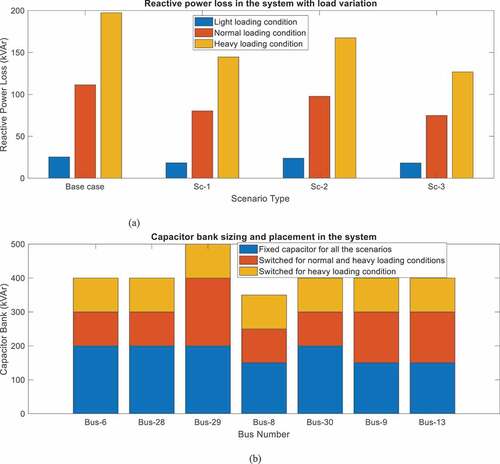
The base case active and reactive power losses of the system are also calculated and presented in . Accordingly, the total active power demand of the system during light, normal, and heavy load conditions is 1857.5, 3715, and 4829.5 kW from which 47.2, 202.4, and 358 kW is lost, respectively. On the other hand, the total reactive power loss for light, normal, and heavy load conditions is 25.4, 11.457, and 197.417 kVAr, respectively. In general, the power losses are significant in magnitude, and also, the voltage profile of the system is extremely poor which in turn makes the performance of the distribution network very weak.
Table 1. State of the distribution system performance before optimization
6.2. Scenario-1: optimal capacitor bank integration alone
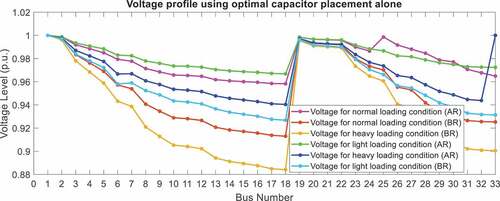
In this scenario, two different approaches are considered for optimal capacitor allocation such as sensitivity factor analysis and Selective Particle Swarm Optimization (SPSO) for optimal capacitor bank sizing. Different sizes of capacitor banks are integrated into the system at various bus locations, and the corresponding voltage profiles of the system along with active and reactive power losses are determined for three loading conditions to show the effectiveness of the proposed method. The minimum voltage of the system at light load, normal load, and heavy load is 0.9668, 0.94043, and 0.9268 p.u, whereas the active power losses are 33.469, 142.210, and 265.827 kW, respectively. The reactive power losses due to the insertion of optimal capacitor banks alone are also significantly reduced.
The simulation results reveal that capacitor placement minimizes the power losses and enhances the voltage profiles of the network. However, all the voltage magnitudes are not maintained within the allowable operating range during normal and heavy loading conditions when capacitor banks alone are integrated into the radial feeder. The results of this scenario are summarized and presented in and .
Table 2. Load flow results before and after compensations
Figure 6. Voltage profile after placement of the capacitor bank
6.3. Scenario-2: optimal network reconfiguration alone
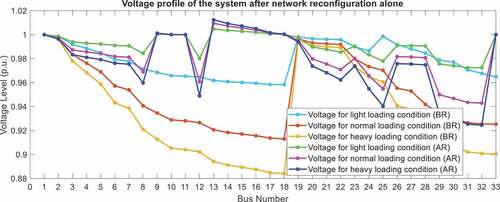
Similarly, network reconfiguration alone is applied using the backward–forward sweep load flow analysis method, which is extensively discussed in the previous sections. Selective PSO is also incorporated to identify the optimal structure of the network that can result in minimum power losses and improved voltage profile. In the initial network configuration, 33, 34, 35, 36, and 37 are tie switches, whereas the tie switches after the networks reconfigured are 33, 35, 36, and 37, whereas the sectionalize switches to be opened are found to be 7, 11, 28, and 32 for light load condition. The switch combination for the other two loading conditions is presented in . In this scenario, the minimum voltage of the system at light load, normal load, and heavy load is 0.9715, 0.9430, and 0.9245 p.u., respectively.
Table 3. Distribution network reconfiguration results for performance enhancement
Similar to scenario-1, some bus’s voltage profile is below the minimum threshold value when this method alone is used which in turn indicates that using network reconfiguration alone has a limitation to significantly improve the voltage profile of distribution systems. Additionally, active and power losses for light, normal, and heavy load conditions are 32.075, 132.13, and 226.82 kW, respectively. In general, the results of various load levels are shown in and .
Figure 7. Voltage profile of the system after network reconfiguration
6.4. Simultaneous network reconfiguration and capacitor placement/sizing
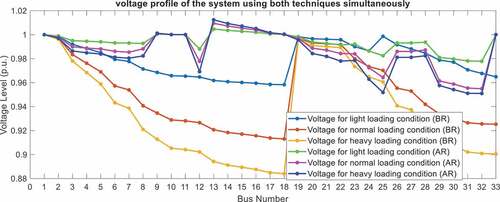
In this scenario, simultaneously optimal network reconfiguration and capacitor placement are done to substantially minimize the power losses and to significantly improve all bus voltage profiles. It is clearly shown in the previous scenarios that far-end voltage magnitudes are not improved above 0.95 p.u. and the percentage power loss reductions were also not greatly reduced. The two methods are now used simultaneously aiming at enhancing the performance of the distribution system. The minimum voltage of the system at light load, normal load, and heavy load is 0.9779, 0.9549, and 0.9510 p.u., respectively. Furthermore, the active and active power losses are also significantly reduced in all loading conditions as shown in .
Table 4. Load flow results after network reconfiguration and capacitor placement
Table 5. Result summary of the propose method
All in all, optimal network reconfiguration and switched capacitor bank insertion are most effective in minimizing the power losses and enhancing the voltage profile of radial distribution systems compared to capacitor and network reconfiguration counterparts. The summary result of this scenario with various load levels is shown in .
Figure 8. Voltage profile of the system using both techniques simultaneously
6.5. Active power loss reduction and voltage improvement result comparison of all scenarios
Comparison of all the scenarios considered in this research for both voltage profile improvement and power loss minimization are summarized as shown in . The obtained simulation results reveal that the simultaneous network reconfiguration and fixed/switched capacitor bank are more effective for all load levels. For instance, the voltage profile of all nodes including the far-end buses is above the minimum threshold value for light, normal, and heavy load conditions. Similarly, the active power loss dramatically reduced when both techniques are considered simultaneously as shown in . These results proved that the distribution network reconfiguration with capacitor placement/sitting integration with SPSO method has been successful for improvement of the performance of the IEEE 33-bus radial distribution system. After optimization, the results have the highest voltage magnitude which is kept at 1.0095 p.u. at normal load at bus 13, while the lowest voltage magnitude is 0.9510 p.u. at heavy load at bus 32 in the test system.
Figure 9. (a) Voltage profile at different scenarios and load variations and (b) power loss comparison in different scenario and load variation
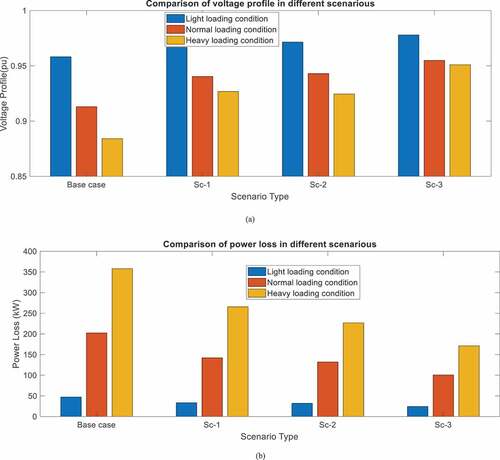
Figure 10. (a) Reactive power losses in RDS and (b) capacitor placement and sizing in selected scenario
In general, the performance enhancement of the distribution system using the proposed method is summarized and presented in the following table. As it can be shown, it improves the voltage profile and the percentage loss reduction along with power factor improvement, especially when the capacitor banks are optimally sized and located in the distribution system. It demonstrates that the power factor is greatly affected when the load is abruptly increased from light load to heavy load.
6.6. Reactive power loss and capacitor size comparison of all scenarios
From the various scenarios which are chosen, both techniques are used simultaneously for power loss minimization of the system. This scenario shows the optimum reactive power loss and fixed and switched capacitor labeling. The result shown below clearly demonstrates that the reactive power loss reduction at light load, normal load, and heavy load increases when both techniques are used at the same time. The optimal locations of both the fixed and switched capacitor banks are also presented along with their corresponding optimal sizes .
6.7. Performance analysis of the proposed method with other techniques
The performance comparison of the proposed work with other related previous works is shown in . As it can be shown, the proposed method is more effective for voltage improvement and power loss reduction.
Table 6. Comparison of power loss and voltage profile based on number of power loss techniques (Alrashidi et al., Citation2010)
7. Conclusion
This work concludes with key issues that include power loss minimization and enhancement of the voltage profile. The optimization algorithm contains multi-objective function and number of constraints. The basic methods that have been used in this study are load flow analysis, sensitivity factor analysis, and MPSO. Backward and forward load flow analysis is selected to compute all the required parameters in the test system. The base case real power losses are 47.2, 202.40, and 358 kW for light load, normal load, and heavy load, respectively. The sensitivity analysis factors are well formulated and used effectively to reduce the search space of the optimization algorithm. For the IEEE 33-bus test system, seven candidate buses are chosen to save maximum power.
MPSO is used to select design variables depending on both the optimal network reconfiguration and optimal capacitor sizing. The algorithm is efficient in terms of reducing both real and reactive power losses. The minimum voltage levels for light, normal, and heavy load are 0.9779, 0.9549, and 0.9510 p.u., respectively. The minimum real power loss in the proposed optimization method is 20.47, 89.69, and 170.277 kW for light, normal, and heavy load variations, respectively. This shows that the proposed method is more effective to improve the voltage profile and substantially reduce active power and reactive power losses. The performance of the proposed method is also compared with other optimization algorithms, and it has been found that MPSO algorithm is more suitable for performance enhancement of radial distribution systems in terms of power loss and voltage profile.
Nomenclatures
P’i = Active power in kW
Q’i= Reactive power in kVAr
rk= Line resistance in ohm
Xk= Line reactance in ohm
V’i= The voltage magnitude of nodes available in the system
P’i+1= Active power in kW at bus i+1
Q’i+1= Reactive power in kVAr at bus i+1
= The voltage phase angle in degree
PLoss = Active power loss
QLoss = Reactive power loss
Pcorrected= The improved power factor after applying the compensation
Pinitailoced= The initial power factor (0.85) before applying the compensation
pfold = The old power factor before compensation
pfnew = The new power factor after compensation
LSF = Loss sensitivity factor
VSF = Voltage sensitivity factor
Ef = Fitness function for optimization
MOF = Multi-objective optimization
CVD = Cumulative voltage deviation
Wx= Weight factor for active power loss
Wr = Weight factor for reactive power loss
Wv = Weight factor voltage improvement
QL= Inductive load in kVAr
PL = Resistive load in kW
W= Inertia weight
Vtid= The ith bus voltage for “d” dimension
CI= Constant
r1 and r2= random numbers of particle in between 0 and 1
C2 = Constant
Xtid= The ith particle position for “d” dimension
Ptgbd = Global best at dimension “d”
Ptid = Personal best at dimension “d”
BR= Before reconfiguration
AR= After reconfiguration
Acknowledgements
We would like to acknowledge Bahir Dar Institute of Technology and Debre Markos University, in particular, faculty of electrical and computer engineering for allowing us to use the laboratory rooms and advanced simulating computers for MATLAB code execution. Furthermore, we are thankful for our friends and staffs who consistently encouraged and motivated us while working on this research.
Disclosure statement
The authors declare that there is no conflict of interest in regard to the publication of this paper.
Data Availability Statement
All the data used in this research work can be reached out asking the corresponding author.
Additional information
Funding
Notes on contributors

Habtemariam Aberie
Mr. Habtemariam Aberie received his BSc degree in Electrical and Computer Engineering from Bahir Dar University in 2016 and his MSc degree in Power Systems Engineering from the same university in 2019. He is currently working for Bahir Dar Institute of Technology (BiT) as a full lecturer under the faculty of Electrical and Computer Engineering. His research interests are power system automation, Smart grid, and application of modern optimization in power system. He has also been involved in various projects, namely, distribution network performance improvement via solar photovoltaic integration and smart micro-grid.
References
- Ab Ghani, M. R., Gan, C. K., & Hasan, I. J., “Optimum distributed generation allocation using PSO in order to reduce losses and voltage improvement,” 3rd IET Int. Conf. Clean Energy Technol, Kuching Malaysia, 2014, pp. 29 (6 .)-29 (6 .), 2014.
- Adegboyega Gabriel, A., & Franklin, O., (yyyy)“Determination of electric power losses in distribution systems: Ekpoma, Edo state, Nigeria as a case study.”
- Alrashidi, M. R., Alhajri, M. F., Al-Othman, A. K., & El-Naggar, K. M. (2010). Particle swarm optimization and its applications in power systems. Stud. Comput. Intell, 302, 295–18. https://ieeexplore.ieee.org/document/6007304
- Dixit, M., Kundu, P., & Jariwala, H. R. (2017). Incorporation of distributed generation and shunt capacitor in radial distribution system for techno-economic benefits. Engineering Science and Technology, an International Journal, 20(2), 482–493. https://doi.org/10.1016/j.jestch.2017.01.003
- Esmaeilian, H. R., & Fadaeinedjad, R., “Optimal reconfiguration and capacitor allocation in unbalanced distribution network considering power quality issues,” 22nd Int. Conf. Electr. Distrib. (CIRED 2013), Stockholm, Sweden, no. 1316, pp. 1–4, 2013.
- Esmaeilian, H. R., & Fadaeinedjad, R. (2015). Energy loss minimization in distribution systems utilizing an enhanced reconfiguration method integrating distributed generation. IEEE Syst. J, 9(4), 1430–1439. https://doi.org/10.1109/JSYST.2014.2341579
- Kargar, A., & Maleki, V., (yyyy) “Reconfiguration of distribution systems with distributed generators based on imperialist competitive algorithm.”
- Kouzou, A., & Mohammedi, R. D., “Optimal reconfiguration of a radial power distribution network based on Meta-heuristic optimization algorithms 2015,” 4th Int. Conf. Electr. Power Energy Convers. Syst. EPECS 2015, 2015.
- Kumar, G. S., “Reconfiguration of electrical distribution network for Loss Reduction and voltage enhancement,” 2017 IEEE Int. Conf. Power, Control. Signals Instrum. Eng., pp. 1387–1392, 2017.
- Landeros, A., “Smart reconfiguration of electric power distribution networks for power loss minimization and voltage profile optimization,” no. May, p. 102, 2018.
- Ma, S., Zhang, H., & Xu, G., “Distribution network reconfiguration with wind,” no. 12, pp. 1–4, 2012.
- Niazi, G., & Lalwani, M., “PSO based optimal distributed generation placement and sizing in power distribution networks: A comprehensive review,” 2017 Int. Conf. Comput. Commun. Electron. COMPTELIX 2017, no. 1, pp. 305–311, 2017, Jaipur, Malaviya.
- Rajalakshmi, K., Sathish Kumar, K., Venkatesh, S., & Belwin Edward, J., “Reconfiguration of distribution system for loss reduction using improved harmony search algorithm,” Int. Conf. High Volt. Eng. Power Syst. ICHVEPS 2017 - Proceeding, Bali, Indonesia, vol. 2017-Janua, pp. 377–382, 2017.
- Ramesh, L., Chowdhury, S., Chowdhury, S., Natarajan, A., & Gaunt, C. (2009). Minimization of power loss in distribution networks by different techniques. International Journal of Electrical Power and Energy Systems Engineering, 2, 1–6. https://www.researchgate.net/publication/232607582_Minimization_of_Power_Loss_in_Distribution_Networks_by_Different_Techniques
- Rao, R. S., Ravindra, K., Satish, K., & Narasimham, S. (2013). Power loss minimization in distribution system using network reconfiguration in the presence of distributed generation. IEEE Transactions on Power Systems, 28(1), 317–325. https://doi.org/10.1109/TPWRS.2012.2197227
- Raut, U., & Mishra, S., “Power distribution network reconfiguration for loss minimization using a new graph theory based genetic algorithm,” 2017 IEEE Calcutta Conf. CALCON 2017 - Proc., vol. 2018-Janua, pp. 1–5, 2018.
- Rezaei, P., & Vakilian, M., “Distribution system efficiency improvement by reconfiguration and capacitor placement using a modified particle swarm optimization algorithm,” EPEC 2010 - IEEE Electr. Power Energy Conf. “Sustainable Energy an Intell. Grid,” 2010.
- Sajir, H., Rahebi, J., Abed, A., & Farzamnia, A., “Reduce power losses and improve voltage level by using distributed generation in radial distributed grid,” Proc. - 2017 IEEE 2nd Int. Conf. Autom. Control Intell. Syst. I2CACIS 2017, vol. 2017-Decem, no. October, pp. 128–133, 2017.
- Sedighizadeh, M., Dakhem, M., Sarvi, M., & Kordkheili, H. H. (2014). Optimal reconfiguration and capacitor placement for power loss reduction of distribution system using improved binary particle swarm optimization. International Journal of Energy and Environmental Engineering, 5(1), 3. https://doi.org/10.1186/2251-6832-5-3
- Shetty, V. J., & Ankaliki, S. G., “Electrical distribution system power loss reduction and voltage profile enhancement by network reconfiguration using PSO,” 5th Int. Conf. Electr. Energy Syst. ICEES 2019, vol. ௫, no. 4, pp. 1–4, 2019.
- Tahir, M. J., Latiff, I. A., Alam, M., & Mazliham, M. S., “Network reconfiguration using modified particle swarm algorithm,” 2018 2nd Int. Conf. Smart Sensors Appl. ICSSA 2018, pp. 1–5, 2018.
- Tahir, M. J., Latiff, I. A., Alam, M., Mazliham, M. S. (2018). I. Conference, “A review on optimal network reconfiguration in the radial distribution system using optimization techniques,” .
- Zhang, H., Ma, S., & Xu, G., “Network reconfiguration of distribution system with distributed generation using state graph,” Asia-Pacific Power Energy Eng. Conf. APPEEC, 2012.