
 ?Mathematical formulae have been encoded as MathML and are displayed in this HTML version using MathJax in order to improve their display. Uncheck the box to turn MathJax off. This feature requires Javascript. Click on a formula to zoom.
Abstract
One of the most important causes of river pollution is soil and water pollutions since no previous numerical studies linked the water quality indices and soil erosion parameters. The current research investigates the relationships between water quality parameters and indices versus parameters of soil erodibility (τc and kd) of Tigris Riverbanks within Baghdad City, Iraq. Besides, the research aims to create a new Iraqi Water Quality Index (IWQI) based on 10 parameters of water quality and compare the results with the Canadian Water Quality Index (CWQI). Finally, the research explores the spatial distribution of soil erodibility and water quality parameters using spatial analysis tools to produce forecast maps for water parameters and soil erodibility parameters. Forty samples of water and 30 samples of soil were collected from the five sites in Baghdad city during the winter and summer of 2019–2020. The mini-JET (miniature version of Jet Erosion Test) instrument was used to derive the soil erodibility parameters (τc and kd) for the five selected sites. The results showed that CWQI for all study sites of Tigris Riverbanks could be classified as inferior during the two seasons, while the new IWQI classified the water as good quality. The results showed that there was a relationship between water quality indices and soil erodibility parameters of Tigris Riverbanks. A direct relationship of two indices CWQI and IWQI versus τc was observed during the winter season with R2 of 0.86 for τc-CWQI and τc-IWQI. An inverse relationship between kd-CWQI and kd -IWQI with R2 of 0.90 and 0.86 was observed during the winter season. Similar results were obtained for the summer season but with low correlations of water quality indices versus kd. This research concluded that as water quality was poor, the soil erodibility was high.
PUBLIC INTEREST STATEMENT
The exclusive goal of this research was to investigate the relationships of water quality parameters and indices versus soil erodibility parameters and develop a new Iraqi Water Quality Index (IWQI) based on 10 water quality parameters along Tigris Riverbanks in Baghdad City for samples that collected during winter of 2019 and summer of 2020. The mini-JET instrument was used to derive soil erodibility parameters for the five selected sites along Tigris Riverbanks. The results showed that the new IWQI classified the water as good quality. The results showed that there was a relationship between water quality indices and soil erodibility parameters of Tigris riverbanks. This research concluded that high soil erodibility was obtained at poor water quality. The significance of this study is to obtain the extent correlation between the water quality indices and its impact on the soil erodibility parameters and their correlations to riverbank stability.
1. Introduction
Water is a natural resource that is essential and valuable to all living things on earth. For the survival and continuity of life on earth, freshwater resources’ quantity and quality are crucial (Rahi et al., Citation2019). The estimated worldwide water volume is 1400 × 109 Mm3. As a result, water occupies 71% of the earth. The status of forest land use influences water quality and quantity in a watershed, cultivation, pastures, settlements (Johnson et al., Citation1997; Sthiannopkao et al., Citation2006), plant structures (with or without trees, grasses, bushes), landscape, geology (Ballantine & Schneider, Citation2009), topography (Rehman et al., Citation2015), soil physical, chemical, and biological characteristics. It is necessary to properly evaluate the water quality in rivers, influenced by multiple factors such as agriculture, industrial, and power generation activities (Lateef et al., Citation2020). To know the state of water, whether it is suitable for human use or not. The quality of water is usually used to describe the condition of water, including its chemical, physical, and biological features, regarding its suitability for a particular purpose (i.e. drinking, fishing, or irrigation) (Al-Tameemi et al., Citation2020; Fazelabdolabadi & Golestan, Citation2020; Sargaonkar & Deshpande, Citation2003).
In Iraq, one of the main surface water supplies is the Tigris River, separating Baghdad’s capital city to the right sector (Karkh) and the left sector (Rusafa) with a north-level flow path to the south. With a total length of 1900 km (Issa et al., Citation2014), the Tigris River is the second-longest river in Southwest Asia, after the Euphrates River (Al-Madhhachi, Rahi, et al., Citation2020; Rahi et al., Citation2019). Tigris River total length is 1418 km in Iraq and 50 km was in Baghdad City (Ali et al., Citation2012; Ismail, Citation2014). The Water Quality Index (WQI) is typically a dimensionless number that involves various water quality variables into a single number by standardizing the rating curve values and enabling easy understanding of data monitoring (Hussain & Al-Fatlawi, Citation2020; Kachroud et al., Citation2019). Different indices were formulated and developed by many experts, such as the National Sanitation Foundation Index, Oregon Index (Sutadian et al., Citation2016), and the Canadian Water Quality index (CWQI)(Canadian Council of Ministers of the Environment, Citation2001).
Several experiments were carried out in Iraq to determine the WQI of the Tigris River within Baghdad city. Ismail (Citation2014) used the Overall Pollution Index (OIP) for surface water to determine the water quality of the Tigris River in Baghdad and analyze the applicability of the OIP for Iraqi waterbodies previous scientific studies performed for the same river. Ismail (Citation2014) developed mathematical equations within OIP developers to estimate the index. Ismail (Citation2014) found that the Tigris River was heavily polluted at Al-Doura and Al-Rasheed stations. In 2018, Muftin et al. (Citation2018) measured the Tigris River water quality within Baghdad’s city. Samples were collected south of the city of Baghdad near the Al-Rasheed thermal power plant. Their study used the CWQI model to analyze eleven water parameters to investigate water quality. In winter, they found poor water quality while, in summer and autumn, the water quality was marginal. Ewaid et al. (Citation2018) applied the assigned weight method from 10 water treatment plants to measure the Tigris River’s water quality within Baghdad city. They found an improvement in water quality in the summer and autumn seasons compared to the winter season. The Tigris River’s water quality assessment has been carried out by Chabuk et al. (Citation2020) using the WQI and the Geographic Information System (GIS) software. From 14 stations along the river, 12 water parameters including calcium (Ca), magnesium (Mg), sodium (Na), potassium (K), chloride (Cl), sulfate (SO4), Bicarbonate (HCO3), total hardness (TH), total dissolved solids (TDS), biological oxygen demand (BOD5), nitrate (NO3), and electrical conductivity (EC) were acquired by this research. A weighted arithmetic method was used to calculate WQI, and GIS implemented the Inverse Distance Weighted (IDW) method. The results showed that the Tigris River’s water quality deteriorated downstream of the Tigris River, especially at the Al-Aziziya station in the wet and dry seasons. Furthermore, Ewaid et al. (Citation2020) developed a new water quality index for Iraqi Rivers (IWQI). The IWQI was established by considering 27 water parameters based on the Iraqi drinking water standard. Then, the water parameters reduce to only six parameters which is more critical in the Tigris River. They classified the Tigris River within Baghdad as acceptable during summer and good for the rest of the year.
Water considered the most significant agent of soil erosion in most parts of the world. Due to population growth and increased water pollution activity, soil erosion has become a global environmental problem primarily for developing and undeveloped countries (Abdulkareem et al., Citation2019; Borrelli et al., Citation2017). Limited researchers (Sthiannopkao et al., Citation2007, Citation2006) investigated a relationship between soil erosion and water quality parameters. Sthiannopkao et al. (Citation2006) studied soil erosion’s impact on rivers’ water quality and agricultural development resulting from forests’ transformation in the Phong River’s upstream catchment. Suspended solids contain nutrients and agricultural chemicals that cause water contamination downstream, and soil erosion contributes to an increase in the annual average concentration of suspended solids to 72 mg/l. Sthiannopkao et al. (Citation2007) also found that water quality is affected by soil erosion by increasing turbidity in the Phong River and reducing small reservoirs’ ability for the upstream residents and the Ubolratana Dam.
There is currently no generally accepted or accurate method for estimating soil erodibility parameters (τc and kd) for cohesive soils. The simplest way to evaluate τc and kd are to calculate them in the field or the lab. The Jet Erosion Test (JET) (Hanson & Cook, Citation2004; Khanal et al., Citation2016) was used to measure soil erodibility parameters and become more generally accepted in practice. A miniature version of a submerged JET device (mini-JET) has recently been used widely (Daly et al., Citation2015; Hashim et al., Citation2020). Daly et al. (Citation2015) used a mini-JET in the field at the riverbanks across the Illinois River in Oklahoma to derive the erodibility parameters and to investigate the variability or uniformity of these parameters at river basin size, the relationship between the derived parameters and the soil texture, and the possibility of predicting the relationship between τc and kd. The effect of three wastewater chemicals (nitrate, phenol, and phosphate) on erodibility parameters of cohesive soils was investigated by Abbas et al. (Citation2019) using two mini-JET solution techniques. Soil samples were taken from the area of Al-Taji, northwest of Baghdad. The results showed a steady rise in kd at different curing times and concentrations for all three wastewater chemicals, while decreases were observed in τc values. Al-Madhhachi, Al-Mussawy et al. (Citation2020) performed 36 mini-JETs to investigate the variability in τc and kd along Tigris Riverbanks at different soil moisture levels in Numaniyah-Kut reach, upstream of Kut Barrage, Kut city, Iraq. They noticed that banks were more erodible and unstable downstream of Numaniyah City, and the banks were more stable and less erodible upstream of the Kut dam. Hashim et al. (Citation2020) investigated the impact of two biocrusts on τc and kd derived from mini-JET at three different soil moisture levels and formed relationships between τc and kd versus other soil characteristics at one side near Tigris Riverbanks. They found that when the soil characteristics (salt concentration, organic matter, and calcium carbonate) increased, the kd decreased, while the τc increased.
The present study was performed on the five selected sites along Tigris Riverbanks, within Baghdad City. These sites were suffered from several pollution sources such as hospitals, factories, and oil refinery plant, which dumped their polluted water directly into the river without any treatments. It is essential to investigate water-quality parameters, indices, and their relationships with soil erodibility parameters τc and kd. There is no other study until now that analyzed a relationship of water quality parameters and indices versus soil erodibility parameters τc and kd along Tigris Riverbanks, and explore the spatial distribution of τc and kd parameters at these selected stations using spatial analysis tools of IDW. Therefore, this research aim to 1) investigate the relationships of water quality parameters and indices versus soil erodibility parameters (τc and kd) at five selected stations in Tigris Riverbanks within Baghdad City, 2) establish a new Iraqi Water Quality Index (IWQI) based on 10 water quality parameters and compare the results with CWQI, and 3) explore the spatial distribution of τc and kd as well as water quality parameters using spatial analysis tools of IDW.
The following section presents in detail sampling of water and soil, the JET device’s analytic method, development of water quality indices, the spatial distribution of data using IDW, and experimental procedure. Then, the results of water quality parameters and indices, soil erodibility parameters, and the development of relationships between soil erodibility parameters versus water quality parameters and indices were presented and discussed. Finally, the conclusions of the findings in this study were presented at the end.
2. Methodology and materials
2.1. Study area
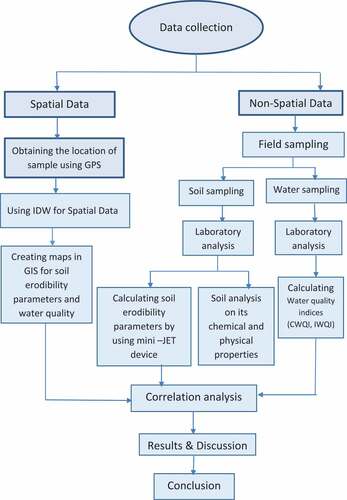
Baghdad is the capital of Iraq at a latitude of 33°18ʹ54.81”N and a longitude of 44°21ʹ57.86”E. The primary source of drinking water in Baghdad is the Tigris River. The region is characterized by an arid to semi-arid climate with dry during the summer and cold during winter. The current research chose five sites within Baghdad city along the Tigris River to determine the water quality index and soil erodibility parameters, as shown in . These sites were chosen based on several pollution sources. The distance between the first site and five sites is about 23.29 km. The soil and water samples were collected monthly during January, February, November, and December (winter of 2019) and May, June, July, and August (summer of 2020). The total samples of water were 40 samples. The first site was located in the north, the second and third were located in the middle of Bagdad, and the fourth and fifth were located south of Baghdad (). A flowchart was presented in to show the research methodology.
Figure 1. The site locations and pollution sources along Tigris Riverbanks, Baghdad City, Iraq
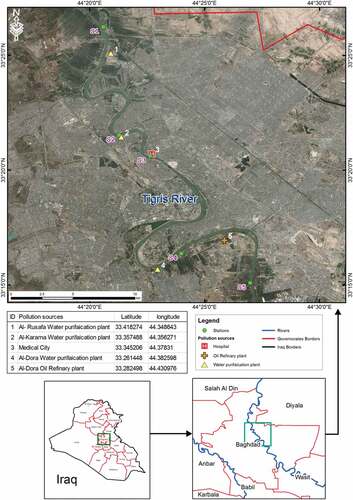
Figure 2. Details of a flowchart to show the research methodology
2.2. Sampling
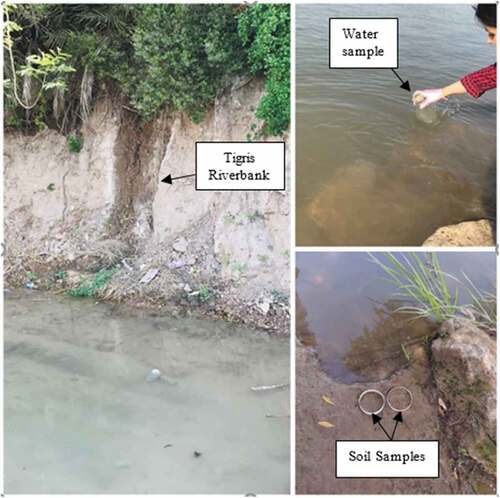
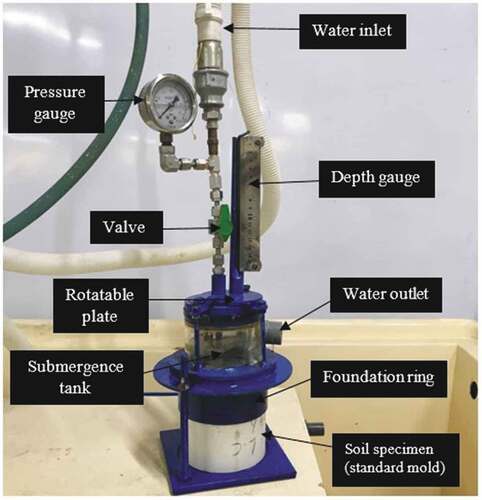
The soil and water samples of water were taken from the riverbanks at the five stations. The water samples were collected by clean polyethylene bottles. The bottles have a capacity of 500 ml (). The water samples from the surface layer with a depth of 20 to 30 cm are obtained using polyethylene bottles, pre-washed with distilled water. Water samples were tested for chemical and physical properties immediately after collection (APHA, American Public Health Association, Citation2012) at the Environmental Research Center, University of Technology. Ten water-quality parameters were found for each site, including electrical conductivity (EC), water pH, dissolved oxygen (DO), total dissolved solids (TDS), total suspended solids (TSS), turbidity, nitrate (NO3), Ammonia (NH3), sulfate (SO4), and phosphate (PO4). Soil samples were obtained using Poly Vinyl Chloride (P.V.C) molds with the exact standard mold dimensions, 10.1 cm in diameter and 11.8 cm in height at each location, to extract soil samples to be tested by the mini-JET unit (). Both physical and chemical soil samples were determined by the ASTM standards (American Society for Testing and Materials (ASTM), Citation2006). Soil analyses were performed at the Ministry of Water Resources, National Water Resources Management Center laboratories.
Figure 3. Water and soil samples collected from five sites at Tigris Riverbanks, Baghdad City, Iraq
2.3. Analytic method of JET
The main solution to find the soil erodibility parameters (critical shear stress,τc, and coefficient of erodibility, kd) was based on both the methodologies of Stein and Nett (Citation1997) and Blaisdell et al. (Citation1981). The fluid diffusion for submergence jets was investigated by Stein and Nett (Citation1997), while the equilibrium depth, Be, was presented by Blaisdell et al. (Citation1981) based on the hyperbolic function model. Accordingly, the critical shear stress τc was given as follows (Hanson & Cook, Citation2004, Citation1997):
where is the maximum shear stress, Pa; and Bp is the potential core length from the jet origin, m. The erodibility parameters were found by solving for the least squared method between the observed and predicted scour times, as follows (Hanson & Cook, Citation1997):
where, M* is the dimensional time; Mp* is the reference time; B* is the dimensional scour depth, and Bp* is the dimensional potential core length. The parameters kd and τc were combined in the excel shear stress model as follows to estimate the erosion rate, Sr (Hanson, Citation1990; Partheniades, Citation1965):
where τ is the average hydraulic boundary shear stress, Pa. Daly et al. (Citation2013) developed an Excel Spreadsheet to determine kd and τc based on mini-JET data.
2.4. Canadian Water Quality Index (CWQI)
In order to compare the Iraqi Water Quality Index (IWQI) with an international water quality index, the Canadian Water Quality Index (CWQI) was utilized in this study. The CWQI was developed by the Water Quality Guidelines of the Canadian Council of Ministers of the Environment (CCME) in 1997 (Canadian Council of Ministers of the Environment, Citation2001). The manual of Canadian Council of Ministers of the Environment (Citation2001) provides a full explanation of development, testing, and CWQI. The manual of CWQI classified the water quality between 0 and 100 as one of the following categories, as shown in .
Table 1. The CWQI standard values according to the Canadian council of ministers of the environmental
Three measurements were chosen (F1, F2, and F3) to determine the CWQI. The F1 (Scope) reflects the number of variables that do not reach their goals at least once during the period considered (failed variables) concerning the total number of measured variables:
where, Nf is the number of failed variables, and Tn is the total number of variables. F2 (Frequency) is the number of individual tests that do not achieve the goals (failed tests):
where, Nt is the number of failed tests, and Tt is the total number of tests. The F3 (Amplitude) is the amount by which the failed test values do not meet their goals. The F3 is measured as follows:
Accordingly, CWQI is calculated as follows:
EquationEquation (7)(7)
(7) results in values ranging between zero to 100, where zero represents poor water quality, and 100 represents excellent water quality.
2.5. Development of Iraqi Water Quality Index (IWQI)
The following steps are taken to establish any water quality index, according to Ewaid et al. (Citation2020) and should be followed. First of all, select the water parameters. Second, establish the parameter weights. Then, obtaining the values of the sub-index (transformation to a standard scale). Finally, aggregate the sub-indices to produce the final index. In the present study, the selection of parameters and descriptive statistics was applied to exclude the little value parameter. Accordingly, the selected water quality parameters were EC, pH, DO, TDS, TSS, turbidity, NO3, NH3, SO4, and PO4. The same parameters used to calculate CWQI in this paper. The second step was to assign each parameter’s weight from the author’s experiences and depend on each parameter’s importance when determining water quality for the Tigris River, as shown in .
Table 2. The range of concentration with equations and weights that are used to develop IWQI in this study depends on 10 water quality parameters
The third step is to find the sub-index function of each parameter. The weighted sum index method was adopted to develop the sub-index function using the categories values of water quality classification, as presented in . The sub-index function of each parameter represents a curve. illustrates the water parameters of DO and NO3 equations as an example. The x-axis represented the range of concentrations depending on the water quality standard, while the y-axis representing the water quality index produced by various measurements. Then, to quantify each parameter’s impact on one standard scale, the average score generated by each parameter was calculated. The weighted average aggregation function was then used as follows:
Figure 4. An example of the water quality parameters versus indices to drive sub-index equations for water parameters of: a) DO, and b) NO3.
where IWQI is the proposed Iraqi Water Quality Index for this study, a number between 0 and 100, Wi is the ith parameter’s unit weight, a number between 0 and 1, and Ti is the ith parameter’s quality, a number between 0 and 100. Therefore, the IWQI for Tigris River is expressed as:
This equation classified the IWQI into five groups: very good, good, acceptable, bad, and very bad, as shown in . The total number of water parameters as input data in both CWQI and CWQI was 400.
2.6. Inverse Distance Weighted (IDW) within GIS
GIS spatial analysis software was combined with the IDW program to manage large data volumes and other mathematical models for achieving valuable results in many scientific and environmental fields (Lateef et al., Citation2020). The Arc GIS 10.6 program has been used to build a map of the water parameters and soil erodibility for samples collected in the winter season of 2019 and summer season of 2020 along the Tigris River. The Inverse Distance Weighted (IDW) interpolation technique was used to produce each parameter’s interpolation map. The IDW is a reflective technology of Waldo Tobler’s first geographic law (Hengl, Citation2009). In IDW, the points closer to the prediction site would significantly affect the predicted values further away from the points (Panhalakr & Jarag, Citation2016). This action was used to establish interpolation between the selected points or positions using the IDW depending on the first visit that samples were collected in this analysis. The IDW method was considered to be more appropriate than other methods (such as kriging and topo to raster data) according to Panhalakr and Jarag (Citation2016), as these methods generate interpolation for points defined with more deviation. The mathematically adapted formula (Panhalakr & Jarag, Citation2016) for the interpolation process of IDW is:
where Zo is the estimated value of the zero-point, Zi is the Z value of known point i, Xi is the distance between point i and zero points, n is the number of known points used in estimation, and r is the required power of r > 1.
2.7. Experimental procedure
Forty water samples were collected from the sites for the two seasons with total input water parameters of 400 in CWQI and IWQI. Water samples were refrigerated at 4°C to be analyzed when the samples reached the water laboratories. Procedures followed for analysis have been under the Standard Method for the examination of water and wastewater according to (APHA, American Public Health Association, Citation2012). The chemical and physical analyses were carried out using the following laboratory instruments, as illustrated in .
Table 3. Methods and instrument model using in water physical-chemical analysis
Thirty soil samples were acquired during winter and summer. The mini-JET device () was utilized to estimate the erodibility parameters (τc and kd). One kilogram of soil was acquired from each site during both seasons to examine the soil’s physical and chemical characteristics. The soil physical and chemical includes the following parameters: soil texture, specific gravity, soil pH, bulk density, EC (electrical conductivity), CaCO3 (calcium carbonate), CaSO4 (calcium sulfate), Ca+2 (calcium), Mg+2 (magnesium), Na+1 (sodium), SAR (sodium adsorption ratio), moisture content, RSI (relative soil aggregation index), and OM (organic matter) as shown in . The soil samples have been tested and analyzed in compliance with American Society for Testing and Materials (ASTM) (Citation2006) requirements. Sieve analysis and hydrometer tests were performed according to ASTM Standard D422. Soil pH was measured according to ASTM standard D4972. Moisture tests content were measured following ASTM standard D2974. Soil-specific gravity was conducted according to ASTM D854. The amount of CaCO3 was calculated using the titration method using the indicator of phenolphthalein. Walkley Black method was used to estimate OM’s amount in the soil samples (Sparks et al., Citation1996). Gypsum determination was applied according to USDA (United States Department of Agriculture) (Citation1954). Sodium was measured using a flame photometer. Calcium and magnesium were measured by titration with EDTA. The SAR was calculated as follows (USDA (United States Department of Agriculture), Citation1954):
Table 4. Physical properties, chemical composition, and classification of the soil utilized in this study during summer and winter seasons
Figure 5. Mini-JET device setup at hydraulic laboratory, water resources engineering, Mustansiriyah University
where sodium, calcium, and magnesium were measured in meq/l. The RSI was obtained according to Avecilla et al. (Citation2015), as follows:
Three soil samples from each site were collected simultaneously and in the same way to be tested with the mini-JET tool (). The soil specimen was placed directly under the jet nozzle in the center of the submergence tank. The adjustable head tank was then set at the desired constant head (118 cm for all experiments) and connected to the hoses’ JET system (including the water source). The scoured bed readings were taken at various time intervals using the depth gauge. Following the same procedure of Al-Madhhachi et al. (Citation2019) and Khanal et al. (Citation2016), the procedure of running JET and collecting data with a test length of 120 minutes for each sample was performed.
3. Results and discussion
3.1. Water quality parameters
The descriptive statistics (minimum, maximum, mean, and standard deviations) of the 10 water quality parameters measured during the two seasons at the five sites of Tigris Riverbanks in Baghdad City are summarized in . Pearson correlation coefficient was applied to find a correlation between water quality parameters during the two seasons using SPSS V.25. The correlation matrixes are shown in . There was a positive correlation between pH and total suspended solids (TSS) during the winter season with r = 0.599 at N = 20 and p < 0.01. During the summer season, the pH correlated with DO with r = 0.485 at N = 20 and p < 0.05. The EC showed a strong positive correlation with TDS and SO4 during the winter season with r = 0.746 and r = 0.826 at N = 20 and p < 0.01, respectively. Also, the EC showed a week negative correlation with NO3 with r = −0.491 at N = 20 and p < 0.05. During the summer season, the EC correlated directly with TDS with r = 0.844 at N = 20 and p < 0.01. Ewaid et al. (Citation2018) found that TDS increases the EC in water, and the TDS originates from natural sources such as sewage and wastewater. Turner and Rabalais (Citation2003) proposed that TDS, turbidity, and EC reflect the state of inorganic pollution, the region’s geology, and the consequences of soil erosion are the critical reasons for their increased measures.
Table 5. Results of the descriptive statistics of 10 water physicochemical from five sites of Tigris Riverbanks during the two seasons of 2019–2020
Table 6. Correlation matrix of water quality parameters during the winter season of 2019
Table 7. Correlation matrix of water quality parameters during the summer season of 2020
Turbidity showed a positive correlation with TSS and nitrate during the winter season with r = 0.536 and r = 0.450 at N = 20 and p < 0.05, respectively. While in the summer season, turbidity correlated strongly with TSS with r = 0.713 at N = 20 and p < 0.01. TDS showed a strong direct correlation with SO4 during the winter season with r = 0.868 at N = 20 and p < 0.01, while in the summer season, the TDS showed no correlation with water quality parameters. TSS showed a strong direct correlation with PO4 during the winter season with r = 0.769 at N = 20 and p < 0.01, and a negatively correlated with ammonia when r = −0.519 at N = 20 and p < 0.05. While during the summer season, the TSS showed no correlation with water quality parameters. Ammonia (NH3) showed a negative correlation with DO during the winter season when r = −0.521 at N = 20 and p < 0.05. It also showed a good negative correlation with dissolved oxygen (DO) during the summer season when r = −0.628 at N = 20 and p < 0.01. Nitrate (NO3) showed a negative correlation with Sulfate (SO4) when r = −0.532 at N = 20 and p < 0.05, while in the summer season, the NO3 showed no correlation with water quality parameters.
The results of the analysis data were presented using Arc GIS 10.6 via the IDW method. show the maps of the location and pollutant concentration of three water parameters, turbidity, DO, and TDS, calculated from December 2019 to June 2020. The turbidity concentrations showed high values along the Tigris River within Baghdad city during the two seasons and exceed the Iraqi standard for drinking water. The dissolved oxygen was efficiently used in contaminated environments due to animals, plants, and bacteria’s overgrowth, leading to killing fish. Therefore, the starvation in DO concentrations is an indicator for a polluted water body, as shown in sites 1, 3, 4, and 5 during the summer season (). While during the winter season, the DO concentrations are within Iraqi Standards (). Chang (Citation2006) found that high temperature during the summer season reduces the amount of DO in the water, allowing for further evaporation. Unwanted blue-green algae and other toxic microorganisms multiply. The blue-green algae in the water environment release toxic compounds and degrade the water quality (Chang, Citation2006).
Figure 6. Spatial distribution using IDW technique for three water parameters concentrations: a) Turbidity, b) DO, and c) TDS over five sites within Baghdad City during the winter season of 2019
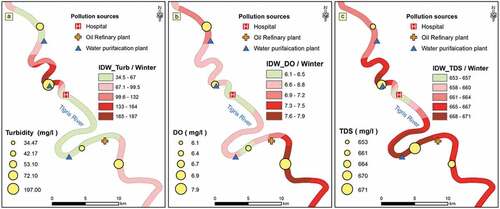
Figure 7. Spatial distribution using IDW technique for three water parameters concentrations: a) Turbidity, b) DO, and c) TDS over five sites within Baghdad City during the summer season of 2020
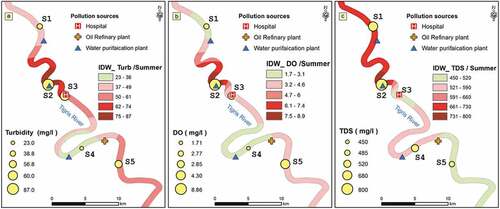
TDS includes inorganic salts (chloride, sodium, sulfate, calcium, magnesium, potassium, bicarbonate) and small quantities of dissolved organic matter in water. Total solids dissolved in drinking water are obtained from natural sources, sewage water, runoff, industrial wastewater, and chemicals used in treating water, the design of pipes or equipment used to convey water, that is, plumbing. Therefore, TDS in site #2 indicates a substantial TDS value in the water treatment plant during the two seasons ().
3.2. Water Quality Indices (WQI)
The water quality index was determined for the five sites along the Tigris River during the two seasons using the physicochemical parameters listed in and based on 400 input data. Microsoft Software Excel sheet was utilized to calculate CWQI. The variation of CWQI and the proposed IWQI is shown in for the two seasons. The average value of CWQI was lacking during the winter season and marginal during the summer season. Al-Obaidy et al. (Citation2010) proposed that CWQI is decreasing in value because of the various kinds of contaminants entering the basin for natural causes and different practices, such as domestic wastewater, discharge, and river drainage from agriculture along the banks of the river. While the average value of IWQI was good during the two seasons, the same result was obtained by Ewaid et al. (Citation2020) when they used IWQI. Ewaid et al. (Citation2020) developed IWQI based on six water parameters to reflect the characteristics of the Iraqi waters. Water samples were collected from 10 intakes of water purification plants located along the Tigris River in Baghdad. They found that IWQI classified the Tigris as good water quality during four seasons. In the present study, the difference in the two water quality indices results may be regarded as the CWQI index designed according to Canadian standards while the IWQI design according to the Iraqi standard.
Table 8. The Canadian (CWQI) and proposed Iraqi Water Quality Index (IWQI) of each site of the study area during the winter and summer seasons
3.3. Soil erodibility parameters
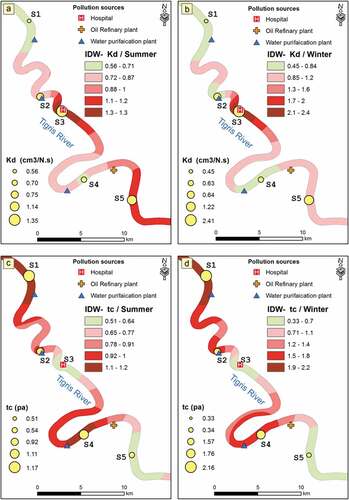
A total of 30 samples of the five selected sites of Tigris Riverbanks within Baghdad city during the two seasons (winter and summer) were tested by the mini-JETs device and conducted under laboratory conditions. The results of soil erodibility parameters of the linear model (Blaisdell’s solution) showed using Box and Whisker plots (). This figure showed that polluted areas during the two seasons have a high coefficient of erodibility, as in the third and fifth sites, while other sites showed low in the value of the coefficient of erodibility kd and high in critical shear stress τc. The same resulted were indicated by Abbas et al. (Citation2019) when they treated the soil with different pollutants. Abbas et al. (Citation2019) investigated the influence of nitrate, phenol, and phosphate on kd and τc on soil samples taken from Tigris Riverbanks in the Al-Taji region, Baghdad City. They found a constantly increased in kd, while τc values were decreased. The statistical analysis results using one-way ANOVA showed no difference in the value of τc during the two seasons with a P-value of 0.114. No statistical difference in the value of kd during the two seasons (P-value of 0.771), as shown in . The spatial distribution of erodibility parameters was shown in using spatial analysis of IDW during the two seasons to show the erosion distribution over the five sites within Baghdad city.
Table 9. One-way ANOVA results of soil erodibility parameters (τc and kd) during the two seasons
Figure 8. Variability of erodibility parameters (τc and kd) as derived from mini-JETs at five sites along Tigris Riverbanks, Baghdad City, Iraq
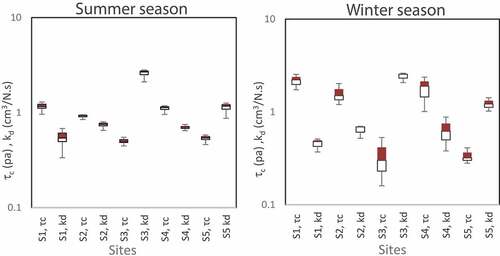
Figure 9. Spatial distribution of soil erodibility parameters (τc and kd) as derived from mini-JETs at five sites along Tigris Riverbanks, Baghdad City, Iraq, during winter and summer seasons
3.4. Water quality versus soil erodibility parameters
The most significant factors in the bank’s erosion are the physical-chemical parameters. Water chemistry could have an indirect impact on the stream’s sediment transportability by impacting the flow shear and changing the soil particles and aggregates’ composition. Goldberg and Glaubig (Citation1987) found that water quality influenced the flocculation, which determined the size and density of different soil materials. The outcomes of present study indicated that τc decreased when electrical conductivity (EC) increased in water. There is an honest inverse relationship of R2 of 0.64 during the winter season, while Kd increseas (R2 = 0.80). So, the erodibility increased in the winter season due to an increase in EC (). In the summer season, weak relationships were observed with R2 of 0.18 and 0.21 between τc versus EC and Kd versus EC, respectively. Raeisi-Vanani et al. (Citation2017) found that polluted water was used with higher EC values dispersed soil particles and resulted in soil crust formation.
Figure 10. Relationships between soil erodibility parameters (τc and kd) versus EC from five sits during a) the winter of 2019, and b) summer of 2020
De Santis et al. (Citation2010) found that TDS and pH are clearly distinguished the eroded from non-eroded slopes. The total dissolved solids increased as EC increased in the water. The outcomes of study results show that kd increased as TDS increased in water during both seasons with direct R2 = 0.56 and R2 = 0.72 (). A weak to a good inverse relationship between τc and TDS during the winter and summer season with R2 = 0.17 and R2 = 0.75, respectively. No strong relationship appeared between kd or τc versus pH of water during the two seasons. Arora and Coleman (Citation1979) found that increasing EC concentration in water improved soil flocculation and increased settling levels of suspended water sediments. The results of Arora and Coleman (Citation1979) confirm the results of the present study that showed the kd increased when total suspended solids (TSS) of water increased and fair relationships between kd and TSS during the winter season (R2 = 0.68) and summer season (R2 = 0.62). While τc decreased when TSS increased during the winter season (R2 = 0.94) and summer season (R2 = 0.73), as shown in . This matches with Sthiannopkao et al. (Citation2006) results. Sthiannopkao et al. (Citation2006) investigated soil erosion’s effects on rivers and agricultural production’s water quality resulting from forests’ transformation in the upstream catchment Phong River. Sthiannopkao et al. (Citation2006) indicated that suspended solids carry nutrients and agricultural chemicals that cause water in downstream pollution and soil erosion leads to an increased annual average concentration of the suspended solids to 72 mg/l.
Figure 11. Relationships between soil erodibility parameters (τc and kd) versus TDS for a) the winter of 2019 and b) the summer of 2020; and TSS for c) the winter of 2019 and d) the summer of 2020
According to harmony between turbidity and total suspended solids, the present study found that kd increase when the turbidity of water increased during winter (R2 = 0.68) and summer seasons (R2 = 0.93), while τc decreased during winter (R2 = 0.89) and summer season (R2 = 0.85), as shown . The increase and decrease of kd and τc are agreed with the results published by Sthiannopkao et al. (Citation2007). Sthiannopkao et al. (Citation2007) found that soil erosion affects water utility by increasing turbidity in the Phong River and reducing small reservoirs’ ability for upstream Ubolratana Dam residents. Sthiannopkao et al. (Citation2007) found turbidity fluctuation in raw water makes it difficult to adjust the aluminum dose, leading to unstable water quality and sludge handling challenging to dispose of. The level of oxygen depletion in the USDA (United States Department of Agriculture) (Citation1992) view depended primarily on the amount of waste accumulated, the stream scale, velocity, turbulence, the initial level of DO in the water, and the water temperature. No general trend line was observed of both kd and τc versus DO.
Figure 12. Relationships between soil erodibility parameters (τc and kd) versus turbidity for a) the winter of 2019 and b) the summer of 2020
Nitrogen nutrients and phosphorus influence the ecological processes in rivers and lakes. Increased nitrogen and phosphorus levels will increase the stream’s fertility level, increase oxygen concentration fluctuations, and increase or decrease organisms’ diversity. Vast quantities of nutrient intake cause the area’s algal population to burst. Higher algal populations restrict the entry of sunlight, increase turbidity, increase the demand for biological oxygen, and reduce dissolved oxygen levels.
The results indicated that τc decreased when nutrients increased in water. There is a good inverse relationship of R2 = 0.74 during winter and R2 = 0.80 during summer (). In contrast, Kd increased during winter (R2 = 0.74) and summer (R2 = 0.89). Similar results were found for the relationships between erodibility parameters and phosphorus (). These findings support the results published by Sthiannopkao et al. (Citation2006). Sthiannopkao et al. (Citation2006) found that soil erosion reduces soil fertility and involves sedimentary nutrients and agricultural chemicals that adversely affect water quality.
Figure 13. Relationships between soil erodibility parameters (τc and kd) versus NO3 for a) the winter of 2019 and b) the summer of 2020; and PO4 for c) the winter of 2019 and d) the summer of 2020
3.5. Water quality indices versus soil erodibility parameters
The water quality affected the soil cohesively by changing the clay dispersion properties and aggregate stability characteristics (Malik et al., Citation1992; Shainberg et al., Citation1992). The results of CWQI showed the deterioration of water quality, especially in the summer, due to the increase in temperatures, increased rates of water evaporation, and hence the salinity of water and chemical waste. According to the CWQI, the Tigris River’s quality in Baghdad’s city is ranging from poor to marginal. It goes between acceptable to good according to the IWQI. showed the relationships of two indices that were used to calculate the water quality index on the soil erodibility parameters of the excess shear stress model (τc and kd) during the two seasons. The results of CWQI and IWQI during the winter season showed a strong direct correlation with τc of R2 = 0.86 for τc-CWQI and for τc—IWQI, as shown in . An inverse relationship between CWQI and IWQI versus kd with R2 = 0.90 for kd -CWQI and R2 = 0.86 for kd—IWQI (). Similar results were observed in the summer season but with low correlations (). The aforementioned result is indicated that as water quality improved, riverbanks are more stable (less soil erodibility). Controlling soil erosion, managing nutrients, and controlling wastewater discharged into the river without treatment are the most effective means of improving surface water quality. They are effective environmental agents, maintain inherent fertility, and increase profitability.
Figure 14. Relationships between soil erodibility parameters (τc and kd) versus CWQI and IWQI for a) τc in the winter of 2019, b) kd in the winter of 2019, c) τc in the summer of 2020, and d) kd in the summer of 2020
4. Conclusions
In this study, water and soil samples were acquired during the winter of 2019 and summer of 2020 at five selected sites along Tigris Riverbanks, Baghdad City. The soils were tested using a min-JET device to investigate the seasonal influence of water quality indices on soil erodibility parameters (τc and kd). The relationships between water quality parameters versus τc and kd were investigated, and they distributed along the river using spatial analysis tools of IDW. A new Iraqi Water Quality Index (IWQI) was developed along the Tigris River in Baghdad City and compared with the Canadian water quality index (CWQI). The water quality parameters showed a positive correlation between pH and TSS during the winter season, while the pH correlated with DO during summer seasons. During the winter season, EC showed a strong positive correlation with TDS and SO4 while a week negative correlation with NO3 was observed. The results obtained that the CWQI for the study sites was classified as poor during the winter and summer seasons, while IWQI was classified as good in both seasons. The soil erodibility parameters appeared that sites #3 and #5 have a high kd in the two seasons because of human activity in these sites and wastewater discharged from the facilities without any treatment. One-way ANOVA showed no difference in the value of τc and kd during the two seasons. As values of kd increase, the EC, TDS, TSS, NO3, and PO4 increases, while the values τc decreases. No relationship appeared between soil erodibility parameters versus water pH and DO during the two seasons. There is a strong relationship between CWQI and IWQI versus soil erodibility parameters τc and kd with R2 of more than 0.86 in the winter season, while low correlations were observed in the summer season. It is observed that the sites of poor water quality have high soil erodibility during the two seasons. This study’s significance is to obtain the extent of the Tigris River’s water quality index and its impact on the soil erodibility parameters and their correlations to the riverbank stability.
Nomenclatures
Acknowledgements
The authors acknowledge the Ministry of Water Resources and Environmental Research Center, University of Technology, in Iraq to collaborate and analyze water and soil data. The authors also acknowledge Mustansiriyah University (www.uomustansiriyah.edu.iq) for the support and encouragement throughout this research.
Additional information
Funding
Notes on contributors
Abdul-Sahib T. Al-Madhhachi
The author interested on the behavior of soil erodibility parameters a long riverbanks and beds due to the influence of multi-physical or chemical factors such as soil moisture, seepage forces, plant roots, wastewater chemistry, vegetation, biological crust soil and water quality. Results of this research showed that there was a strong relationship between soil erodibility parameters and water quality parameters and indices. This research could be a key point for future researches in streambank stability.
References
- Abbas, M. N., Al-Madhhachi, A. S. T., & Esmael, S. A. (2019). Quantifying soil erodibility parameters due to wastewater chemicals. International Journal of Hydrology Science and Technology, 9(5), 550–32. https://doi.org/10.1504/IJHST.2019.102915
- Abdulkareem, J. H., Pradhan, B., Sulaiman, W. N. A., & Jamil, N. R. (2019). Prediction of spatial soil loss impacted by long-term land-use/land-cover change in a tropical watershed. Geoscience Frontiers, 10(2), 389–403. https://doi.org/10.1016/j.gsf.2017.10.010
- Ali, A., Al-Ansari, N., & Knutsson, S. (2012). Morphology of Tigris River within Baghdad city. Hydrology and Earth System Sciences, 16(10), 3783–3790. https://doi.org/10.5194/hess-16-3783-2012
- Al-Madhhachi, A. S. T., Al-Mussawy, H. A., Basheer, M. I., & Abdul-Sahib, A. A. (2020). Quantifying Tigris riverbanks stability of southeast Baghdad city using BSTEM. International Journal of Hydrology Science and Technology, 10(3), 230–247. https://doi.org/10.1504/IJHST.2020.107212
- Al-Madhhachi, A. S. T., Mutter, G. M., & Hasan, M. B. (2019). Predicting mechanistic detachment model due to lead-contaminated soil treated with Iraqi stabilizers. KSCE Journal of Civil Engineering, 23(7), 2898–2907. https://doi.org/10.1007/s12205-019-2312-3
- Al-Madhhachi, A. S. T., Rahi, K. A., & Leabi, W. K. (2020). Hydrological impact of Ilisu Dam on Mosul Dam; the River Tigris. Geosciences, 10(4), 120. https://doi.org/10.3390/geosciences10040120
- Al-Obaidy, A. H. M. J., Maulood, B. K., & Kadhem, A. J. (2010). Evaluating raw and treated water quality of Tigris River within Baghdad by index analysis. Journal of Water Resource and Protection, 2(7), 629. https://doi.org/10.4236/jwarp.2010.27072
- Al-Tameemi, I. M., Hasan, M. B., Al-Mussawy, H. A., & Al-Madhhachi, A. T. (2020, July). Groundwater quality assessment using water quality index technique: A case study of Kirkuk Governorate, Iraq. IOP Conference Series: Materials Science and Engineering, 881 (1), 012185. IOP Publishing https://doi.org/10.1088/1757-899X/881/1/012185
- American Society for Testing and Materials (ASTM). (2006) . “Annual Book of ASTM standards 2006”: Nuclear, solar, and geothermal energy. Nuclear energy (II), solar, and geothermal energy. ASTM International.
- APHA, American Public Health Association. (2012). Standard methods for the examination of water and wastewater. 22nd. 1200
- Arora, H. S., & Coleman, N. T. (1979). The influence of electrolyte concentration on flocculation of clay suspensions. Soil Science, 127(3), 134–139. https://doi.org/10.1097/00010694-197903000-00002
- Avecilla, F., Panebianco, J. E., & Buschiazzo, D. E. (2015). Variable effects of saltation and soil properties on wind erosion of different textured soils. Aeolian Research, 18, 145–153. https://doi.org/10.1016/j.aeolia.2015.07.005
- Ballantine, K., & Schneider, R. (2009). Fifty‐five years of soil development in restored freshwater depressional wetlands. Ecological Applications, 19(6), 1467–1480. https://doi.org/10.1890/07-0588.1
- Blaisdell, F. W., Hebaus, G. G., & Anderson, C. L. (1981). Ultimate dimensions of local scour. Journal of the Hydraulics Division, 107(3), 327–337. https://doi.org/10.1061/JYCEAJ.0005630
- Borrelli, P., Robinson, D. A., Fleischer, L. R., Lugato, E., Ballabio, C., Alewell, C., Panagos, P. (2017). An assessment of the global impact of 21st century land use change on soil erosion. Nature Communications, 8(1), 1–13. https://doi.org/10.1038/s41467-017-02142-7
- Canadian Council of Ministers of the Environment. (2001). Canadian water quality guidelines for the protection of aquatic life: CCME water quality index 1.0, user’s manual. Canadian environmental quality guidelines. CCME.
- Chabuk, A., Al-Madhlom, Q., Al-Maliki, A., Al-Ansari, N., Hussain, H. M., & Laue, J. (2020). Water quality assessment along Tigris River (Iraq) using water quality index (WQI) and GIS software. Arabian Journal of Geosciences, 13(14), 1–23. https://doi.org/10.1007/s12517-020-05575-5
- Chang, M. (2006). Forest hydrology: An introduction to water and forests. CRC press.
- Daly, E. R., Fox, G. A., Al-Madhhachi, A. S. T., & Storm, D. E. (2015). Variability of fluvial erodibility parameters for streambanks on a watershed scale. Geomorphology, 231(281–291), 281–291. https://doi.org/10.1016/j.geomorph.2014.12.016
- Daly, E. R., Fox, G. A., Miller, R. B., & Al-Madhhachi, A. S. T. (2013). A scour depth approach for deriving erodibility parameters from jet erosion tests. Transactions of the ASABE, 56(6), 1343–1351. https://doi.org/10.13031/trans.56.10350
- De Santis, F., Giannossi, M. L., Medici, L., Summa, V., & Tateo, F. (2010). Impact of physico-chemical soil properties on erosion features in the Aliano area (Southern Italy). Catena, 81(2), 172–181. https://doi.org/10.1016/j.catena.2010.03.001
- Ewaid, S. H., Abed, S. A., Al-Ansari, N., & Salih, R. M. (2020). Development and evaluation of a water quality index for the Iraqi Rivers. Hydrology, 7(3), 67. https://doi.org/10.3390/hydrology7030067
- Ewaid, S. H., Abed, S. A., & Kadhum, S. A. (2018). Predicting the Tigris River water quality within Baghdad, Iraq by using water quality index and regression analysis. Environmental Technology & Innovation, 11, 390–398. https://doi.org/10.1016/j.eti.2018.06.013
- Fazelabdolabadi, B., & Golestan, M. H. (2020). Towards bayesian quantification of permeability in micro-scale porous structures – The database of micro networks. HighTech and Innovation Journal, 1(4), 148–160. https://doi.org/10.28991/HIJ-2020-01-04-02
- Goldberg, S., & Glaubig, R. A. (1987). Effect of saturating cation, pH, and aluminum and iron oxide on the flocculation of kaolinite and montmorillonite. Clays and Clay Minerals, 35(3), 220–227. https://doi.org/10.1346/CCMN.1987.0350308
- Hanson, G. J. (1990). Surface erodibility of earthen channels at high stresses part ii-developing an in situ testing device. Transactions of the ASAE, 33(1), 132–0137. https://doi.org/10.13031/2013.31306
- Hanson, G. J., & Cook, K. R. (1997). “Development of excess shear stress parameters for circular jet testing”. ASAE Paper, 972227.
- Hanson, G. J., & Cook, K. R. (2004). Apparatus, test procedures, and analytical methods to measure soil erodibility in situ. Applied Engineering in Agriculture, 20(4), 455. https://doi.org/10.13031/2013.16492
- Hashim, Z. E., Al-Madhhachi, A. S. T., & Alzubaidi, L. A. (2020). Behavior of soil erodibility parameters due to biological soil crusts using jet erosion tests. Ecological Engineering, 153(105903), 105903. https://doi.org/10.1016/j.ecoleng.2020.105903
- Hengl, T. (2009). A practical guide to geostatistical mapping. In EUR 22904 EN scientific and technical research series report (2nd ed., pp. 15). Published by Office for Official Publications of the European Communities.
- Hussain, T. S., & Al-Fatlawi, A. H. (2020). Remove chemical contaminants from potable water by household water treatment system. Civil Engineering Journal, 6(8), 1534–1546. http://dx.doi.org/10.28991/cej-020-03091565
- Ismail, A. H. (2014). Applicability of Overall Index of Pollution (OIP) for surface water quality in assessment of Tigris River quality within Baghdad. Engineering and Technology Journal, 32(1 Part (A) Engineering), 74–90.
- Issa, I. E., Al-Ansari, N., Sherwany, G., & Knutsson, S. (2014). Expected future of water resources within Tigris–Euphrates rivers basin, Iraq. Journal of Water Resource and Protection, 6(5), 421–432. https://doi.org/10.4236/jwarp.2014.65042
- Johnson, L., Richards, C., Host, G., & Arthur, J. (1997). Landscape influences on water chemistry in Midwestern stream ecosystems. Freshwater Biology, 37(1), 193–208. https://doi.org/10.1046/j.1365-2427.1997.d01-539.x
- Kachroud, M., Trolard, F., Kefi, M., Jebari, S., & Bourrié, G. (2019). Water quality indices: Challenges and application limits in the literature. Water, 11(2), 361. https://doi.org/10.3390/w11020361
- Khanal, A., Fox, G. A., & Al-Madhhachi, A. T. (2016). Variability of erodibility parameters from laboratory mini jet erosion tests. Journal of Hydrologic Engineering, 21(10), 04016030. https://doi.org/10.1061/(ASCE)HE.1943-5584.0001404
- Lateef, Z. Q., Al-Madhhachi, A. S. T., & Sachit, D. E. (2020). Evaluation of water quality parameters in Shatt AL-Arab, Southern Iraq, using spatial analysis. Hydrology, 7(4), 79. https://doi.org/10.3390/hydrology7040079
- Malik, M., Mustafa, M. A., & Letey, J. (1992). Effect of mixed Na/Ca solutions on swelling, dispersion and transient water flow in unsaturated montmorillonitic soils. Geoderma, 52(1–2), 17–28. https://doi.org/10.1016/0016-7061(92)90072-F
- Muftin, F. S., Nashaat, M. R., & Alazawii, L. H. (2018). Assessing the effects of Al-Rasheed electrical power plant on the quality of Tigris River, Southern of Baghdad by Canadian Water Quality Index (CCME WQI). Iraqi Journal of Science, 59(3A), 1162–1168. http://scbaghdad.edu.iq/eijs/index.php/eijs/article/view/400
- Panhalakr, S. S., & Jarag, A. P. (2016). Assessment of spatial interpolation techniques for river bathymetry generation of Panchganga River basin using geoinformatic techniques. Asian Journal of Geoinformatics, 15, 3.
- Partheniades, E. (1965). Erosion and deposition of cohesive soils. Journal of the Hydraulics Division, 91(1), 105–139. https://doi.org/10.1061/JYCEAJ.0001165
- Raeisi-Vanani, H., Soltani-Toudeshki, A. R., Shayannejad, M., Ostad-Ali-Askari, K., Ramesh, A., Singh, V. P., & Eslamian, S. (2017). Wastewater and magnetized wastewater effects on soil erosion in furrow irrigation. International Journal of Research Studies in Agricultural Sciences (IJRSAS), 3(8), 1–14. https://doi.org/10.20431/2454-6224.0308001
- Rahi, K. A., Al-Madhhachi, A. S. T., & Al-Hussaini, S. N. (2019). Assessment of surface water resources of eastern Iraq. Hydrology, 6(3), 57. https://doi.org/10.3390/hydrology6030057
- Rehman, H., Kamran, M., Basra, S. M. A., Afzal, I., & Farooq, M. (2015). Influence of seed priming on performance and water productivity of direct seeded rice in alternating wetting and drying. Rice Science, 22(4), 189–196. https://doi.org/10.1016/j.rsci.2015.03.001
- Sargaonkar, A., & Deshpande, V. (2003). Development of an overall index of pollution for surface water based on a general classification scheme in Indian context. Environmental Monitoring and Assessment, 89(1), 43–67. https://doi.org/10.1023/A:1025886025137
- Shainberg, I., Levy, G. J., Rengasamy, P., & Frenkel, H. (1992). Aggregate stability and seal formation as affected by drops’ impact energy and soil amendments. Soil Science, 154(2), 113–119. https://doi.org/10.1097/00010694-199208000-00004
- Sparks, D. L., Page, A. L., Helmke, P. A., Loeppert, R. H., Nelson, D. W., & Sommers, L. E. 1996. Total Carbon, Organic Carbon, and Organic Matter. 3rd ed. Madison. 961. Soil Science of America and America Society of Agronomy. https://doi.org/10.2134/agronmonogr9.2.2ed.c29
- Stein, O. R., & Nett, D. D. (1997). Impinging jet calibration of excess shear sediment detachment parameters. Transactions of the ASAE, 40(6), 1573–1580. https://doi.org/10.13031/2013.21421
- Sthiannopkao, S., Takizawa, S., Homewong, J., & Wirojanagud, W. (2007). Soil erosion and its impacts on water treatment in the northeastern provinces of Thailand. Environment International, 33(5), 706–711. https://doi.org/10.1016/j.envint.2006.12.007
- Sthiannopkao, S., Takizawa, S., & Wirojanagud, W. (2006). Effects of soil erosion on water quality and water uses in the upper Phong watershed. Water Science and Technology, 53(2), 45–52. https://doi.org/10.2166/wst.2006.037
- Sutadian, A. D., Muttil, N., Yilmaz, A. G., & Perera, B. J. C. (2016). Development of river water quality indices—a review. Environmental Monitoring and Assessment, 188(1), 58. https://doi.org/10.1007/s10661-015-5050-0
- Turner, R. E., & Rabalais, N. N. (2003). Linking landscape and water quality in the Mississippi River Basin for 200 years. Bioscience, 53(6), 563–572. https://doi.org/10.1641/0006-3568(2003)053[0563:LLAWQI]2.0.CO;2
- USDA (United States Department of Agriculture). (1954). Saline and alkaline soils. Handbook no. 60. Superintendent of Documents, U. S. Government Printing Office Washington 25, D. C.
- USDA (United States Department of Agriculture). (1992). Agri-cultural waste management building design Hand-book. Soil Conservation Service.