
Abstract
Efficient monitoring of combustion process is a key for regulating emissions from engine as well as achieving fuel economy. Various non-intrusive methods of diagnosis for engines include monitoring of noise, and vibrations emitted are attractive options that are cheap, reliable, and need no modifications in the engine set up under test. Combustion process occurring inside combustion chamber of engine provides important information about cyclic efficiency, heat losses, as well as noise and vibration (NVH) performance of engines. Earlier NVH aspects were thought to closely correlate with the development of in-cylinder pressure inside combustion chamber. However, there have been contradictions to this idea prompting the need for further evaluations. The presented work discusses a novel methodology that may be used for analysis of in-cylinder pressure development during the combustion process for a diesel engine. The in-cylinder pressure development in a small-sized diesel engine was analyzed with the aim to extract information about various indicators that characterize the development of combustion processes. Novel indices were developed based on noise, pressure, and vibrations signature of engines , which were much more correlated to combustion process development. The correlative relationship shows the effectiveness of the proposed methodology for condition monitoring for engines.
PUBLIC INTEREST STATEMENT
Combustion process taking place in engines plays an important role in efficiency as well as noise and vibrations (NVH) from the structure of an engine. Previously combustion occurring inside combustion chamber was thought to be closely related to NVH performance of an engine; however, this was not the case. Hence, this work has developed novel indices that were much concurrent with combustion process development. These indices are based on vibration and in-cylinder pressure developed inside the combustion chamber. The presented methodology can form an important aspect of non-intrusive diagnosis of engines for their preventive maintenance.
1 Introduction
Various strict regulations related to noise emissions as well as exhaust emissions are posing serious threats for automotive manufacturers. Control of in-combustion pressure developed is a key aspect of controlling noise, vibration, and harshness (NVH) performance of engines (Kaisan, Anafi, Nuszkowski et al., Citation2017a; Kaisan, Anafi, Nuszkwoski, Kulla, Umaru et al., Citation2017a). The combustion process analysis can be manifested using installation of piezo-resistive sensors to monitor the in-cylinder pressure developed. Fluctuations in engine speed can be used to extract information about combustion process. Such a correlation has been analyzed in previous literature (Kaisan et al., Citation2016; Kaisan, Anafi, Nuszkwoski et al., Citation2017b). Rapid pressure rise due to rapid detonation causes structural vibrations in engines that may be captured using block mounted accelerometers in different orientations on engine (Umaru et al., Citation2017). Information about injection condition from airborne acoustic signals was analyzed by Yang et al. (Kaisan, Anafi, Nuszkwoski, Kulla, Umaru et al., Citation2017b). Combustion pressure was decomposed into pseudo-motored, combustion and resonance components for combustion noise analysis (Zheng et al., Citation2002). Comparisons of steady state and transient running conditions of the engine were done with an aim to evaluate its correlation with the in-cylinder pressure measurement. Narayan analyzed noise emissions from combustion engines and concluded that the same trends were seen in in-noise emissions in spite of change in pressure spectrum. Hence, more precise methodology was needed to diagnose noise and vibrations emitted from engines (Sunny Narayan, Citation2016).
The objective of this article is to analyze results from tests done on an experimental gasoline engine test rig in order to investigate the possible correlation between combustion process and noise emission from engine. The relationship between noise emission and in-cylinder pressure development was investigated. The novelty of the present work lies in the development of novel indices based on noise emissions that were more correlated with in-cylinder pressure developed. The proposed methodology forms an important aspect of non-intrusive methodology of diagnosis.
2. Background of combustion noise
This type of noise in engines originates from combustion taking place inside cylinders (Beranek & Vér, Citation1992; Ibarra et al., Citation2016; Mahajan & Rajopadhye, Citation2013; Sunny Narayan, Citation2016). Then fuel injecting in the combustion chamber (where high-pressure air is already present), part of ignitable gas, starts to burn, causing a rapid rise in pressure as well as temperatures inside the chamber. The pressure wave thus generated strikes the walls of combustion chamber, causing resonance of the whole structure. Oscillations arising due to resonance have frequency (fg) that can be estimated from engine bore diameter (D) and wave propagation speed (Cc) as
fg = Cc/2 g (1)
These vibrations are next radiated in air through engine structure and are perceived as noise emissions. The intensity of combustion noise (I) is dependent on the values of maximum pressure value (Pmax) and maximum value of pressure rise rate as (Giakoumis et al., Citation2016; Torii, Citation2014; Torregrosa et al., Citation2007; Yang & Feng., Citation2012):
Iα[(dP/dt) max * Pmax]2 (2)
Further, the analysis of spectrum plot of in-cylinder pressure is done in .
Figure 1. (a, b) Variations of in-cylinder pressure with rank angle, pressure spectrum
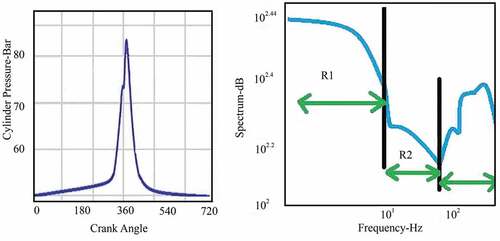
The above plot is marked by the following three distinct regions (Yang & Feng., Citation2012; Torregrosa et al., Citation2007; Torii, Citation2014; Giakoumis et al., Citation2016; Broatch et al., Citation2016,17; Mahroogi & Narayan, Citation2019a, Citation2019).A, Citation2019b):
Region 1 (R1) of the low-frequency ranges—in this region, the shape of the curve depends upon the peak cylinder pressure developed. The higher the maximum value of cylinder pressure, the higher the magnitude of the peak in the low-frequency range.
Region 2 (R2) of the medium-frequency range—in this range, the spectrum levels show a logarithmic decrement with slopes depending on the rate of cylinder pressure rise. Larger values of pressure gradient cause steeper slopes.
Region 3 (R3) of higher frequency range—in this range, the rapid evolution of in-cylinder pressure occurs due to the onset of combustion process, which results in high-frequency vibrations of the cylinder structure having amplitude dependent on the second cylinder pressure derivative.
There the injection of fuel is carried out in three phases of pre-injection, main injection, and post-injection. There is a delay time between the injection of fuel inside combustion chamber and the actual start of combustion process. Larger delays may lead to higher levels of NOx formation. To make this delay period short, a small amount of fuel is pre-injected before the start of the main injection. This is achieved by rate shaping as seen in . Rate shaping curve may be rectangular, step, or boot type in shape. Torque and power produced in engine mainly depend on the duration of the main injection period. Post-injection of fuel is done in order to reduce the soot emissions and in some cases may be useful for exhaust gas recirculation treatment. It has been reported that post-injection may reduce the rate of soot formation by about 70% without increasing the fuel consumption.
Figure 2. Phases of fuel injection in diesel engines
3. Literature review
Payri developed indicators, which are representative of the peak velocity of fuel burning and the resonance in the combustion chamber, are well correlated with the combustion noise mark obtained from jury testing (Payri et al., Citation2008). The computational fluid dynamic (CFD) model was established for a two-stroke marine diesel engine technological method to optimize marine diesel engine emissions (Xiu Xiu et al., Citation2017). Ramanlingam et al. (Ramalingam et al., Citation2019) conducted various experiments with biodiesel fuels at different proportions. The results showed that the A20 (20% of biodiesel + 80% diesel) significantly improves the performance, combustion, and reduction in emissions. Huang et al. (Huang et al., Citation2011) used in-cylinder pressure data to develop combustion indices. Liu et al. (Liu et al., Citation2016) concluded that short dwell between pilot and main injection and increasing pilot injection quantity enhances the high-frequency combustion noise. Vellaiyan et al. (Vellaiyan et al., Citation2018) analyzed the combustion, performance, and emission characteristics of water-emulsified soybean biodiesel fueled diesel engine with alumina nano additive. Mina Tedros et al. (Tedros et al., Citation2020) presented an optimization model to fit the calculated in-cylinder pressure diagram to the experimental data by finding the optimal values of the start angle of injection and the amount of injected fuel for different engine loads. Yamasaki et al. (Yamasaki et al., Citation2019) introduced control a concept with the aim to decrease the fuel consumption by increasing the thermal efficiency and reducing the combustion noise in real-world operation. Broatch et al. (Broatch et al., Citation2020) showed that the acoustic signature was influenced by the intensity of the premixed combustion rather than by the pressure rise rate. Katrasnik et al. (Katrasnik et al., Citation2006) developed a new criterion for the determination of the start of combustion (SOC) from the diesel engine in-cylinder pressure diagram based on the maximum of the third-order derivative of the cylinder pressure with respect to the crank angle. Zheng et al. (Zheng et al., Citation2020) found that the energy of high-frequency oscillation reached peak at medium–high speed and increased with engine load and rail pressure.
4. Materials and methods
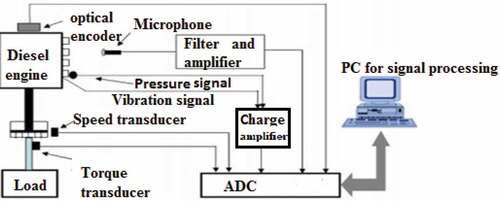
Experiments were conducted on a KPKN2520 type, single-cylinder diesel Kirloskar rig having specifications as presented in . shows the general layout of test rig with placement of various sensors. This engine has a torque transducer for measurement of torque output. An optical encoder was used to detect dead center locations. An AVL GU13P-type piezoelectric transducer was used to acquire the instantaneous in-cylinder pressure data having various features presented in . Various block vibrations were recorded by Endveco7240C make Mono axial accelerometers having features shown in . A 4939-type Bruel and Kjaer free-field ¼″ make microphone having a preamplifier (type 2670) was used to acquire various noise emission signals. The main features of this transducer are shown in .
Figure 3. A general layout of experimental set up
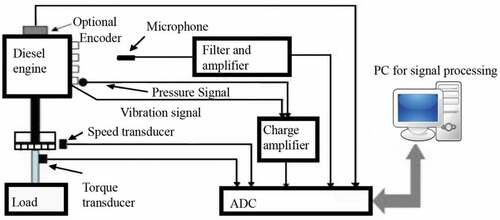
Table 1. Specification of engine
Table 2. Pressure transducer specifications
Table 3. Accelerometer transducer specifications
Table 4. Microphone transducer specifications
Various testing conditions are enlisted in , which were achieved by changing fuel injection parameters. In-cylinder pressure, noise, and vibrations emissions from engine were monitored by sensors having specifications as enlisted in –5. Case C, G was taken as reference base testing cases with fuel injected at 3,600 RPM engine speed and 700 bar injection pressure. A 1 mm3/stroke of fuel was injected during pre-injection period as well as the main injection period at crank angle positions 6° and 10° before top dead center positions of these cases.
Table 5. Fuel injection conditions
5. Statistical analysis
This methodology is needed in research projects for the study of design, sample collection, management, and analysis. Statistical models are powerful analytical tools, which include regression analysis. Herein, a data model describes the relationship between predictor and response variables. Linear regression fits a data model that is linear in the model coefficients. The most common type of linear regression is a least-squares fit, which can fit both lines and polynomials, among other linear models.
Figure 4. In-cylinder pressure spectrum—base test case G
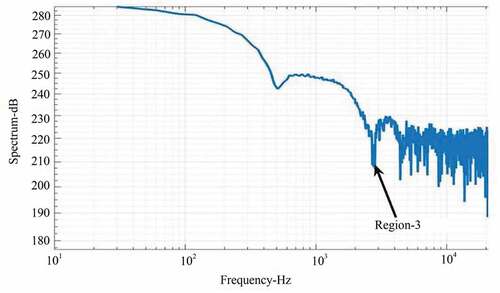
Figure 5. In-cylinder pressure developed—cases A (main injection period started 1° crank angle later) and B (fuel injection pressure increased by 10 bars)
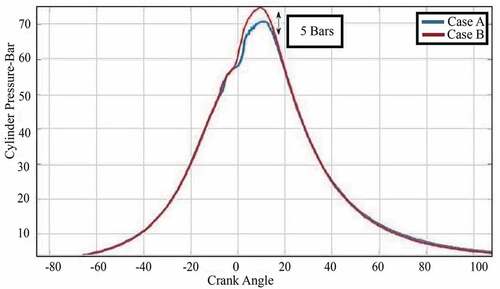
Figure 6. Variations of cylinder pressure developed with crank angle—cases C (base case) and D (pre-injected fuel amount increase by 1 mm3/stroke)
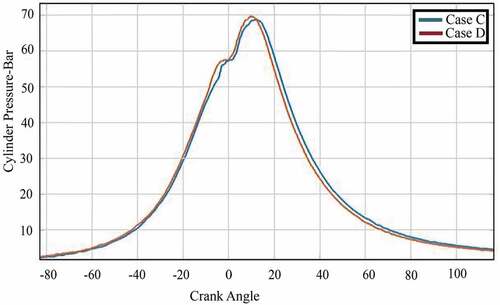
Figure 7. Variations of in-cylinder pressure rise rate with crank angle—base cases (C), E (main injection timing delayed by a period of 2º crank angle degrees), and F (fuel injection pressure reduced to 650 bar)
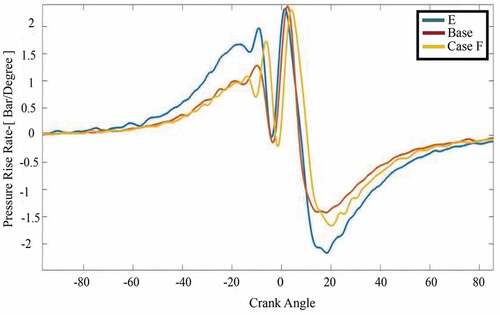
Figure 8. Cylinder pressure spectrum—base (C), E (main injection timing delayed by 2º crank angle degrees), and F (fuel injection pressure was reduced to 650 bars)
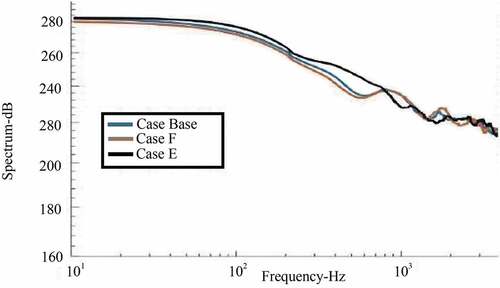
Figure 9. Variation of in-cylinder pressure rise rate with crank angle—H (speed reduced to 2,000 RPM) and G (base case 3,600 RPM)
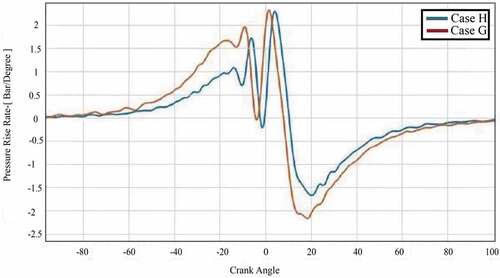
Figure 10. Cylinder pressure spectrum—G (base case 3,600 RPM) and H (speed reduced to 2,000 RPM)
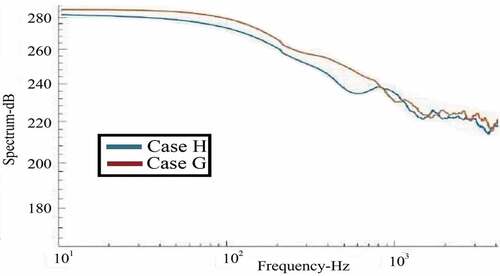
Figure 11. Comparison of engine pressure spectrum cases I (main injection timing was retarded by 3º crank angle degrees) and J (main injection timing was advanced by 3º crank angle degrees)
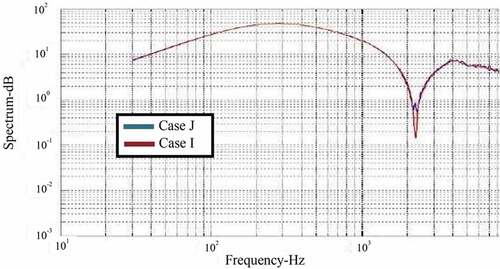
Figure 12. Variations in MBF50 (mean burnt fuel—50%) and MBF100 (mean burnt fuel—100%) with crank angle
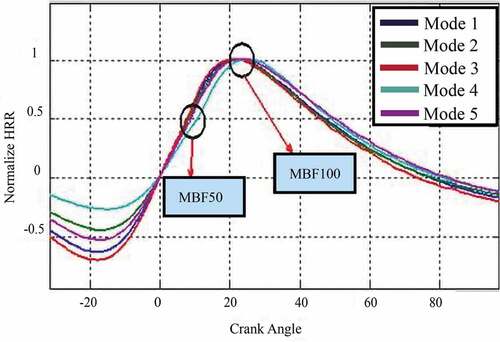
Figure 13. Combustion noise indices
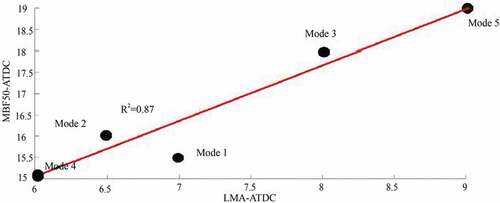
Regression‐based adjustment is a powerful method to control for confounders and help inference accuracy. In the presence of multiple covariates, some researchers are tempted to adjust for all covariates in the hope of deriving the best possible unbiased association. However, appropriate adjustment requires substantive knowledge, and not all associations need adjustment. For example, adjustment for a covariate that does not affect the bias of the causal association between exposure and outcome is unnecessary. demonstrate the correlation between various variables wherein a reasonable coefficient of correlation of range 0.77–0.99 was observed between various proposed novel indices.
Figure 14. Correlation between noise index (NI) and combustion index (CI)
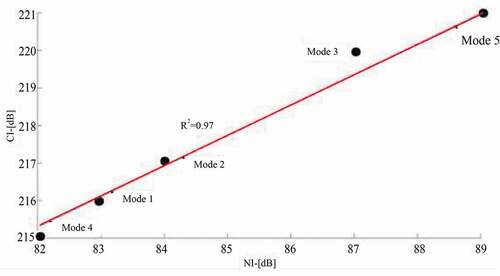
Figure 15. Correlation between maximum pressure rise rate (MPRR) and noise index (NI)
Figure 16. Correlation between location of MBF50 (mean burnt fuel—50%) and noise index (NI)
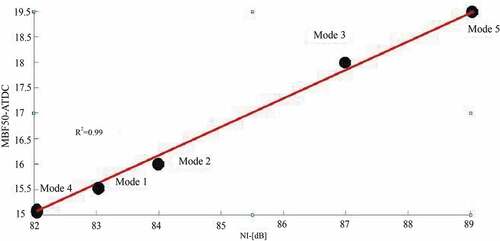
Figure 17. Correlation between location of start of injection-degree before TDC (SOIpre) and location of start of combustion noise (SCN)
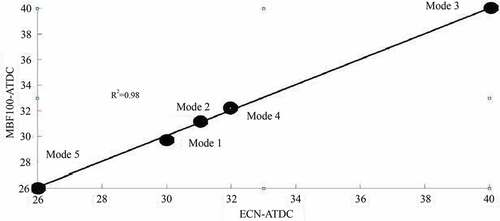
Figure 18. Correlation between location of MBF100 (mean burnt fuel—100%) and location of end of combustion noise (ECN)
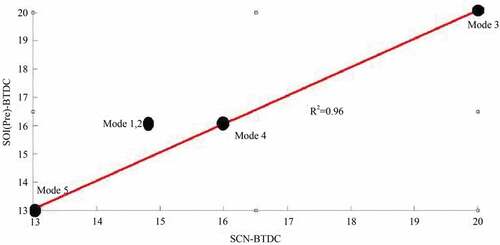
Figure 19. Correlation between location of MBF50 (mean burnt fuel—50%) and location of least value of filtered accelerometer (LMA)
6. Results and discussion
The in-cylinder pressure spectrum plot () was obtained by operating the test engine at 3,600 RPM speed under 100% full load condition with fuel injection pressure maintained at 700 bars as denoted by test case G in . As observed from this figure, region 3 (as defined in the previous section) of pressure spectrum begins around a frequency of 2,800 Hz. To find the relevant frequency ranges corresponding to other regions, tests were further carried out by changing various injection parameters taking test cases C, G (3,600 RPM, full load, 700 bars) as a base reference case.
Plots of in-cylinder pressure were next analyzed from . From these plots, differences in the maximum value of in-cylinder pressure levels were 5 bars for the test cases A and B.
The maximum value of in-cylinder pressure levels for cases C and D was almost similar in spite of changes in fuel injection parameters.
By retarding the main injection timing by 2º CAD, the test case was denoted by condition E. Condition F denotes the condition when injection pressure was reduced to 650 bars. It is clear from that the engine noise for condition E is higher than condition F in spite of almost same peak pressure rise rates ().
Next engine noise levels and in-cylinder pressure levels were analyzed for two other test cases marked by G and H. During these cases, the injection pressure was kept same at 700 bars, but speeds of engine were 3,600 and 2,000 RPM, respectively.
It is clear from that even though peak pressure rise rates are almost equal, the noise emitted during case G was lower compared to case H (). Hence, it can be concluded that in-cylinder pressure developed as well as pressure rise rates have poor correlation with engine noise levels. So, another suitable index was needed as an alternative.
shows plots of cylinder pressure levels for two conditions denoted by cases I and J in which the main injection timing was retarded by 3º CAD and advanced by 3° crank angle degrees (CAD), respectively, compared to base testing case. It can be seen that a good correlation was observed in the pressure spectrum for these two cases in the frequency range of 215–2,800 Hz of A-weighted filter SPL.
Hence, a novel index defining combustion noise needs to be developed based on the above- mentioned frequency range. This index is defined as the sum of in-cylinder pressure spectrum in 215–2,800 Hz frequency range, that is,
CI = 10*log [10(215/10) + … +10(2800/10)] (3)
For this purpose, five different tests were done by operating engine at 3,600 RPM under full load conditions as seen in by varying fuel injection parameters.
Table 6. Modes of fuel injection
Mode 1 was taken as a reference test case, and various injection parameters were changed with respect to this case. During the second one, the amount of fuel injected during pre-injection period was increased by 1 mm3/stroke. During the third mode, the pre-injection timing was advanced by 4° CAD with respect to the reference case. During the fourth mode, the main injection timing was retarded by 2° CAD with respect to case 1. During the fifth one, both pre- as well as main injection timings were advanced with respect to mode 1 by 3° CAD and 1° CAD, respectively. In order to devise a control system that utilizes noise emissions from engines as an effective method to monitor combustion process, the acquired signals were analyzed to formulate certain indices that could be correlated with quality of combustion and hence combustion noise. These indices have been defined as follows:
Combustion index (CI): As defined in the previous section.
MBF50 and MBF100: Crank angle locations at which 50% and 100% of fuel is burnt as calculated from the normalized values of heat release rates shown in .
Peak pressure rise rate (MPRR): It is defined as the maximum value of in-cylinder pressure observed during an engine cycle.
Least value of filtered accelerometer signals (LMA): This denotes the crank angle locations corresponding to minimum value of filtered vertical accelerometer signals as the previously defined section.
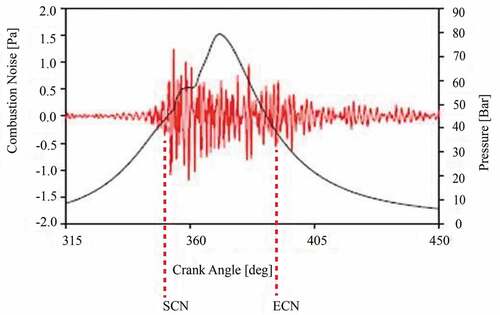
From the viewpoint of radiated noise, the following indices are most relevant as shown in :
Start of combustion noise (SCN): It is defined as the value of crank angle at which filtered noise emissions (in frequency range dominated by combustion) from the engine are higher than 0.5 Pa for the next 10° CAD.
End of combustion noise (ECN): It is defined as the value of crank angle at which filtered noise emissions (in frequency range dominated by combustion) from the engine are lower than 0.5 Pa for the next 10°CAD.
Noise index (NI): It is defined as the sum of noise spectrum in 0.5–3.8 kHz frequency range (in which the energy of combustion is concentrated).
Further relationships between various indices were investigated as shown in based on regression analysis.
7. Conclusions and recommendations
This work investigated use of noise, vibration, and in-cylinder pressure development data for the diagnosis of combustion process in a diesel engine. Various regions of in-cylinder pressure spectrum were visualized and subsequently relevant combustion noise indices were developed by changing various fuel injection parameters. Higher levels of correlations were observed between data obtained from these indices, and the parameters related to actual in pressure developed.
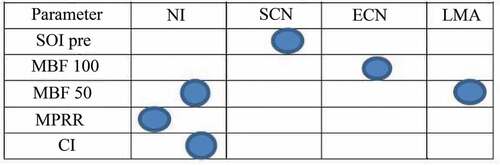
summarizes the relationship between various indices developed in the current work, where circles denote the established correlation.
Figure 20. Summary of various correlation results
For future work, a closed loop control system as shown in may be developed having the possibility of using vibration signature of engine as a possible input feedback parameter. Thus, an effective control mechanism over combustion noise can be achieved by devising optimum MBF50/MBF100 timings (ChangweiJi et al., Citation2012).Performance; F.O. Mahroogi et al., Citation2018; GrujicI. et al., Citation2020; Javad Zareei et al., Citation2020; M.U. Kaisan et al., Citation2018; Narayan, Citation2013a, Citation2013b, Citation2014, Citation2015a, Citation2015b, Citation2015c, Citation2015d; Narayan, Alsagri et al., Citation2019; Narayan & Gupta, Citation2018; Narayan, Milojevic et al., Citation2019; Stojanovic et al., Citation2020; TengSu et al., Citation2017a, Citation2017b; WojciechTutak et al., Citation2020; Xiu Minyu et al., Citation2019; Yaodong Du et al., Citation2016). Herein, vibration signals from engines can be used to estimate the MBF locations that may be fed into micro controller that optimize the fuel injection timings to reduce engine NVH.
Figure 21. Closed feedback loop
Nomenclature
I: Intensity of combustion noise
P max : Maximum combustion pressure value
(dP/dt)max: Maximum value of pressure rise rate
DI: Direct injection
RPM: Revolutions per minute
SOIpre : Start of pre-injection period
SOIMain: Start of main injection period
Q pre : Amount of fuel injected during pre-injection period (mm3/stroke)
Qmain : Amount of fuel injected during main injection period (mm3/stroke)
CAD: Crank angle degree
CI: Combustion index
NI: Noise index
fg: Resonant frequency
D: Engine bore diameter
Cc: Wave speed
TDC: Top dead center
MBF50: Crank angle locations at which 100% of fuel is burnt
MBF100: Crank angle locations at which 50% of fuel is burnt
MPRR: Peak pressure rise rate
LMA: Crank angle location at which least value of filtered accelerometer signals is observed
SCN: Start of combustion noise
ECN: End of combustion noise
Additional information
Funding
Notes on contributors

Muhammad Usman Kaisan
Dr. Muhammad Usman Kaisan is a Senior Lecturer and Deputy Director in Equipment Maintenance and Development Centre of Ahmadu Bello University, Zaria, Nigeria. His areas of interest include: Automotive systems, Biofuels, Extensive Energy Modelling, Engine Performance Optimization and Emissions Control.
S. Narayan
Dr. S. Narayan is working with Qassim University, Saudi Arabia. His areas of interest include: Automotive systems, NVH, Thermo-fluid systems and Emissions Control.
Najib Aminu Ismail
Dr. Najib Aminu Ismail and Dr. Yusuf Suleiman Dambatta are Lecturers in Ahmadu Bello University, Zaria, Nigeria in Mechanical Engineering Department.
References
- Beranek, L. L., & Vér, I. L. (1992). Noise and vibration control engineering. principlesand applications. John Wiley & Sons.
- Broatch,, Novella, R., García-Tíscar, J., Gomez-Soriano, J., and Pal, P.. (2020). Analysis of combustion acoustic phenomena in compression–ignition engines using large eddy simulation. Physics of Fluids, 32(8), 085101. https://doi.org/10.1063/5.0011929
- Broatch, A., Margot, X., Novella, R., Gomez-Soriano, J. (2016). Combustion noise analysis of partially premixed combustion concept using gasoline fuel in a 2-stroke engine. Energy ,107, 612–18. https://riunet.upv.es/handle/10251/81010
- Changwei, Ji., Wang, S., Zhang, Bo. (2012).Performance). of a hybrid hydrogen–gasoline engine under various operating conditions. Applied Energy, 97, 584–589. Hirzel Verlag publication. https://doi.org/10.1016/j.apenergy.2011.11.056
- Giakoumis, E. G., Rakopoulos, D. C., & Rakopoulos, C. D. (2016). Combustion noise radiation during dynamic internal combustion engine operation including effects ofvarious biofuel blends: A review. Renewable and Sustainable EnergyReviews, 54, 1099–1113. https://doi.org/10.1016/j.rser.2015.10.129
- GrujicI.,, Stojanovic, N., Pesic, R., Davinic, A., & Narayan, S. (2020). High-Pressure hydrogen injection numerical analysis of IC engine operation with high pressure hydrogen injections. Transactions of FAMENA, 44(1), 55‐56. https://hrcak.srce.hr/file/343994
- Huang, Y., Yang, F., Ouyang, M., Chen, L. (2011).Optimal feedback control with in- cylinder pressure sensor under engine start conditions. SAE Technical Paper 2011-01-1422.
- Ibarra, D., Ramirez-Mendoza, R., & Lopez, E. (2016). A new approach for estimating noise emission of automotive vehicles. In Acta Acustica united with Acustica (Vol. 102, pp. 930–937).
- Javad. Z., Rohani, A. (2020). Optimization and study of performance parameters in an engine fueled with hydrogen. International Journal of Hydrogen Energy, 45(1), 322–336. https://doi.org/10.1016/j.ijhydene.2019.10.250
- Kaisan, M. U., Abubakar, S., Ashok, B., Dhinesh, B., Narayan, S., Ivan, G., & Nadica, S. (2018). Comparative analyses of biodiesel produced from Jatropha and neem seed oil using a gas chromatography mass spectroscopy technique. Biofuels, Taylor and Francis. https://doi.org/10.1080/17597269.2018.1537206
- Kaisan, M. U., Anafi, F. O., J., N., Kulla,, D. M., & Umaru, S. (2016). GC-MS analyses of biodiesel produced from cotton seed oil. Nigerian Journal of Solar Energy, 27, 56–61. https://www.researchgate.net/publication/312136768_GCMS_Analysis_of_Methyl_Esters_of_Biodiesel_Produced_from_Cotton_Seed_Oil
- Kaisan, M. U., Anafi, F. O., Nuszkowski, J., Kulla, D. M., & Umaru, S. (2017a). calorific value, flash point and cetane number of biodiesel from cotton, jatropha and neem oil binary and Multi-Blends with diesel. Biofuels, 8(4), 1–7.
- Kaisan, M. U., Anafi, F. O., Nuszkwoski, J., Kulla, D. M., & Umaru, S. (2017a). Exhaust emissions of biodiesel binary and multi-blends from cotton, jatropha and neem oil from stationary multi cylinder CI Engine. Transportation Research Part D: Transport and Environment, 53, 403–414. https://doi.org/10.1016/j.trd.2017.04.040
- Kaisan, M. U., Anafi, F. O., Nuszkwoski, J., Kulla, D. M., & Umaru, S. (2017b). Cold flow properties and viscosity of biodiesel from cotton, jatropha and neem binary and Multi-Blends with diesel. African Journal of Renewable and Alternative Energy, 1(1), 80–89. https://www.researchgate.net/profile/Kaisan-Muhammad-Usman/publication/320299769_COLD_FLOW_PROPERTIES_AND_VISCOSITY_OF_BIODIESEL_FROM_COTTON_JATROPHA_AND_NEEM_BINARY_AND_MULTI-BLENDS_WITH_DIESEL/links/59dcaee8458515e9ab4c9825/COLD-FLOW-PROPERTIES-AND-VISCOSITY-OF-BIODIESEL-FROM-COTTON-JATROPHA-AND-NEEM-BINARY-AND-MULTI-BLENDS-WITH-DIESEL.pdf
- Kaisan, M. U., Anafi, F. O., Nuszkwoski, J. D. M., & Umaru, S. (2017b). Fuel properties of biodiesel from cotton, jatropha binary and Multi-Blends with diesel. Nigerian Journal of Material Science and Engineering, 7(1), 55–61. https://www.researchgate.net/profile/Kaisan-Muhammad-Usman/publication/320299769_COLD_FLOW_PROPERTIES_AND_VISCOSITY_OF_BIODIESEL_FROM_COTTON_JATROPHA_AND_NEEM_BINARY_AND_MULTI-BLENDS_WITH_DIESEL/links/59dcaee8458515e9ab4c9825/COLD-FLOW-PROPERTIES-AND-VISCOSITY-OF-BIODIESEL-FROM-COTTON-JATROPHA-AND-NEEM-BINARY-AND-MULTI-BLENDS-WITH-DIESEL.pdf
- Katrasnik, T., Trenc, F., Opresnik, S. R. (2006). A New Criterion to Determine the Start of Combustion in Diesel Engines. Journal of Eng. Gas Turbines Power, 128(4), 928–933. https://doi.org/10.1115/1.2179471
- Liu, L., Fei, H., & Du, J. (2016). Analysis of Pilot Injection Effects on Combustion Noise in PPCIDiesel Engines. In ASME 2016 Internal Combustion Engine Division Fall Technical Conference ICEF2016-9356.Greenville.
- Mahajan, S. R., & Rajopadhye, R. D. (2013). Transportation Noise and Vibration-Sources. Prediction and Control. International Journal of Soft Computing and Engineering, 3(5), 2231–2307. https://citeseerx.ist.psu.edu/viewdoc/download?doi=10.1.1.644.7096&rep=rep1&type=pdf
- Mahroogi, F. O., & Narayan, S. (2019a). Dynamic analysis of piston secondary motionusing FEM method. Proceedings of the 26th International Congress on Sound and Vibration, ICSV, 7–11 July, Montreal,Canada.
- Mahroogi, F. O., & Narayan, S. (2019b). Design and analysis of double wishbonesuspension system for automotive applications. International Journal of Mechanical and Production Engineering Research and Development, 9(4), 1433–1432.
- Mahroogi, F. O., & Narayan, S. (2019).A recent review of hybrid automotive systems in Gulf Corporation Council region. Proceedings of the Institution of Mechanical Engineers, Part D, Montreal, Canada. Journal of AutomobileEngineering, 233( 14), 3579–3587.
- Mahroogi, F. O., Narayan, S., & Gupta, V. (2018). Acoustic transfer function in gasoline engines. International Journal of Vehicle Noise and Vibration, 14(3), 270–280. https://doi.org/10.1504/IJVNV.2018.097212
- Narayan, S. (2013a). .Effect of dwell time on noise radiated from diesel engines. International Journal of Applied EngineeringResearch, 8(11), 1339–1347. https://www.ripublication.com/Volume/ijaerv8n11.htm
- Narayan, S. (2013b). Wavelet analysis of diesel engine noise. Journal of Engineeringand AppliedSciences, 8(8), 255–259. https://medwelljournals.com/abstract/?doi=jeasci.2013.255.259
- Narayan, S. (2014). A review of diesel engine acoustics. FME Transactions, 42(2), 150–154. https://doi.org/10.5937/fmet1402150N
- Narayan, S. (2015a). Piston slap noise in engines. International Journal ofApplied EngineeringResearch, 8(14), 1695–1700. https://www.ripublication.com/Volume/ijaerv8n14.htm
- Narayan, S. (2015b). Analysis of piston slap motion. IJAME, 20(2), 445–450. https://doi.org/10.1515/ijame-2015-0030
- Narayan, S. ( 2015-01-0107). (2015c). Modeling of Noise Radiated from Engines. SAE Technical Paper.
- Narayan, S. (2015d). Effects of Various Parameters on Piston Secondary Motion, SAE Technical Paper, 2015-01-0079. http://www.sae.org/publications/technical-papers/content/2015-01-0079/
- Narayan, S., et al. (2020). Effects of propanol and camphor blends on emissions and performance of a spark ignition engine. American Chemical Society (ACS) Omega, 5(41), 26454–26462. https://doi.org/10.1021/acsomega.0c02953
- Narayan, S., Alsagri, A. S., & Gupta, V. (2019). The design and analysis of hybrid automotive suspension system. International Journal of Mechanical and Production Engineering Research andDevelopment, 9(4), 637–642. https://issuu.com/tjprc/docs/63.ijmperdaug201963
- Narayan, S., & Gupta, V. (2018). Numerical analysis of secondary motion of piston skirtin Engines. International Journal of Acoustics andVibrations, 23(4), 557–565. https://iiav.org/ijav/content/volumes/23_2018_745361521539384/vol_4/1513_fullpaper_293891545067945.pdf
- Narayan, S., Milojevic, S., & Gupta, V. (2019). Combustion monitoring in enginesusing accelerometer signals. Journal of Vibroengineering, 21(6), 1552–1563. https://doi.org/10.21595/jve.2019.20516
- Narayan, S. (2016). Noise and vibration characteristics of a micro car diesel engine. University of Roma Tre.
- Payri, F., Broatch, A., Margot, X., & Monelletta, L. (2008). Sound quality assessmentof Diesel combustion noise using in-cylinder pressure components. Measurement Scienceand Technology, 20(1). IOP Publishing Ltd. https://ui.adsabs.harvard.edu/abs/2009MeScT..20a5107P/abstract
- Ramalingam, S., and Rajendran, S. (2019). Assessment of performance, combustion, and emission behaviour of novel annona biodiesel-operated diesel engine. Advances in Eco-Fuels for a Sustainable Environment. Woodhead Publishing Series in Energy: (pp. 391–405). Wood head publishing.
- Stojanovic, N., Ghazaly, N. M., Grujic, I., Glišovic, J., & Narayan, S. (2020). Influence of size of ventilated brake disc’s ribs on air flow velocity. International Journal of Advanced Science and Technology, 29(1), 637–647. http://sersc.org/journals/index.php/IJAST/article/view/3285
- Tedros, M., et al. (2020). Data Driven In-Cylinder Pressure Diagram BasedOptimization Procedure. Journal of Material Science And. Engineering, 8(4), 294. https://www.mdpi.com/2077-1312/8/4/294
- Teng, Su., Changwei, Ji., Shuofeng, Wang., Lei, Shi., Jinxin, Yang., Xiaoyu, Cong (2017a). Effect of spark timing on performance of a hydrogen-gasoline rotary engine. Energy Conversion and Management, 148(15), 120–127. https://doi.org/10.1016/j.enconman.2017.05.064
- Teng, Su., Changwei, Ji., Shuofeng, Wang., Lei, Shi., Jinxin, Yang., Xiaoyu, Cong. (2017b). Investigation on combustion and emissions characteristics of a hydrogen-blended n-butanol rotary engine. International Journal of Hydrogen Energy, 42(41), 26142–26151. https://doi.org/10.1016/j.ijhydene.2017.08.200
- Torii, K. (2014). Method using multiple regression analysis to separate engine radiation noise into the contributions of combustion noise and mechanical noise in the time domain. SAE International Journal of Engine, 7(3), 1502–1513. https://doi.org/10.4271/2014-01-1678
- Torregrosa, A. J., Broatch, A., Martín, J., Monelletta, L. (2007). Combustion noise level assessment in direct injection diesel engines by means of in-cylinder pressure components. Measurement Science Andtechnology, 18(7), 2131–2142. IOP publishingltd https://doi.org/10.1088/0957-0233/18/7/045
- Umaru, S., Kaisan, M. U., Usman, S., & Giwa, A. (2017). Effects of Garment Laundry Activities on the Slider Lock and Crosswise Strengths of NylonCoil Zippers. Nigerian Journal of Material Science and Engineering, 7(1), 81–86. https://www.researchgate.net/publication/316702019_EFFECTS_OF_GARMENT_LAUNDRY_ACTIVITIES_ON_THE_SLIDER_LOCK_AND_CROSSWISE_STRENGTHS_OF_NYLON_COIL_ZIPPERS/figures?lo=1&utm_source=google&utm_medium=organic
- Vellaiyan, S., Subbiah, A., & Chockalingam, P. (2018). Combustion, performance, and emission analysis of diesel engine fuelled with water-biodiesel emulsion fuel and nano additive. Environmental Science and Pollution Research, 25(33), 33478–33489. https://doi.org/10.1007/s11356-018-3216-3
- Tutak, W., Jamrozik, A., Grab-Rogaliński, K. (2020). Effect of natural gas enrichment with hydrogen on combustion process and emission characteristic of a dual fuel diesel engine. International Journal of Hydrogen Energy, 45(15), 9088–9097. https://doi.org/10.1016/j.ijhydene.2020.01.080
- Xiu Minyu., Guanting, Li., Yaodong, Du., Zezhou, Guo., Zhen, Shang., Fengshuo, He., Qingxu, Shen., Decheng, Li., Yinan, Li. (2019). A comparative study on effects of homogeneous or stratified hydrogen on combustion and emissions of a gasoline/hydrogen SI engine. International Journal of Hydrogen Energy, 44(47), 25974–25984. https://doi.org/10.1016/j.ijhydene.2019.08.029
- Xiu Xiu, S., Xingyu, Liang.,Gequn, Shu., Jiansheng, Lin., Yuesen, Wang., Yajun, Wang. (2017). Numerical investigation of two-stroke marine diesel engine emissions using exhaust gas recirculation at different injection time. Ocean Engineering, 144, 90–97. https://doi.org/10.1016/j.oceaneng.2017.08.044
- Yamasaki, Y., Ikemura, R., Takahashi, M., Shimizu, F., & Kaneko, S. (2019). Simple combustion model for a diesel engine with multiple fuel injections. International Journal of EngineResearch, 20(2), 167–180. https://journals.sagepub.com/doi/full/ 10.1177/1468087417742764
- Yang, C., & Feng., T. (2012). Abnormal Noise Diagnosis of Internal Combustion Engine Using Wavelet Spatial Correlation Filter and Symmetrized Dot Pattern. Applied Mechanicsand Materials, 141, 168–173. https://doi.org/10.4028/www.scientific.net/AMM.141.168
- Yaodong, Du., Xiumin, Y., Jinlong, W., Haiming, W., Wei, D., Jiaqi, G. (2016). Research on combustion and emission characteristics of a lean burn gasoline engine with hydrogen direct-injection. International Journal of Hydrogen Energy, 41(4), 3240–3248. https://doi.org/10.1016/j.ijhydene.2015.12.025
- Zheng, G. T., & Leung, A. Y. T. (2002). Internal combustion engine noise analysis time-frequency distribution. Journal of Engineering for Gas Turbines and Power, 124(3), 645–649. https://doi.org/10.1115/1.1455639
- Zheng, Xu., Zhou, N., Qiu, Y., Liu, R., & Hao, Z. (2020). Experimental Investigation on the High-frequency Pressure Oscillation Characteristics of a Combustion Process in a DI Diesel Engine. .Energies, 13(4), 871. https://doi.org/10.3390/en13040871