
 ?Mathematical formulae have been encoded as MathML and are displayed in this HTML version using MathJax in order to improve their display. Uncheck the box to turn MathJax off. This feature requires Javascript. Click on a formula to zoom.
Abstract
Sustainable roadway construction can be defined as the optimal use of resources during the roadway life-cycle reducing the economic and social impacts. Two means of improving the sustainability of roadways are the appropriate selection of pavement types to minimize the life cycle cost of pavement and to reduce the social impacts. Thus, this work is aimed at analyzing the economic and social impacts of the Jointed Concrete Pavement in comparison to the Hot Mix Asphalt pavement from the perspective of life cycle cost analysis. To achieve the aim of the research the following tasks had been performed; Comprehend the backgrounds of life cycle assessment and life cycle cost analysis via literature review and data collection; Verify types of pavement; Analyze and Quantify structural components of pavement; Estimate agency and social costs; Perform life cycle cost analysis for each type of pavement, and finally Interpret the outputs. Results show that the life-cycle costs of the Jointed Concrete Pavement have about 90% cost advantage over the Hot Mix Asphalt pavement. This is the result of the unique properties of cement concrete which give its durability and hence lower maintenance, social cost, and longer design life. Finally, this research is expected to bring a paradigm shift and to strengthen the life cycle costs that are being considered in the overall cost of the pavement structure rather than just looking at the initial investment cost during the economic feasibility study of road projects under Ethiopian Roads Authority custody.
PUBLIC INTEREST STATEMENT
The socio-economic impacts of the road industry in Ethiopia have challenged the prospect of sustainable construction and flexible road pavements are widely used despite some doubts regarding their socio-economic impacts under different conditions. Thus, the goal of this study is to improve the sustainability of roadways are the appropriate selection of pavement types to minimize the life-cycle cost of pavement and to reduce the social impacts. This study work shows that the initial construction cost of the study Jointed Concrete Pavement (JCP) was highly expensive than the Hot Mix Asphalt (HMA) pavement. However, based on the life-cycle cost analysis approach, it was extremely cheaper than the HMA pavement alternatives. Therefore, the study of JCP is a better sustainable choice between the alternatives as it requires a lower life-cycle cost and has a relatively less unfavorable impact on society when compared to the HMA pavement.
1. Introduction
Road construction projects in Ethiopia are often undertaken by the government and reducing the government costs by improving the life cycle economy from pavement type is important to advance economic development. The economic impacts of the road industry in Ethiopia have challenged the prospect of eco-construction and flexible road pavements are widely used despite some doubts regarding their economics under different conditions. For instance, for the last two decades in Ethiopia, with the increases in populations and the demands of public customers, highways have been actively and continually constructed or rehabilitated, or maintained. As a result, the country’s road network has increased from 26,550 km in 1997 to 145,763 km in 2020 (an increase an average of 8% per yr.), and the total budget for the planned works during these 23 years of the Road Sector Development Program (RSDP) amounted to ETB 356.6 billion(ERA, Citation2019). Since an enhanced transportation infrastructure system would sustain social and economic development. Therefore, using long-life and low-maintenance types of pavement is recommended by the Ethiopian Roads Authority (ERA) (ERA, Citation2019). Moreover, currently, asphalt pavements are becoming more expensive while their quality is declining from time to time. The expensiveness of the asphalt pavements is mainly due to their main component, bitumen.
Ethiopia is not an oil-producing country and thus bitumen is imported from foreign countries with hard currency, and the price is increasing from time to time. Consequently, for the past 15 years (from 2006–2020) Ethiopia was spent USD 51,443,436.41 on bitumen mixture asphalt only for flexible pavement construction (available at the website https://customs.erca.gov.et/trade/customs-division). Due to this fact, the search for alternative pavement construction materials is a key and fundamental factor for the sustainable growth of the road networks in the future of Ethiopia. This is due to various elements such as the availability of materials, cost-effectiveness, environmental & social suitability, and the like.
However, in the Ethiopian context, hot laid asphalt bitumen is used as a binding agent almost in the entirety of road projects. This is due to the consideration of only flexible pavements in the Engineering design stage even though Ethiopia Roads Authority has incorporated the Rigid Pavements Design Manual since 2002(ERA, Citation2013b). This prejudice towards asphalt pavement and the ruling out of rigid pavement from the picture might have emanated from the lack of awareness of designers, absence of skilled manpower, its relatively higher initial cost, shortage of cement, or a combination of them and others.
Therefore, the research will address the wrong assumption that rigid concrete road pavement is always the more expensive pavement option without even investigating life cycle cost together with user benefits, environmental benefits, social benefits, cement manufacturing industries mutual benefits, and so on.
2. Integrated life cycle assessment, cost model, and life cycle cost analysis
A life cycle includes a product’s raw-material extraction, processing and manufacturing, transportation and distribution, operation and use, and disposal (Mao, Citation2012; Park, Citation2014). Hence, the typical life cycle of pavement begins with material extraction and production through construction and facility operation, maintenance and rehabilitation, and the end of life with either disposal or recycling (Chan, Citation2007; Choi et al., Citation2016; Masanet & Horvath, Citation2010; Weiland & Muench, Citation2010). The life cycle model used to evaluate pavement sustainability indicators consists of two integrated elements: i) a life cycle inventory analysis/impact assessment model within the initial stages of the pavement lifecycles (extraction of raw materials, manufacturing, and placement) where energy is released; and ii) a life cycle cost (LCC) model of agency and social costs (Chan, Citation2007; Kendall et al., Citation2011). Agency costs consisted of the cost of construction, maintenance and rehabilitation, and social costs including the costs related to road user (vehicle operating & user delay costs) and neutralization of greenhouse gas emissions. These indicators are evaluated for the total 40-year service life of the alternative pavements.
Life cycle cost is by the International Standardization Organization (ISO) defined as “[the] cost of an asset or its parts throughout its life cycle, while fulfilling the performance requirements” in the standard for service-life planning of building and constructed assets (ISO 2008)and (Wennström, Citation2014). About (Chan, Citation2007), life-cycle cost also can be defined as a means of “the total cost of the initial project plus all anticipated costs for subsequent maintenance, repair, or resurfacing over the life of the pavement” (Michigan legislation PA 79 of 1997). Life-Cycle Cost Analysis (LCCA) was legislatively defined in Section 303, Quality Improvement of the National Highway System NHS Designation Act of 1995. The definition as modified by Transportation Equity Act for the twenty-first century is “ … a process for evaluating the total economic worth of a usable project segment by analyzing initial costs and discounted future cost, such as maintenance, user, reconstruction, rehabilitation, restoring, and resurfacing costs, over the life of the project segment.” (FHWA Pavement Division, Citation1998). Life-cycle cost analysis is an engineering economic analysis method for assessing the total cost of constructing, maintaining, and operating an asset or facility, or a system of assets/facilities, over an extended period (typically, 20 years or more). Life-cycle cost analysis is a valuable investment analysis tool for assisting transportation managers in evaluating various design strategy alternatives, based on the costs incurred by both the investment/agency/and users of the facility (i.e., direct and indirect costs, respectively).
In the roadway transportation sector, a life-cycle cost analysis can be used to quantify the differential costs of investment strategy alternatives for new construction, reconstruction, rehabilitation, and even preservation projects as a way of assisting in the selection of the alternative with the lowest total cost, not just the lowest initial cost. In general, the life-cycle cost analysis process includes the formulation of design strategy alternatives, the identification of the timing of activities for each alternative (e.g., year of application for rehabilitation and preservation treatments), the estimation of initial and user costs for each alternative, and the conduct of an economic analysis that leads to the determination of the alternative with the lowest life-cycle cost. However, a life-cycle cost analysis should only be used in comparing project alternatives that provide equal benefits for the highway user(Walls & Smith, Citation1998).
In summary, in reference (U.S. Department of Transportation Federal Highway Administration’s (FHWA’s) Office of Asset Management, Citation2002), life-cycle cost analysis is a cost-centric approach used to select the most cost-effective alternative that accomplishes a preselected project at a specific level of benefits that is assumed to be equal among project alternatives being considered.
3. Material composition, mix-design, computation of pavement costs, computation of remaining service life value of pavements and methods
3.1. Material composition
To perform an unbiased analysis, an equivalent cross-section design of typical Jointed Concrete Pavement (JCP) and Hot Mix Asphalt pavement was considered. In this study, the design of each pavement type was carefully carried out to reflect the typical cross-sections of the two selected alternatives. The highway would be 1 km long, and 7 m wide (two lanes in free flow without a median, and each lane is 3.5 m wide with high volumes of traffic asphalt and cement concrete pavement sections were used that have roughly the same functionality, the designs for each alternative are based on the Ethiopian Roads Authority pavement design manual plus AASHTO Guide for Design of Pavement Structures 1993(ERA, Citation2013a, Citation2013b; The Arkansas Highway and Transportation Department & The Federal Highway Administration, Citation2004) and it was assumed that a major trunk road was planned to be built in Ethiopia. Hence, in the design lane, 100% of the loading would occur and the pavement would be constructed on a natural gravel material sub-base. Using the proposed truck factors tabulated in a supplementary paper, the cumulative traffic loading (cumulative equivalent standard axle loading) for 20 years design life for a flexible pavement structure and 40 years design life for rigid pavement(ERA, Citation2013a, Citation2013b) options are 30 million and 80 million, respectively. For structure layers and thickness determination: The asphalt pavement is designed in compliance with the Ethiopian Roads Authority Flexible pavement design manual.
The Ethiopian Roads Authority manual is based on an empirical pavement strength/thickness approach using the AASHTO concept of Structural Number. For the design of the asphalt pavement section, the Ethiopian Roads Authority Flexible pavement design manuals catalog was used. Similarly, the design of the rigid pavement section, the Ethiopian Roads Authority Rigid pavement design manuals graph was used. Moreover, the AASHTO (The Arkansas Highway and Transportation Department & The Federal Highway Administration, Citation2004) equation for rigid pavements [] was applied to determine the slab thicknesses [D]. The thickness determined by AASHTO (368.3 mm) is similar to the slab thickness obtained by Ethiopian Roads Authority Rigid Pavement Design Manual 2013(365 mm) for JCP. However, the AASHTO method requires several assumptions and choices of several input parameters that cannot be easily be determined. For a higher level of traffic similar to the research project, the design method by Ethiopian Roads Authority is more reliable than AASHTO Design Guide because the Ethiopian Roads Authority Rigid Pavement Design Manual is based on empirical data from a full-scale experiment carried out by Transport Research Laboratory (TRL) in the UK.
Therefore, based on the Ethiopian Roads Authority pavement design manual plus AASHTO guidelines(ERA, Citation2013b, Citation2013a; The Arkansas Highway and Transportation Department & The Federal Highway Administration, Citation2004) in respect of their cumulative equivalent standard axle load stated above, the recommended flexible and rigid pavements structurefor the new design pavements are listed in , respectively and the detailed design works were annexed in the separate paper.
Table 1. Recommended flexible pavement structure for the new design pavement
Table 2. Recommended rigid pavement structure for the new design pavement
3.2. Mix-design for pavement layers
Concrete Mix-design for JCP slab: Conditions and Specifications (as per EBCS (Ethiopian Building Code of Standards) and ACI)(Ministry of Works and Urban Development, Citation1995): Concrete is required for a pavement that will be exposed to moderate environmental conditions. A specified compressive strength, of 35 Mpa is required at 28 days. Air entrainment is required. The slump should be between 25 mm and 75 mm. A nominal maximum size aggregate of 19 mm or 25 mm is required. No statistical data on previous mixes are available. The materials available are as follows:
Cement: OPC with a relative density of 3.0. Coarse aggregate: Well-graded, 19 mm or 25-mm nominal maximum-sizecrushed gravel (ASTM C 33, Citation1999) with an oven-dry relative density of 2.68, absorption of 0.5% (moisture content at SSD condition), and oven-dry rodded bulk density (unit weight) of 1600 kg/m3. The laboratory sample for trial batching has a moisture content of nearest to 2%. Fine aggregate: River sand (ASTM C 33, Citation1999) with an oven-dry relative density of 2.64 and absorption of 0.7%. The laboratory sample for trial batching (i.e. for fine aggregate) has moisture content nearest to 6%. The fineness modulus is 2.80. Air-entraining admixture: Wood-resin type (ASTM C 260, Citation2006). Water reducer: (ASTM C 494, Citation2013). This particular admixture is recognized to reduce water demand by 10% when used at a dosage rate of 3 g (or 3 mL) per kg of cement. Undertake that the chemical admixtures have a density near to that of water. From this fact, the task is to proportion a trial mixture that will meet the above conditions and specifications. Strength: The design strength of 35 MPa is greater than the 31 MPa required in ACI 318 (ACI Committee, Citation2011) for the exposure condition. Since no statistical data on previous mixes are available, f’cr (required compressive strength for proportioning) from ACI 318 is equal to f’c+ 8.5. Therefore, f’cr = 35 + 8.5 = 43.5 MPa. The mix design results are summarized as shown in and the detailed mix-design work was annexed in a separate paper. Design of the Compacted HMA Paving Mixture: Ideally, the design of an HMA mix involves the following iterative process; (i) Establish candidate mixes with satisfactory volumetric composition; (ii) Testing to check that the compacted mix has the required properties for the anticipated traffic; and, if necessary, (iii) Adjust the mix composition and retest until the design requirements are satisfied(Roberts et al., Citation1996). Mix design for AC surfacing materials is commonly based on the recommendations given in the Asphalt Institute Manual Series, MS-2, and is conducted using the Marshall Test procedure(Roberts et al., Citation1996). Mix Design Specifications: continuously graded wearing courses. No statistical data on previous mixes are available. The materials available are as follows: Asphalt Cement: Hot Mix Asphalt 60/70 grade bitumen with a relative density of 1.03. Coarse aggregate: continuously graded, 25–28 mm nominal maximum-size crushed gravel (ASTM C 33, Citation1999) with an apparent specific gravity of 2.69 and an oven-dry bulk density of 2.61, absorption of less than 2% (moisture content at SSD condition) and oven-dry rodded bulk density (unit weight) of 1600 kg/m3. The laboratory sample for trial batching has a moisture content of nearest to 2%. Fine aggregate (Filer): Crushed (ASTM C 33, Citation1999) with an oven-dry relative density of 2.71 and absorption of 0.7%. The laboratory sample for trial batching has a moisture content is 5%. The bulk specific gravity of compacted paving mixture sample: Gmb = 2.340 (ASTM D 2726, Citation1996). & Gmm = 2.445 (ASTM D2041, Citation2002), Pmm = 100%, then the bulk density of the compacted mixture = 2.340 × 1000 kg/m3 = 2340 kg/m3. The mix design results are summarized as shown in and the detailed mix-design work was annexed in the separate paper. Moreover, the corresponding weight (ton) per km of the pavement materials results is also summarized as shown in .
Table 3. Result of the materials outputs in mix-design for cement concrete slab pavement
Table 4. Result of the materials outputs in mix-design for asphalt concrete pavement
Table 5. The corresponding weight (ton) per km of the pavement materials
3.3. Computation of pavement initial costs
Quantity takeoff, unit rate, and engineering estimation were computed for each pavement material as per the desig specifications in the bill of quantity. All the costs (material, labor & equipment) were fixed from the current market price index at Addis Ababa, Ethiopia from January 2020 to June 2020.
Hence, the following Bill of Quantities for the pavement alternatives are shown in
Table 6. Bill of quantity of cement concrete pavement
Table 7. Bill of quantity of asphalt concrete pavement
3.4. Computation of pavement maintenance and rehabilitation costs
As per Ethiopian Roads Authority, Road Asset Management Directorate (from previous statistical data) consideration of the rate of maintenance cost per year is about 0.8% of estimated initial construction costs for flexible pavement and, the substantial maintenance is expected after the opening of each first-year and rehabilitation (this includes replacement of only AC wearing course including tack coat and reconstruction: only the subgrade of the existing pavement will remain) is also expected after the end of the seventh year, and it also considers at the end of the twentieth year. Then, the cost of rehabilitation and reconstruction for flexible pavement is equal to the initial cost of only AC wearing course including tack coat, and AC surfacing plus road base of the estimated initial construction costs of the project, respectively. Hence, for this proposal, the rates of rehabilitation and reconstruction have become 31.3% and 97.4% of the estimated initial construction costs for flexible pavement, respectively. However, as the cement concrete pavement technology is new for the country, the researcher took assumed the worst value of its maintenance cost of 0.8% (durable and has a longer design life implies r ≤ 0.8% per yr. w.r.t flexible pavement) of its initial cost even if literature says only joint maintenance is required in cement concrete pavements and rehabilitation does not occur within design period (i.e. 40 years). But due to various reasons, it is very difficult to forecast the exact inflation rate. Hence, for this proposal, about at https://www.statista.com/statistics/455089/inflation-rate-in-Ethiopia/#statisticContaineran average estimate has been taken for the analysis period of 7.98% per year (., and as per the World Bank Report No: ICR00004796 23 September 2019), the Ethiopian Transport Sector Project the opportunity cost of capital (or discount rate) has been taken as 10.23% (World Bank, Citation2019). Thus, the corresponding pavements Maintenance and Rehabilitation Costs are determined from the following equations:
To sum up, the maintenance costs of JCP for the entire design life performance is determined from EquationEq. (2(2)
(2) )
We can use this handy (summing of geometric series) formula:
However, to sum the maintenance costs of HMA pavement:
a) The sum of the first 20 years (n = 20, k = 0) maintenance costs for the entire design life performance is determined from EquationEq. (4(4)
(4) )
and
b) The sum of the next 20 years (n = 40, k = 20) maintenance costs for the entire design life performance is determined from EquationEq. (6(6)
(6) )
To sum up, the Rehabilitation Cost of the HMA pavement for the entire design life performance is determined from EquationEq. (7)(7)
(7) :
Cost at the end of the (7th yr. + 15th yr. + 27th yr. + 35th yr.)
But, the reconstruction cost of the HMA pavement for the entire design life performance is determined from EquationEq. (8)(8)
(8) :
Cost at the end of the 20th year = s *
Where: M1 = IC× 0.8%
= the first-year maintenance cost in net present value
IC = Initial construction cost of each pavement
i = the adjusted inflation interest rate per year
r = the opportunity cost of capital (or discount rate)
s = the % share of the reconstruction cost (i.e. 97.4% of Ic)
n = the analysis period in years
Then, by using the (above formulations) net present worth economic analysis, the estimated Maintenance, and Rehabilitation (including reconstruction) costs of each alternative with the entire design periods were computed. Thus, the total estimated Maintenance and Rehabilitation costs per km for a 40-year entire service of HMA pavement is ETB 16,799,994.97 and for that of JCP is ETB 3,086,486.32 and the detailed calculations were simply done in Excel template and annexed in a separate paper.
3.5. Computation of pavement social costs
Social impact assessment in pavement Life Cycle integrates the data on the project, the public issues and positions, the community, and the biophysical impacts to determine the potential socio-economic impacts(Stevenson, Citation1995). However, this study only addressed the social impacts related to emission costs and road user costs in the life cycle assessment.
Road User Costs of the Pavements: Best-practice life-cycle cost analysis calls for consideration of not only agency costs but also costs to facility users. User costs are an aggregation of three separate cost components: vehicle operating costs (VOC), user delay costs (i.e. travel time costs), and crash or accident costs incurred by the traveling public (FHWA Pavement Division, Citation1998; Walls & Smith, Citation1998). Vehicle operating costs depend primarily on the roughness of the road (as measured by the International Roughness Index—IRI) and, to a lesser degree on road geometry, in particular, the average gradient of the road. Improvements in these parameters will yield vehicle operating cost savings. Time savings arise because of the smoother surface of an improved road, together with any improvements in vertical or horizontal alignment, which would allow vehicles to travel faster.
HDM-4 Modeling inputs and assumptions to estimate RU costs only: To estimate Road User costs per km per yr. each alternative can be modeled in HDM-4 as follows: First, two maintenance types are considered in the analysis: i) Routine Maintenance: Includes grading, patching, crack sealing, slab replacement, and partial depth repair for the main alignment only; ii) Periodic Maintenance: Includes re-graveling, reseal, overlay, and joint sealing.
For HMA Flexible Pavement, the following conditions are considered: Newly Pavement constructing option consisting of 90 mm surface thicknesses and 190 mm Dense Bitumen Macadam with initial IRI of 3.5. Proper maintenance afterward for the newly constructed road consisting of a) pothole patching when several potholes are greater than 6/km b) surface reseal when total carriageway cracked ≥25% c) overlay when roughness ≥7 IRI (m/km) and d) total carriageway rehabilitation to done after every seven years. service go with the rate of rehabilitation is equal to 31.3% of ethe estimatedinitial construction costs of the proposed project.
For Jointed Concrete Rigid Pavement, the following conditions are considered: Newly Pavement constructing option consisting of 365 mm surface thickness (concrete slab) with initial IRI of 2.5. Preventive maintenance afterward for the newly constructed road consisting of a) partial depth repair when spalling ≥5% b) slab replacement when total carriageway cracked ≥20% and c) Joint sealing every 10 years. The estimates for maintenance works have been estimated based on unit rates from the Ethiopian Roads Authority database and for rehabilitation; the rate of rehabilitation for flexible pavement is equal to 31.3% of the estimated initial construction costs of the proposed project. Similarly, the estimated input operating costs (Economic unit prices in ETB referenced in Table 20 of the supplementary document) for different kinds of vehicles are considered for HDM-4 Analysis. Similarly, to compute road user costs of the alternatives, first, we have to assess the economic data that uses as the inputs for transport economics prediction throughout the design period of the pavements. Hence, this study investigates the issues related to the transport economy such as Discount Rate (about 10.23%), Vehicle Fleet Characteristics, Traffic Growth, Trends in GDP and Transport Demand Elasticity w.r.t GDP have already computed at the traffic growth analysis and annexed in a separate paper within supplementary documents.
HDM-4 Analysis: The HDM-4 model includes modules to calculate vehicle operating costs (VOCs) and Travel time Costs and was considered to be an appropriate tool for this analysis. Typically, HDM-4 is not used in the UK as the road network is, by international standards, relatively smooth and vehicle operating costs are not sensitive to roughness until the pavement has an IRI of around 4 or 5. Based on this threshold, it is only the worst parts, in terms of longitudinal profile variance, of the Ethiopian trunk road network that will have any impact on vehicle operating costs. Two sets of Trunk 1 km road lengths were modeled in HDM-4, using IRI values ranging from 2 to 5.5 in increments of IRI 0.5. The entire modeled road lengths were of HMA and PC concrete construction had a width of 7 m, a rise, and fall of 10 m/km and a curvature of 15 degrees/km were considered. Hence, with the application HDM-4 modeling, the total Road User (only 10% of vehicle operating and travel time) cost per vehicle/km for 40 years of entire service for HMA pavement is ETB 3,611,393.17 and for that of JCP is ETB 2,669,772.72. However, the accident costs are not considered in life-cycle cost analysis because the valid data were not available in the country. And also only considered 10% of HDM-4 analysis results because the study design is a simulation design and the configuration of HDM_4 has some constraints regards to road networks, vehicle fleets, and work standards. From the result of road user costs of each alternative, the study explained that the road user costs are directly related to the performance of the pavement. Hence, the frequent maintenance and rehabilitation activities on roads the publics exposed to high vehicle operating and user delay costs.
Greenhouse Gases Emission and Emission Costs of the Pavements: In this research, life cycle inventory data of extraction and initial transformation of raw material, manufacturing, and placement were mainly collected from published reports from previous research and web databases (Håkan Hao & Rashmi, Citation2014; Stripple, Citation2001). Although multiple data sources are available for life cycle inventory data of typical pavement materials, discrepancies may exist due to different local conditions, technologies, and system boundaries. Greenhouse Gases (hazardous wastes) are potentially harmful not only to the health of human beings but also to the environment. Global Warming Potential (GWP) measures how much heat greenhouse gases trap in the atmosphere. The Global Warming Potential (GWP) and Greenhouse Gases assess the number of greenhouse gases released into the air (Keith et al., Citation2005).
The study attempted to estimate the amount of Greenhouse Gases emissions to air, for the construction of JCP and HMA pavement roadways from the extraction of raw materials through the end of construction as shown in respectively and available at https://www.ecoinvent.org/, and in reference (Hao & Rashmi, Citation2014). Research findings show that the majority of emissions occur during the material’s phase, constituting about 65% of the total on urban interstates, 79% on rural interstates, and up to 97% on rural local roads, this implies that the initial stages of the pavement lifecycles (from (extraction of raw materials, manufacturing, and placement) dominate the time series of GHG emissions to air (Santero & Ochsendorf, Citation2011). Hence, it should be noted that this paper presents the results for the only extraction of raw materials through the end of construction and does not address the entire roadway lifecycle (Håkan Hao & Rashmi, Citation2014; Stripple, Citation2001). This was followed by the: selection of the type and characteristics of the roadways to be investigated, identification of energy emission data sources, collection of data from the identified sources, and finally analysis of the data. The amount of each Greenhouse Gases Emission to air, for the construction of HMA pavement roadways in the first three sub-phases of the lifecycle of the pavement (extraction, manufacturing, and placement) were computed in an account of the three stages (construction, maintenance, and rehabilitation) and it also to be forecasted for 40 years’ service 50% from each rehabilitation (per 7 yr) and 15% (i.e. % of wearing surface materials shares) from total maintenance work were considered.
Table 8. Energy (GHG) emission from JCP materials/processes to air in kg per ton of Portland cement concrete production in life cycle phase
Table 9. Energy (GHG) emission from HMA materials/processes to air in kg per ton of HMA concrete production in life cycle phase
However, for that of JCP, only joint maintenance is required and rehabilitation does not occur within the design period (i.e. 40 years), then the total amounts of GHG emission to be forecasted for 40-year service only 50% from maintenance work were considered. For energy emission results from each life cycle phase, the pavements to the total energy emission to air by each greenhouse gas was also calculated shown in . Though for energy emission considered only the major greenhouse gases are released into the air such as CO2, SO2, NOX, CO, CH4, N2O, and VOC. The result shows that the study HMA and JCP pavements emit 2.34 × 10⁵ kg and 2.25 × 10⁵ kg total greenhouse gases respectively, in the first three sub-phases of the lifecycle of the pavement (extraction, manufacturing, and placement). Moreover, the emission costs were calculated considering the cost of neutralizing CO2, CO, NOX, N2O, SO2, VOC, and CH4, and the costs based on the data reported by (Hao & Rashmi, Citation2014; Islam & Buttlar, Citation2013; Kendall et al., Citation2008; Sproul et al., Citation2019), and the International Association for Energy Economics Estimation (IAEE) shown in which are equivalent to the values in Global Energy Reporting Initiative Database (available at https://www.iaee.org/). Thus, the total estimated emission cost of GHG from HMA pavement in the entire life cycle is ETB 7,926,312.43 and for that of JCP is ETB 377,920.02 and the detailed calculations were simply done in Excel template within the supplementary document.
Table 10. Total energy emission to air (kg) and percent contribution of GHG from lifecycle phases of JCP materials/processes
Table 11. Total energy emission to air (kg) and percent contribution of GHG from lifecycle phases of HMA materials/processes
Table 12. Urban emission cost in dollars per ton by (Hao & Rashmi, Citation2014; Islam & Buttlar, Citation2013; Kendall et al., Citation2008) and IAEE
Thus, the corresponding sum of GHG emission to air (kg) by each pavement material in the first three sub-phases of the lifecycle of the pavement (extraction, manufacturing, and placement) are determined from the following equations and the results shown in .
Total Sum of Energy Emission to Air (kg) from JCP material/process (i.e. Ep + 50% × Ep = 1.5Ep)
taken from
Total Sum of Energy Emission to Air (kg) from HMA material/process (i.e. 2Ep + 4 × 50% × Ep + 15% × Ep = 4.15Ep)
= taken from
Where: Emission cost in each gas (ETB) = Energy Emission to Air (ton) x Urban Emission Cost in Birr per ton.
3.6. Computation of remaining service life value of pavements
If an activity has a service life that exceeds the analysis period, the difference is known as the Remaining Service Life Value (RSV). Any rehabilitation activities (including the initial construction) except for the last rehabilitation activity within the analysis period will not have an RSV. The road pavement itself can be expected to have expired after 20 years but other components of the upgrading, such as structures and earthworks will have remaining reusable life for incorporation within subsequent reconstruction or rehabilitation projects. Even though the contribution of these re-usable components to the total costs and their anticipated service lives, but this study project only considers road pavement investment cost, hence the overall residual value of the flexible pavement option is considered to sub-base (2.6% investment cost-share and 30% of economic life remaining). Consequently, its residual life has been taken as 0.77% (i.e. 2.6% x 30%). On the other hand, the rigid pavement option is expected to serve double the design life of the flexible pavement option (i.e. 40 years) and the overall residual value of the rigid pavement option is considered to a concrete slab (97.1% investment cost-share and 20% of economic life remaining), and also sub-base (2.9% investment cost-share and 30% of economic life remaining); therefore, its residual life has been taken as 20.29% (i.e. 97.1%*20% + 2.9%*30%). The Remaining Service Life Value of this project alternative at the end of the analysis period is calculated PV (i%, n, F) by using an estimated initial construction cost of each pavement. Therefore, the total Remaining Service Life Value per km for 40-year entire service of flexible pavement is ETB 85,131.61 and for that of rigid pavement is ETB 1,374,343.14 and the detailed calculations were simply done in Excel template and annexed in the separate paper within the supplementary document.
3.7. Research methods
A study design or frame is the process that guides the researcher on how to collect, analyzes, and interprets observations. Having this in mind this section shows the procedures and methodology that the researcher follows to compare the economic impact of JCP and HMA pavement by investigating their life cycle costs. Hence, to achieve the aim, the following tasks had been performed:
Task-1: Comprehend the backgrounds of life-cycle cost analysis via literature review and data collection.
Task-2: Verify types of pavement for highway construction based on Ethiopian Roads Authority Pavement Design Manual 2013 and AASHTO, Guide for Design of Pavement Structures 1993.
Task-3: Analyze structural components depending on the types of pavement.
Task-4: Quantify each pavement alternative based on the 1 km with 7 m wide lane design of JCP and HMA pavement respectively.
Task-5: Estimate the initial construction, maintenance, rehabilitation including reconstruction, road user, and emission costs of each type of pavements by using mathematical formulations, Excel templates, HDM-4 model, previous research findings, and different code standards and charts.
Task −6: Perform life-cycle cost analysis according to each type of pavement.
Task-7: Interpret the outputs analyzing economic and social impacts.
4. Results and discussion
4.1. Initial construction costs
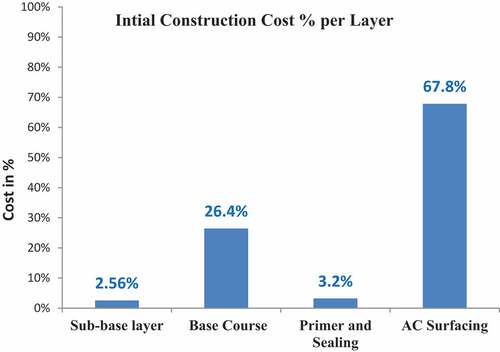
The estimated initial construction costs of each alternative, the study JCP and HMA pavements were incurred ETB 15,453,554.91 and ETB10, 087,681.90 per km, respectively. Thus, it could result in an economic cost that varies according to the pavement type. In addition to pavement type, shows that the highest construction cost is generated from the specific costs of PC Concrete and Hot Laid Asphaltic Concrete Surfacing construction materials that are used for rigid and flexible pavement, respectively. Therefore, the outputs in show that important interaction exists between costs of pavement materials and the total construction costs of pavement on the different types of pavement.
Figure 1. The percentage cost share per item of JCP
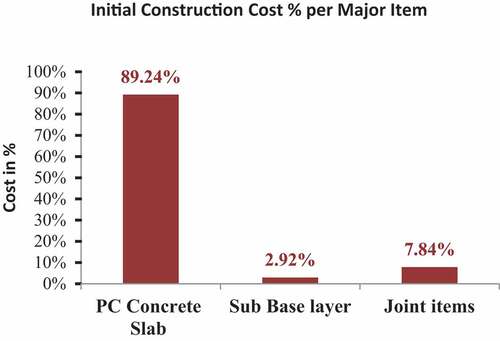
Figure 2. The percentage share per item of HMA pavement
4.2. Maintenance and rehabilitation (including reconstruction) costs
The total estimated Maintenance and Rehabilitation costs per km of each alternative with the entire 40 yrs. service was computed and the study HMA and JCP pavements were incurred ETB 16,799,994.97 and ETB 3,086,486.32 per km respectively. Results show that the M&R Costs for the entire 40 yrs. service of the study HMA pavement was highly expensive than the JCP and it has a cost increment of just over 444%. Hence, the HMA pavement accounted for 166.54% of the initial investment cost for Maintenance and Rehabilitation work but the JCP pavement accounted for only 19.97% of the initial investment cost. In sum, we realized that HMA pavement had a higher economic impact on its performance and huge capital and resources are used when designing the HMA concrete for long service life in the normal trend in Ethiopia.
4.3. Social (road user and energy emission) costs
The outputs show that the Road User costs (vehicle operating and user delay costs) of the study HMA and JCP pavements were incurred ETB 3,611,393.17 and ETB 2,669,772.72 per km respectively only considered 10% of HDM-4 analysis results. From the result of road user costs of each alternative, the study explained that the road user costs are directly related to the performance of the pavement. Hence, the frequent maintenance and rehabilitation activities on roads the publics exposed to high vehicle operating and user delay costs. Energy Emission and its Costs results show that the study HMA and JCP pavements emit 2.34 × 10⁵ kg and 2.25 × 10⁵ kg total greenhouse gases respectively, in the first three sub-phases of the lifecycle of the pavement (extraction, manufacturing, and placement). This inferred that the amount of energy emission for the entire 40 yrs. service of the study HMA pavement was somehow higher than the JCP. JCP type of pavement the emission of SO2, NOX, CO, H4, N2O, and VOC greenhouse gases for the life cycle pavement materials is almost negligible compared with the emission of CO2 from the life cycle of pavement up to the construction stage. shows that the emission of SO2, NOX, CO, H4, N2O, and VOC account for only 0.4% of the total amount of greenhouse gas emission in JCP pavement. The remaining 99.6% of the greenhouse gas emission is CO2. But for HMA pavement account only 29.8% greenhouse gases emission as shown .
Therefore, the outputs show that JCP has a greater amount of global warming potential than HMA and cement is the driving element in the emission of the highest greenhouse gases in the construction of Portland cement concrete pavements. However, the total estimated neutralizing costs of CO2, CO, NOx, N2O, SO2, VOC, and CH4 GHG from HMA pavement in the entire life cycle is ETB 7,926,312.43 and for that of JCP is ETB 377,920.02. This shows that HMA pavement had the higher emission costs in the life cycle of pavement than JCP because of the highest amount emission of NOX and VOC, which accounted for 93.9% of the total emission cost, in the life cycle and their corresponding cost of neutralizing (emission costs) are highly expensive.
Hence, the HMA pavement surface materials are highly toxic and have great social impacts than the JCP slab. From the analysis, we can also observe that the Social (RUC and Emission cost) cost of HMA pavement is significantly higher than that of PC concrete pavement. It has a cost increment of just over 278%. This shows HMA pavement had a higher social impact than JCP in the life cycle costs of pavement. Thus, in regard to social impact life cycle assessment, the study JCP was socially more acceptable than HMA pavement in the entire life cycle.
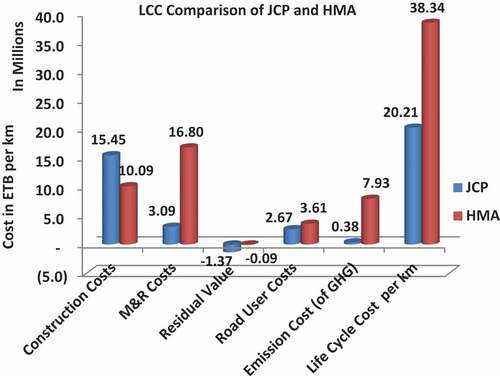
4.4. Pavement life cycle cost results
The summary of life cycle cost results shown in .
Table 13. Pavement life cycle cost results
From the Life Cycle Cost Analysis of the alternatives, the study JCP and HMA pavements were incurred ETB 20,213,390.84 and ETB 38,340,250.85 per km respectively. This concluded that the Life Cycle Cost of the study HMA pavement was more expensive than the JCP. From the analysis, we can also observe that the initial cost of the study concrete rigid pavement is substantially higher than that of flexible pavement. It has a cost increment of just over 53.19%. However, in the long run, or Life Cycle Cost, the study cement concrete rigid pavement has the upper hand over the flexible pavement with a cost saving of above 90%. Maintenance, rehabilitation including reconstruction, and social costs for JCP had a small impact on the total life cycle costs, representing only 30% of the total. On the contrary, that of HMA pavement accounts for about 74% of the total cost. This is mainly due to the longer design life of concrete rigid pavement its lesser maintenance, rehabilitation, and social costs. We can therefore safely conclude that concrete rigid pavement in addition to its technical superiority over flexible pavement; is worthwhile economically as well.
Thus, the analysis results (shown in ) indicated that JCP is the better cost-efficient and sustainable choice between the selected pavement alternatives as it requires a lower life-cycle cost and has a less unfavorable impact on the socio-economic when compared to the HMA flexible pavement.
Figure 3. Results of life cycle cost for each pavement
4.5. The mutual and consequential benefits of developing the alternative pavements
The global trend suggested that cement plant are growing automated with modern larger cement plant manned from 200 to 300 employees, in Ethiopia, however, from the total twenty factories larger cement plants employee as high as 1935 employees and smaller plants employee around 100 employees (Adama Science and Technology University, Citation2014) and in the coming 10 years Ethiopia Roads Authority plan will construct 38,849 kms (by the federal government only) new AC roads (available at website https://www.ena.et/en/?p=16246). Furthermore, as result to construct 19,424.50 km (assumed 50% of 38,849 km) JCP main alignment in the coming 10 years demands about 20,626,876.55 tons (19,424.5 km x 2,590 m3/km x 0.41ton/m3) of Portland cement which will be produced in Ethiopia and the Country current actual cement production capacity is estimated to be 12.7 million ton/year out of having 350 million tons of cement raw material national reserves(Global Cement Magazine, Citation2020). Due to the more demanded 20,626,876.55 tons amount of Portland cement in the Cement Factories would create new employment to citizens. Besides, to generate billion birrs of tax revenue, the choice of the study JCP will have a foreign exchange saving effect of about 21 billion USD [801,796,741,200.00 = (1,474,200 kg/km wt. bitumen x 19,424.50 km in 10 yrs. x 28Birr/kg current price) birr] to the country in the coming 10 yrs. by substituting the imports of bitumen mixture cut-backs asphalt for flexible pavement construction.
Hence, the decision of the study JCP alternative derived due to having 6.6 million ton of current cement production capacity in the country, as a result, to construct 19,424.50 km (only by half substitution) JCP in the coming 10 years it demands about 20,626,876.55 tons of Portland cement which will be produced in Ethiopia and this drives the local cement factories to produce cement in their full capacity. So this explains that there is a mutual benefit between constructing PCC pavement and Cement Manufacturing Industries in Ethiopia.
5. Conclusion
This study handled the cost-efficiency to analyze the economic and social impact for jointed concrete rigid pavement and hot mix asphalt flexible pavement under the category of main trunk road in Ethiopia and was used that have roughly the same functionality. Moreover, the economic analysis result together with the qualitative comparison in the life cycle cost analysis had been considered to select the pavement alternative to be adopted for the study project. Given the above, the following conclusions may be drawn:
The result showed that the initial construction cost of the study jointed concrete rigid pavement (JCP) pavement was highly expensive than the hot mix asphalt flexible pavement (HMA) and it has a cost increment of just over 53%. However, from the life cycle cost analysis of the pavement alternatives, the study HMA pavement was more expensive than the JCP and the study jointed concrete pavement has the upper hand over HMA pavements with a cost saving of above 90%.
The study also found that social costs (road user and emission costs) play an important role in pavement life cycle costing and it is necessary to take it into account to conclusively choose the best alternative, then the study concrete rigid pavement was consumed lower social cost than HMA flexible pavement for the entire 40 years life cycle. Therefore, from (1) and (2) the study JCP is the better sustainable choice between the alternatives as it requires a lower life-cycle cost and has a relatively less unfavorable impact on society when compared to the HMA flexible pavement and the use of cement concrete as a road construction material is important.
In addition to driving local cement factories to produce cement in their full capacity to maximize their profit, the choice of the study JCP will have billion of foreign exchange saving effects to the country by substituting the imports of bitumen mixture asphalt for flexible pavement construction. So this explains that there are mutual and consequential benefits between developing JCP and the Cement Manufacturing Industries in Ethiopia.
Declaration of Competing Interest
The author declares that he has no known competing for financial interests or personal relationships that could have appeared to influence the work reported in this research paper and I have no conflicts of interest to disclose.
Acknowledgments
The writer would like to acknowledge the Ethiopian Roads Authority and Jimma University School of Graduate Studies Jimma Institute of Technology Department of Civil Engineering for their technical support in conducting this research. The writer would also like to thank Dr. Esayas G/Yohannes (PhD), Bikila Meko (M.Sc.) and CORE Consulting Engineers PLC for their unwavering support. This paper is published in the interest of information exchange. The writer expressly disclaims any liability, of any kind, or for any reason, that might otherwise arise out of any use of this publication or data provided in the publication. The writer further disclaims any responsibility for typographical errors or accuracy of the information provided or contained within it.
Data availability
The data used to support the findings of this study are available from the corresponding author upon request.
Additional information
Funding
Notes on contributors

Tariku Dessu Habte
Tariku Dessu Habte is a lecturer and researcher in the Department of Construction Technology and Management at Wolkite University, Ethiopia. He has an M.Sc. degree in civil/construction engineering and management/engineering. His major research interest is Sustainable Pavement Construction and Technology. This current paper seeks among other things to provide momentous information on sustainable roadway construction, to decision-makers in the Ethiopian Road sector.
References
- ASTM D 2726. (1996). Standard Test Method for Bulk Specific Gravity and Density of Non-Absorptive. ASTM International, 04, 8–10. https://pdfcoffee.com/qdownload/astm-d2726pdf-pdf-free.html
- ASTM C 33. (1999). Standard Specification for Concrete Aggregates. West Conshohocken, PA: ASTM International. https://kupdf.net/download/astm-c33-pdf_58fa5459dc0d60334e959ef3_pdf
- ASTM D2041. (2002). Standard Test Method for Theoretical Maximum Specific Gravity and Density of Bituminous Paving Mixtures (pp. 1–4). West Conshohocken, PA: ASTM International. https://www.astm.org/Standards/D2041
- ASTM C 260. (2006). Standard Specification for Air-Entraining Admixtures for Concrete. ASTM International. https://www.scribd.com/document/340310995/specs-for-air-entraininf-admixtires-for-concrete-C260-pdf
- ASTM C 494. (2013). Standard Specification for Chemical Admixtures for Concrete. ASTM International, 04, 1–9. https://civileng.co/astm-c-494-c-494m-04-pdf-free-download/
- ACI Committee. (2011). Building Code Requirements for Structural Concrete (ACI 318-11). American Concrete Institute. https://www.pecivilexam.com/Study_Documents/Struc-Materials-Online/ACI_318-Building-Code-2011.pdf
- Chan, A. W. (2007). Economic and environmental evaluations of life-cycle cost analysis practices : A case study of Michigan DOT pavement projects. Center for Sustainable Systems, Report No. CSS07-05, University of Michigan, Ann Arbor, Michigan. https://deepblue.lib.umich.edu/bitstream/handle/2027.42/50469
- Choi, K., Lee, H. W., Mao, Z., Lavy, S., & Ryoo, B. Y. (2016). Environmental, economic, and social implications of highway concrete rehabilitation alternatives. Journal of Construction Engineering and Management, 142(2), 04015079. 10.1061/(ASCE)CO.1943-7862.0001063
- ERA. (2013a). The federal democratic Republic of Ethiopia Ethiopian roads authority pavement design manual vloume I: Flexible pavements. Pavement DesignManual (Vol. I, 281). Ethiopian Roads Authority. https://www.scribd.com/document/441476107
- ERA. (2013b). The federal democratic Republic of Ethiopia Ethiopian roads authority volume II: Rigid pavements pavement design manual: Vol. II. Ethiopian Roads Authority. https://research4cap.org/ral/ERA-Ethiopia-2013-Rigid+Pavement+Design+Manual-ERA-v130322.pdf
- ERA. (2019). The federal democratic Republic of Ethiopia ministry of transport Ethiopian roads authority road sector development program 21 years performance assessment 2019 (Issue May). Ethiopian Roads Authority. http://www.era.gov.et/documents/10157/26166/21+Years+Assessment+Report+final.pdf?version=1.0
- Global Cement Magazine. (2020). Reaching new height. Pro Global Media Ltd, UK. https://www.globalcement.com
- Hao, W., & Rashmi, G. (2014). Life cycle assessment of asphalt pavement maintenance (Issue January). CAIT/Rutgers University. https://cait.rutgers.edu/wp-content/uploads/2018/05/cait-utc-013-final.pdf
- Islam, S., & Buttlar, W. (2013). Assessment of emission costs due to maintenance and rehabilitation to reduce assessment of emission costs due to maintenance and rehabilitation to reduce pavement roughness. January. Transportation Research Board, National Research Council, January 13-17, 2013, Washington, D.C. https://www.researchgate.net/publication/272355072
- Keith, P., Shine, J. A. N. S., Fuglestvedt, K. H., & S., N. (2005). Comparing climate impacts of emissions of greenhouse gases (Vol. 2005, pp. 281–302). Climatic Change. https://doi.org/10.1007/s10584-005-1146-9
- Kendall, A., Keoleian, G. A., & Helfand, G. E. (2008, September). Integrated life-cycle assessment and life-cycle cost analysis model for concrete bridge deck applications. 214–222. Journal of Infrastructure Systems. https://doi.org/10.1061/_ASCE1076-0342_200814:3_214
- Kendall, A., Lepech, M. D., & Li, V. (2011). Life-cycle cost model for evaluating the sustainability of bridge decks life cycle cost model for evaluating the. June. Research Gate. doi: 10.1061/ASCE107603422008143214.
- Mao, Z. (2012). Life-cycle assessment of highway pavement alternatives in aspects of economic, environmental, and social performance (Issue August). Office of Graduate Studies of Texas A&M University. http://oaktrust.library.tamu.edu/bitstream/handle/1969.1/ETD-TAMU-2012-08-11507/MAO-THESIS.pdf?
- Masanet, E., & Horvath, A. (2010). Life cycle assessment of pavements : A critical review of existing literature and research. April. IVL Swedish Environmental Research Institute Ltd. https://digital.library.unt.edu/ark:/67531/metadc1014780/m2/1/high_res_d/985846.pdf
- Ministry of Works and Urban Development. (1995). Ethiopian building code standard. Ministry of Works and Urban Development. http://www.mudc.gov.et/c/document_library/get_file?p_l_id=134951&folderId=988124&name=DLFE-16702.pdf
- Park, H. (2014). Environmental, economic, and social impacts of concrete pavement material choices: A life-cycle assessment approach (Issue December). Office of Graduate and Professional Studies of Texas A & M University. http://oaktrust.library.tamu.edu/bitstream/handle/1969.1/154201/PARK-THESIS-2014.pdf
- Pavement Division, F. H. W. A. (1998). Life-cycle cost analysis in pavement design.In Distribution 107 (Issue September). U.S. Department of Transportation Federal Highway Administration. https://www.fhwa.dot.gov/infrastructure/asstmgmt/013017.pdf
- Roberts, F. L., Kandahal, P. S., Brown, R. E., Lee, D.-Y., & Kennedy, T. W. (1996). Hot-mix-asphalt-material-mixture-design-and-construction-Edn.Pdf. Brown Printing Company. https://www.scribd.com/doc/130995413/Hot-Mix-Asphalt-Material-Mixture-Design-and-Construction-Edn
- Santero, N., & Ochsendorf, J. (2011). Methods, impacts, and opportunities in the concrete pavement life cycle (Issue August). Concrete Sustainability Hub Massachusetts Institute of Technology. http://cshub.mit.edu/sites/default/files/documents
- Adama Science and Technology University. (2014). FDRE Ministry of Industry, Ethiopian cement industry development strategy 2015 - 2025. https://www.icapitalafrica.org/eacce-resourcecenter
- Sproul, E., Barlow, J., & Quinn, J. C. (2019). Time value of greenhouse gas emissions in life cycle assessment and techno-economic analysis. Environmental Science & Technology, 53(10), 6073–24. https://doi.org/10.1021/acs.est.9b00514
- Stevenson, M. (1995). Social impact assessment of major roads. Hardy Stevenson and Associates Ltd. https://citeseerx.ist.psu.edu/viewdoc/download?doi=10.1.1.551.799&rep=rep1&type=pdf
- Stripple, H. (2001). Life cycle assessment of road: A pilot study for inventory analysis. (Second Revised Edition, Vol. 2, Issue March). IVL Swedish Environmental Research Institute Ltd. https://www.ivl.se/download/18.34244ba71728fcb3f3f57f/1591704221839/B1210E.pdf
- The Arkansas Highway and Transportation Department, & The Federal Highway Administration. (2004). AASHTO, guide for design of pavement structures. AASHTO. https://habib00ugm.files.wordpress.com/2010/05/aashto1993.pdf
- U.S. Department of Transportation Federal Highway Administration’s (FHWA’s) Office of Asset Management. (2002). Life-cycle cost analysis primer. The Federal Highway Administration (FHWA). https://www.fhwa.dot.gov/asset/lcca/010621.pdf
- Walls, J., & Smith, M. R. (1998). Interim technical bulletin on Life Cycle Cost Analysis (LCCA) in pavement design, FHWA-SA- 98-061. Federal Highway Administration. v01-19–11, 1–9 http://54.237.237.210/docs/LifeCycleCosts.pdf
- Weiland, C., & Muench, S. T. (2010). Life-cycle assessment of reconstruction options for interstate highway pavement in Seattle (Vol. 2170, pp. 18–27). Journal of the Transportation Research Board. https://doi.org/10.3141/2170-03
- Wennström, J. (2014). Life cycle costing in road planning and management : A case study on collision-free roads. In KTH Royal Institute of Technology, Sweden (Issue 125).https://www.diva-portal.org/smash/get/diva2:756353/FULLTEXT01.pdf
- World Bank. (2019). Implementation completion and results report (Credit No. 5155-Et) on a credit in the amount of SDR 273.5 Million (Us$ 415 Million Equivalent) to the federal democratic Republic of Ethiopia for transport sector project in support of RSDP4 September 23, 20. The World Bank, Transport Global Practice Africa Region. http://documents1.worldbank.org/curated/en/191441569595458799/pdf/Ethiopia-Transport-Sector-Project.pdf