
 ?Mathematical formulae have been encoded as MathML and are displayed in this HTML version using MathJax in order to improve their display. Uncheck the box to turn MathJax off. This feature requires Javascript. Click on a formula to zoom.
Abstract
In this study, proximate analysis and characterization techniques were carried out on maize tassel fibers immobilized with Polyvinyl Alcohol (PVA) for its usability as a biosorbent for adsorption process. The surface chemistry of the biomaterial showed the presence of carboxylic groups and lactone groups, and this was confirmed by the Fourier Transform Infrared spectroscopy. The Boehm titration also showed the number of acidic sites as 0.9 mmol/g, in the material. The proximate analysis revealed the moisture content, ash content, apparent density, and particle size to be 4.51%, 2.13%, 0.41 g/mL, and 300 μm, respectively. The Brunauer–Emmett–Teller (BET) analysis revealed the surface area, pore-volume, and size to be 652.3 m2/g, 0.4056 cm3/g, and 2.144 nm, respectively. The tassel was added to the polyvinyl alcohol at a temperature of 80°C with the aid of a magnetic stirrer in the ratio of 2:1, after which it was cooled and extruded with the aid of a syringe to form beads. The column efficiency performance of the biosorbent was carried out by varying flow rates, bed heights, and initial metal ions concentrations on the breakthrough curve to get the breakthrough and exhaustion time needed by the biosorbent. The column kinetics was subjected to Clark and Thomas isotherms. The Thomas model predicted the breakthrough better than the Clark model for the phosphoric compounds with an R2 value of 97.5% for bed heights and flow rates and lower error function.
PUBLIC INTEREST STATEMENT
The release of industrial and municipal effluents to land and water bodies have polluted the surface and groundwater, thus, making the management of water resources more complex and tasking. Farming activities and household effluent discharge are major contributor to high levels of phosphoric compounds. The major effect is eutrophication. This has become a threat to the health of the human population and aquatic habitat at large. The maximum tolerance level of the concentration of phosphoric compounds in water is 0.1 mg/L or less. However, this limit has been exceeded in most wastewater and thus, the necessity for a simple, cost-effective method for its removal. In developing countries, no stringent laws are imposed and non-availability of data to correct this enormity. This research has solved this through the immobilization of maize tassel on polyvinyl alcohol (PVA) for the decontamination of phosphoric compounds from surface water of a farmland.
1. Introduction
Water is one of the most fundamental requirements for all living organisms’ aside food and air. Pollutants are present in water bodies in various forms such as heavy metals, chemicals, and heavy substances. The major causes of eutrophication (premature aging of the water body) are phosphoric compounds. This leads to the ruin and death of aquatic plants, animals, and other living microorganisms. Eutrophication occurs as a result of the rapid growth of algae or cyanobacteria bloom based on the excess nutrients in the water, acting as a blanket on the surface of the water bodies thereby preventing the penetration of light to the aquatic plants. However, other causes of water pollution are through activities from agriculture, industrial development, and urbanization (Nguyen, Citation2015; Viswanathan et al., Citation2014).
Natural occurrence of phosphoric compounds in water, plants, and animals is at low concentrations values. Application of fertilizers in farmland, industrial cleaning agents, municipal wastewater and bodies of biological organisms is the unnatural means of occurrence. The release of industrial and municipal effluents to the land and surfaces of water bodies has polluted water resources including both the surface and groundwater, making the management of water resources more complex. This has become a threat to the health of the human population, particularly because it affects the lungs (Hashem, Citation2007).
Environmental Protection Agency, (EPA) criterion for the tolerance level of the concentration of phosphoric compounds in water, is 0.1 mg/L or less. However, this limit has been exceeded in our own environment especially in most wastewater and thus, the necessity for a simple, cost-effective method for the removal of phosphoric compounds in contaminated water (Amoo & Komolafe, Citation2018). The expected rate of the elimination of phosphoric compounds to attain the threshold value is capital intensive while in developing countries such as ours, no stringent laws and non-availability of data to validate the enormity. Various studies have been carried out to improve procedures and technologies for the removal of phosphoric compounds from water bodies. These techniques include the following: physical, chemical, and biological methods. From the wide classifications mentioned above, adsorption is a combination technique, that provides the best removal efficiency of phosphoric compounds (Gautam et al., Citation2014).
Current studies have demonstrated that decontamination of substances from wastewater or water bodies, through the use of biosorbents of plants origin such as alginate, dead and living biomass, chitosan, lignin, to mention a few are effective. Agricultural waste matters, such as maize tassel (C. M. Zvinowanda et al., Citation2009), rice husks (Krishnani et al., Citation2007), corn cobs (Kahn & Wahab, Citation2007), and polymerized orange peels (Guo et al., Citation2009), have also been suggested for the effective removal of toxic substances from aqueous solutions. However, various research studies have been carried out regarding the advantages of using different agricultural waste materials as an adsorbent for adsorption process in wastewater remediation.
The use of raw plant material in water treatment has a major impediment based on its susceptibility to bacterial attack. This reacts with the water impurities, leading to the formation of algae and bacteria that will end up destroying the biomass (Mambaa et al., Citation2012). The powdered maize tassel is soft, but when used alone, it clogs the column, thereby prohibiting flow. For efficient column evaluation, it is essential to immobilize the waste materials on an inactive surface that can give support without the maize tassel losing its ability to eliminate toxic substances. This has become imperative as results from previous studies on the use of raw biosorbents yielded low percentage removal of the metal ions (Yahya, Obayomi et al., Citation2020; Yahya, Yohanna et al., Citation2020). Immobilization of such biosorbents will enhance the strength and rigidity of its structure. Polyvinyl alcohol (PVA) offers such performance. It is a biocompatible semi-crystalline synthetic polymer that is accessible, cheap, and possesses tremendous resistance properties. It has good mechanical properties, strong ability to form films, high solubility in water and biodegradable (Chu & Hashim, Citation2006; Yagub et al., Citation2015). In addition, natural biomass materials often display a low affinity with phosphoric compounds, thus having a relatively low sorption capacity. To mitigate this effect, modification of the maize tassel fibers becomes very important. This study will focus on the immobilization of maize tassel-PVA for the removal of phosphoric compounds from surface water of a farmland. This was chosen as a result of the frequency and seasonal application of nitrogen, phosphorus and potassium (NPK) fertilizers for crop production, A fixed bed column will be used to vary the biosorbents bed height, the initial metal ions concentrations of the effluent and flow rates of the solution.
2. Materials and method
2.1. Materials
The chemicals used for this research work were purchased from Merck Chemical Company, made in the U.K. These include polyvinyl alcohol (PVA) 98% degree of hydrolysis, hydrochloric (HCl) acid, 37% assay, sodium hydroxide pellet (NaOH) ultrapure Sigma-Aldrich and methanol (CH3OH) analytical grade, with a percentage purity of 99.8%. The Maize tassel used for this experiment was collected from farmland in Chikakore Byazhin, Kubwa Abuja, Nigeria, while the surface water was acquired from Lapai Gwari fishpond in Minna, Niger state Nigeria.
2.2. Preparation of maize tassel powder
The maize tassel fibers weighing 800 g were sorted out from dusts, silts, and debris. This was rinsed under running water and thereafter, washed thoroughly with distilled water. Excess water was eliminated by leaving it to dry at ambient temperature before being dried properly in an oven at 105°C for 3 h until a constant weight is obtained. The sample size reduction was done with the aid of a hammer mill and sieved to a particle size of 150–500 μm. An electronic weighing balance was used to measure 500 g of the milled tassel powder (Sekhula et al., Citation2012).
2.3. Proximate analysis of the maize tassel powder
2.3.1. Determination of moisture and ash contents
The moisture and ash content were determined using ASTM standards of E 1756 (2008) and E 1755 (2001) respectively.
2.3.2. Determination of bulk density
An electronic weighing balance was used to weigh 20 g of the maize tassel in a 100-mL measuring cylinder. The cylinder was tapped 10 times against the palm and placed on the table to record the final volume (Ekpete & Marcus, Citation2017). The bulk density of the material was calculated using Equationequation (1)(1)
(1) ;
2.3.3. Determination of Iodine number
0.5 g of the maize tassel powder was weighed with an electronic weighing balance and transferred to a 250 mL conical. 10 mL of 5 wt % hydrochloric acid solution was added into each of the flask containing the maize tassel. Each of the flasks was swirled gently until the maize tassel was completely wetted with the acid. The conical flasks containing the mixture were placed on the hot plate and brought to boil to eliminate any sulfur content present; the conical flasks were removed and left to cool. A pipette was used to add 100 mL of 0.1 N iodine solutions into each flask and was vigorously shaken. The solution was sieved through a sheet of folded filter paper (Whatman 110 mm) into a beaker. 20 mL of the filtrate was used to rinse the pipette and discarded, while the residual was collected in clean beakers. Likewise, 50 mL of the filtrates were transferred into a conical flask with the aid of a measuring cylinder. Each of the filtrates was titrated with standardized 0.1 N sodium thiosulfate solutions until the solution turned to a pale yellow. 2 mL of the starch indicator solution was added, while the titration continued with sodium thiosulfate until one drop produced a colorless solution. The volume of sodium thiosulfate used for determination of the amount of iodine adsorbed onto the carbon (mg/g) was recorded and blank iodine was titrated with sodium thiosulfate and a starch indicator was used until the solution turned colorless and the volume of sodium thiosulfate used was recorded. The equation was used to determine the iodine number of maize tassels.
Iodine number (2)
where v is the volume of iodine, Ti is the amount of sodium thiosulfate solution used for titration of the iodine solution without maize tassel, Tf is the amount of sodium thiosulfate used for titration of iodine and the maize tassel, Ci is the concentration of iodine, Mi is the molar weight of iodine and w is the weight of the maize tassel (Wang & Lin, Citation2008).
2.3.4. Determination of point of zero charge
The salt addition approach was done by the inclusion of the same quantity of substrate, to a set of solutions of similar ionic strength at different pH values. 20 mL of 0.1 M NaNO3 was added to a weighed sample of 0.1 g of maize tassel in a series of centrifuge tubes and the pH was altered with 0.1 M HNO3 and 0.1 M NaOH to achieve the suitable pH range of 2, 3, 4, 5, 6, 7, 8, 9, 10, and 11. The pH values of the supernatant in each tube were indicated as pHi. The samples were shaken for 30 min using a centrifuge at 3500 rpm. After settling, the pH values of the supernatant in each tube were measured and denoted as pHf. The point zero charge was attained from the graph of ΔpH (pHf—pHi) against pHi. The above procedure was repeated with a change in the concentration of the salt solution (0.05 M NaNO3). Each of the experiments was done thrice, and the mean value was recorded (Bakatula et al., Citation2018).
2.3.5. Determination of crude protein
An electronic weighing balance was used to weigh 0.5 g of maize tassel and poured into the digestion tube with the addition of 20 mL of concentrated Hydrogen tetraoxosulphate (VI) acid. A selenium tablet was added to the mixture as a catalyst. The content in the tube was heated at a temperature of 350°C for 6 h until a clear solution (digest) was achieved. This solution was poured into a measuring cylinder and made up to 100 mL. 10 mL of 2% boric acid was taken into a 100 mL conical flask with three drops of mixed indicator (bromocresol green and methyl red) added to it. The color changed to pink and was then placed under the collecting spot. 10 mL of the digested sample was pipetted into the open chamber of the makhamps apparatus then followed by 10 mL of 40% NaOH. The mixture was then made to boil by the steam produced through the boiling water in the flat bottom flask. As the mixtures boiled, a gas (ammonia) evolved and was condensed by the condenser of the apparatus which was collected in the form of liquid into the boric acid. However, as the ammonia was being collected in the boric acid, the solution turned blue. The distillate collected was titrated using 0.1 M HCl until an endpoint was reached where the color change of the distillate was pink. Crude protein is calculated with the Equationequation (3)(3)
(3) ;
where TV is the titre value of hydrochloric acid used, 0.014 is nitrogen standard, MA is the molar concentration of hydrochloric acid, DF is the dilution factor and S is the weight of maize tassel used (Onwuka, Citation2005).
2.3.6. Boehm titration
One (1 g) of the maize tassel was weighed on an electronic weighing balance and put in each of the following solution (15 mL) of NaHCO3 (0.1 M), Na2CO3 (0.05 M) and NaOH (0.1 M) to determine the acidic groups sites present in the maize tassel and 0.1 M HCl to determine basic groups sites. Each of the mixture was kept in a cupboard for three days. The acidic and basic groups present in the maize tassel were ascertained by direct titration process. The acidic groups were computed in view that NaOH neutralizes carboxylic, lactonic and phenolic groups, Na2CO3 neutralizes carboxylic and lactonic groups and that NaHCO3 neutralizes only carboxylic groups. Carboxylic groups were calculated by direct titration with NaHCO3. The variation concerning the groups titrated with Na2CO3 and those titrated with NaHCO3 was inferred to be lactones and the change between the groups titrated with NaOH and those titrated with Na2CO3 was presumed to be phenol. Neutralization points were known using pH indicators of phenolphthalein solution for titration of a strong base and strong acid, and methyl red solution for a weak base with strong acid and pH together. To neutralize basic group sites, remaining HCl in the solution was back titrated with 0.1 M NaOH (Ekpete & Horsfall, Citation2011). EquationEquation (4)(4)
(4) was used to solve for the functional groups present in the maize tassel.
where [B] is the concentration of base, VB is the volume of the reaction base, ncsf is the moles of maize tassel surface functionalities on the surface of carbon that reacted with the base, VA volume of the aliquot taken from VB, [HCl] is the concentration of HCl and VHCl is the volume of acid used (Goertzen et al., Citation2010).
2.4. Adsorbent preparation
An electronic weighing balance was used to measure 8.5 g of PVA powder and poured into a 250 mL beaker containing 50 mL of distilled water. The mixture was stirred at a speed of 800 rpm at 80°C for 5 h and 17 g of sieved tassel powder added to the mixture while stirring. The mixture was stirred for another 1 h with a magnetic stirrer to get a homogeneous mixture until the tassel powder blended well with the PVA and the temperature of the mixture reduced to 50°C. After that, the homogeneous mixture was cooled, and added (drop wise), via the aid of a syringe to a beaker containing 99% methanol for 1 h. It was then rinsed with distilled water and dried in an oven at a very low temperature (30°C) before storing it in an airtight container. The diameters of the beads were measured using a vernier calliper (Sekhula et al., Citation2012).
2.5. Adsorbent characterization
The composition of maize tassel fiber was determined with the use of FT-IR spectrophotometer (Nicolet 560). The maize tassel fibers were crushed and mixed with Potassium bromide powders and packed into plates for FT-IR analysis. The wavelength ranges between 4000 and 650 cm−1. The spectra solution was fixed at 4 cm1 (Mwangi et al., Citation2011). The porosity and specific surface area were determined with the Brunauer–Emmett–Teller (BET) method using Nova e series equipment. The samples were degassed at 250°C for 4 h. The multiple-point BET surface area, adsorption total pore volume, and pore diameter were determined (C. M. Zvinowanda et al., Citation2009). This was carried out according to the method reported by Wang and Lin (Wang & Lin, Citation2008). The outer surface micro-porosity and pore size of the raw and loaded maize tassel PVA beads was observed with the aid of a scanning electron microscope (SEM) with an accelerating voltage of 15 kV at various magnifications of x500 and x1000. A thin layer of the adsorbent was mounted on the Al specimen holder by double-sided tape and coated with Au/Pb to a thickness of about 30 nm.
2.6. Surface water characterization
The pH of the surface water was analyzed before and after treatment with the aid of a pH meter, pH 25. The pH meter was firstly calibrated with a buffer solution of 2, 6, 8, and 9 then the probe was rinsed with distilled water and cleaned with a dry cloth. The probe was inserted into the surface water and the readings were taken. The dissolved oxygen was determined by the electrometric method using APHA 4500-OG, the dissolved oxygen measurement was submerged into the sample and the reading was taken in mg/L. Chemical Oxygen Demand (COD) was determined by the colorimetric method using PPHA 5220D. The culture tubes were washed with 20% sulfuric acid and rinsed with distilled water to avoid impurities before the analysis was carried out. 2 mL of the surface water, 1 mL of digestion solution and 3 mL of sulfuric acid were poured into the culture tubes. The mixture was placed in a block digester which has been preheated to a temperature for 150°C for 2 h and was allowed to cool at ambient temperature after the reading of the concentration was taken. Biochemical Oxygen Demand (BOD) of the water sample was analyzed using APHA 5210B method. 95 mL of the sample was poured into the BOD Trak sample bottles and BOD nutrient buffer pillow was added in each bottle for the growth of the bacteria. The magnetic bar was placed inside the sample bottles with the contents kept in the Chassis of the BOD Trak and incubated at 20°C for five days, while the BOD value was taken digitally from the instrument. The result of the surface water characterization is as shown in .
Table 1. Table showing the values gotten from the surface water
2.7. Column adsorption studies
Column adsorption studies were carried out according to the method reported by Sekhula et al., (Sekhula et al., Citation2012) and Yahya and Odigure, (Yahya & Odigure, Citation2015). The study was done with the aid of a glass column of internal diameters (I.D) of 3 cm and 50 cm in length. The beads were allowed to fall into the column under the force of gravity. The cotton wool which acts as a support by preventing it from flowing through the outlet was packed before and after packing the maize tassel-PVA beads. The flow rates of the effluent from the tank were controlled with the aid of the medical set. The following parameters were studied during the process such as flow rate, bed height, and initial concentration of the effluent. The column was open to the atmosphere to maintain the internal pressure in the columns near atmospheric pressure. The solution entering and leaving the top of the column was collected at various time intervals, and the effluent concentrations were analyzed with the aid of a UV-spectrophotometer. All experiments were conducted at room temperature and the direction of flow was from top-to-bottom and the flow continued until the effluent concentrations almost became equivalent with the influent concentration.
3. Results and discussion
3.1. Proximate analysis of maize tassel
Characterization of the maize tassel and the one immobilized in polyvinyl alcohol was done. The values of the surface characterization of maize tassel are shown in .
Table 2. Surface characterization of maize tassel
From , results show that maize tassel moisture and ash content are at a low-level, having values of 4.51 and 2.134%, respectively. These values are in accordance with comparison with corn stover (Tumuluru, Citation2015). According to Ekpete and Marcus, (Ekpete & Marcus, Citation2017), the presence of the low amount of moisture and ash content present in adsorbent materials shows that the density of the particles is small. Adebisi et al. (Adebisi et al., Citation2017) reported that these values would be remarkable for the biomass utilization as activated carbon and for biofuels production. The lower the moisture and ash value, the greater the adsorptive capacity and this is consistent with previous studies that the main components of corncobs are cellulose, hemicellulose and lignin (Maepa et al., Citation2015). The apparent density is a vital physical parameter that evaluates the filterability of the sorbent material. The amount of carbon present in a filter of a given solid can be determined by the quantity of treated liquid retained by the filter cake. The apparent density of maize tassel gotten is 0.41 g/mL. The apparent density of the adsorbent material affects the adsorption per unit volume but does not affect the adsorption efficiency per unit weight. If the density of the material is high, a small amount of the sample is sufficient for carrying out adsorption studies (Ekpete & Horsfall, Citation2011).
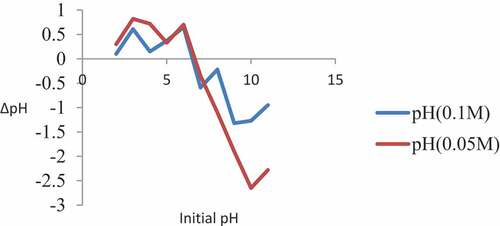
The use of iodine number is to evaluate the surface area of sorbent materials at ambient conditions for the determination of the adsorbent capacity of the materials. The increase in iodine number of carbon atoms has been attributed to the occurrence of enormous sorptive sites in the structure (Ekpete & Marcus, Citation2017). As observed in , the iodine number for maize tassel is 423.05, which showed that it has a large surface area which is a necessity for the adsorption process. The point of zero charge (PZC) is an essential measurable property of any sorbent material. They have pH values in which under specific conditions such as temperature, pressure and composition the surface charge components sum up to 0. This implies equal amounts of positive and negative charge. At pH below the point of zero charge, the adsorbent material is positively charged. This implies that the material will adsorb anions, while at pH values above the point of zero charge, the adsorbent is negatively charged, which means that the adsorbent will adsorb cations. The point of zero charge values might aid in the selection of a material for the removal of pollutants from effluents. Sorbent materials that have low point zero charge would be appropriate to remove pollutants that possess positive ions, while materials with high PZC values would be best to remove negative ions (Boparai et al., Citation2013). The curves obtained from (plots of ΔpH vs pH) following the salt addition technique at both ionic strengths of (0.05 and 0.1 M of NaNO3), were done in triplicates and the average taken are presented in .
Figure 1. A plot of the Change in Final pH and Initial pH against the Initial pH for maize tassel
3.2. Adsorbent characterization
The oxygen-containing groups were analyzed and evaluated with the aid of FT-IR. Due to the distinctive property of absorbing energy from the different bonds in each group, an FTIR spectrum disclosed the specific surface functional groups on the maize tassel fiber (C. Zvinowanda et al., Citation2008). The affirmations of the chemical structures of maize tassel fibers were gotten from FT-IR analysis. The composition changes observed for maize tassel fibers are shown in and .
Figure 2. FT-IR spectrum of maize tassel
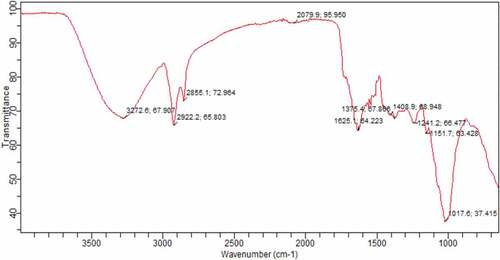
Table 3. The oxygen functional groups of maize tassels
Table 4. BET analysis
It shows the occurrence of hydroxyl, carbonyl, ether groups, and absorbed water in the maize tassel fiber, which can be bonded with cations easily (C. M. Zvinowanda et al., Citation2009). As shown in , the hemicellulose intensity of the peak appeared at around 1730 and 1240 cm−1 in the maize tassel (Jin et al., Citation2019). The functional groups present in maize tassel fiber presented in , indicate strong bonds between 3272 and 2922 cm-1 attributed to hydroxyl groups, alcohol, alkanes or Amine groups. The two bands at 2855.1 and 1625.1 cm−1 were ascribed to the alkanes and alkenes groups respectively. While the band at 1625.1 cm−1 was assigned to stretching of the carbonyl group. This work agrees with the reports of Mwangi et al. (Mwangi et al., Citation2011).
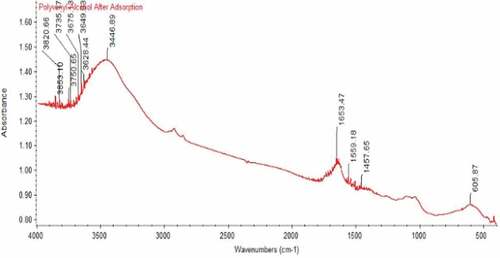
The spectra of maize tassel immobilized in PVA and phosphoric compounds loaded in maize tassel immobilized in PVA are shown in . The broad and strong bands at 3272.6–3446.89 cm−1 were ascribed to hydroxyl and amines groups of maize tassels immobilized in PVA before and after adsorption (Yahya et al., Citation2020a). The peaks at 2922, 1653.47 and 1653.47 cm−1 were as a result of—CH group and stretching vibration of -C = O group of maize tassels correspondingly. The peak detected at 1035 cm−1 after adsorption can be ascribed to—C–O stretching of carboxylic acids and alcohols. The functional groups of maize tassels altered significantly after PVA modification. Maize tassel in PVA displayed major absorption bands at 3272–3446.89 cm−1 and 1021 cm−1 were equivalent to stretching of hydroxyl and carbonyl groups. The result verifies that maize tassel was effectively modified by PVA, and the peak at 3272.6 cm−1 shifted to 3446.89 cm−1 for phosphoric compounds loaded with maize tassel immobilized in PVA adsorbent. This indicates that the hydroxyl group was mainly involved in the adsorption process.
Figure 3. FT-IR Result for Maize Tassel Fiber Immobilized with PVA
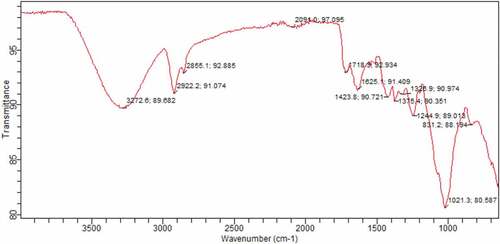
Figure 4. FT-IR Result of phosphoric compounds loaded in Maize Tassel Immobilized with PVA
The capability of adsorbent material to adsorb contaminants is an essential property due to its specific surface area. Typically, increase in surface area of the sorbent material determines the capability of adsorbing more contaminants. depicts the result of the surface area and pore volume on the maize tassel.
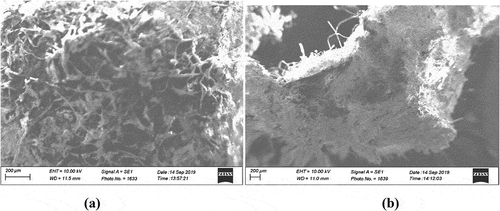
(a) and (b) show the scanning electron micrographs of maize tassel-PVA beads before and after adsorption. From ), the maize tassel immobilized in PVA showed a thin-like elongated fibrous matter that were interwoven and bounded to PVA, however, after adsorption, a swollen, denser micrograph was depicted indicating the possibility of leaching of the PVA and accumulation of the phosphoric compounds onto the maize tassel (Sekhula et al., Citation2012).
Figure 5. (a) SEM Micrograph of maize tassel (b) after immobilized in PVA and adsorption process
3.3. Column evaluation
This study particularly is centered on the column dynamics study as previous studies mostly utilized batch adsorption mode. To effectively solve the problem arising from the farmland and communities surrounding it; a pilot plant is desirous. The detailed evaluation and calculations of the performance of the maize tassel PVA mass transfer in the column and its adherence to some kinetics isotherm would helped to address this problem and thus, the novelty of the research.
3.3.1. Effect of bed height
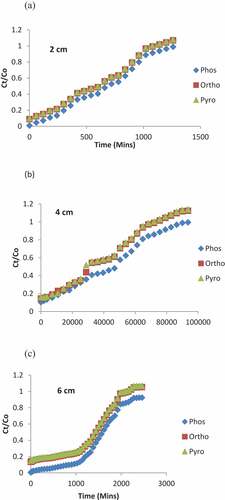
Variation of bed height on the breakthrough curve was studied at different heights of the adsorbent (Maize tassel PVA) ranging from 2, 4 and 6 cm equivalent to 6.3, 12.6 and 18.9 g, respectively, while the initial concentration of the effluent for phosphorus, orthophosphates, pyrophosphates and the flow rate were kept constant at 2, 6.13, 11.23 mg/L, and 4 mL/min, respectively. The wastewater was pumped and allowed to flow downward into the column and at the outlet; samples were taken at intervals from 15 to 1620 min for final concentration determination. The breakthrough curves as indicated in showed the plot of normalized concentration (Ct/Co) which is the ratio of concentration of the effluent leaving the column at specific time interval and the initial concentration against time. The breakthrough point has been defined as that point in the mass transfer zone in the column when the first appearance of the concentration of the phosphoric compounds is observed in the outlet effluent. In this zone, adsorption is complete and the concentration of pollutant in the bed varies from 100% to approximately 0% of the initial concentrations. The breakpoint time is that time at which breakthrough occur. This adsorption zone moves from the top of the column to the bottom, when the zone reaches the end of the bed, the pollutant in the effluent cannot be adsorbed any longer. This is called a saturated bed or exhausted bed. The representation of all this gives the concentration history and is called breakthrough curve (Yahya et al., Citation2020b). The breakthrough and saturation time increased as the bed height was varied. The plots showed the slope of the breakthrough curves which were slightly different at the bed heights, as is to be expected. Maize tassel beads adsorbed more of the phosphoric compounds at 6 cm bed height due to the increase in the amount of the adsorbents in the column. This allowed for more interactions between the anions and the active-binding sites for sorption to take place, and thus, lead to a mass transfer of the adsorbate into the adsorbent in the mass transfer zone. At similar initial ions concentration of a stable system, increase in bed height would result to a lengthier transfer of adsorbate to reach the exit, subsequently resulting in an extended breakthrough time. For higher bed height, the increase of adsorbent mass would provide a larger service area thus, leading to an increase in the volume of the treated contaminated solution. Furthermore, the breakthrough time of phosphorus at a bed height of 2 cm is at 183 min while at an increased bed height of 6 cm, increased to 750 min. The exhaustion time of phosphoric compounds also increased from 1250 to 2500 min as the height of the bed increased. Similar observations have been recorded by Yahya et al. (Singh et al., Citation2015).
Figure 6. Effect of bed height on the removal of phosphoric compounds at a (a) 2 cm (b) 4 cm and (c) 6 cm
3.3.2. Effect of inlet flow rates
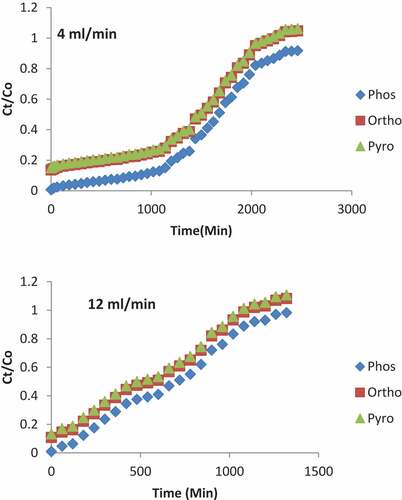
The effect of flow rates were investigated on the breakthrough curve by varying the flow rates between 4 and 12 mL/min. The samples were taken for analysis between the time intervals of 15–1620 min. The breakthrough curves at various flow rates were shown in . At different flow rates of 4–12 mL/min, constant bed height of 6 cm, and initial concentration of the influents at 2, 6.13 and 11.23 mg/L for phosphorus, orthophosphates, and pyrophosphates, respectively; it was revealed that the breakthrough generally occurred faster at higher flow rate. Breakthrough time reaching saturation was increased significantly with a decrease in the flow rate. The shape of the breakthrough curve is influenced by the flow rate; at low flow rate the breakthrough curve tends to be less steep (characterized by smooth S-shaped curve), which resulted into a longer exhaustion and breakthrough time At a lower flow rate of influent, phosphoric compounds had more time to be in contact with adsorbent, which resulted in greater removal of the contaminants in the column. When the flow rate increased to 12 mL/min, the breakthrough time decreased from 867 to 200 min and the exhaustion time decreased from 2500 to 1300 min.
Figure 7. Effect of flow rate on the removal of phosphoric compounds at a flow rate of (a) 4 (b) 12 mL/min
3.3.3. Effect of initial concentration
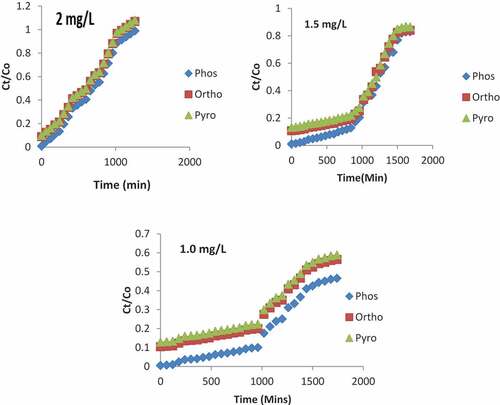
The effect of the initial concentration was investigated on the breakthrough curve as indicated in . The concentrations of the surface water were passed into the column from the top while keeping the flow rate and bed height constant at a value of 4 mL/min and 6 cm, respectively. The effluent samples were analyzed at interval of 15 to 1620 min. The breakthrough time decreased from 675 to 500 min with a decrease in the initial concentration of phosphoric compounds, due to a larger mass transfer coefficient. The presence of more phosphate ions at higher concentrations provided competition increased for the lesser available binding sites on the adsorbent (Zhu et al., Citation2009). At lower concentration, the breakthrough time increased from min and the exhaustion time increased from 1560 to 1777.8 min. Therefore, it is obvious that the adsorption process is concentration-dependent.
Figure 8. Effect of Initial Concentration on the removal of phosphoric compounds at (a) 2, 6.13 and 11.23 mg/L (b) 1.5, 4.8 and 8.9 mg/Land (c) 1, 3.15 and 5.83 mg/L
3.4. Column performance evaluation
3.4.1. Column performance evaluation at varying bed height
The following parameters volume of the effluent treated (Veff), maximum adsorption capacity (qtotal), the total phosphoric compounds sent to the column (mtotal), and the percentage removal of phosphoric compounds were calculated. From the result in , the following were obtained for phosphoric compounds adsorption: the total phosphorus sent to the column at a bed height of 2 cm was 20.16 mg out of which 13.91 mg was adsorbed; at a bed height of 4 cm, total phosphorus sent was 22.08 mg and 16.56 mg was absorbed, while at a bed height of 6 cm, total phosphorus sent was 41.44 mg, and 37.30 mg was adsorbed. The effective volume of contaminants treated was also higher at the increased bed heights. The percentage removal of phosphorus at a height of 6 cm was higher (90%) than the percentage removal at 4 and 2 cm which was 75% and 69%, respectively. This applies also for orthophosphates and pyrophosphates, although, there were overlapping and no distinct differences between some of the outlet concentrations values. This maybe as a result of the dissociation constant which are quite close to another. This can be ascertained from the study of phosphorous, where at solution concentrations of 1 mol/L; pH of 1.08, the pH is close to (PKa1 2.16), while at solution concentration of 10−2 mol/L; pH of 2.25, equimolar mixture of H3PO4 and H2PO4− is obtained. Below 10−3, that is the pH of 3.05 downward, the solution mainly composed of H2PO4 thus becoming non-negligible for very dilute solutions. The increase in removal of the phosphoric acid is a result of an increase in the amount of sorbent in the column which provided more binding sites for the phosphoric compounds (Sillerova et al., Citation2013).
Table 5. Column data parameter obtained on sorption characteristics of maize tassel immobilized in PVA at varying bed height
3.4.2. Column performance evaluation at varying flow rates
From the results in , the amount of phosphoric compound adsorbed, and percentage removal decreased with an increase in flow rate. For phosphorus adsorption, there is a decrease in the amount adsorbed from 18 to 15.84 mg, as the flow rate increased from 4 to 12 mL/min which led to the reduction of the percentage removal from 92% at 4 mL/min to 55% at 12 mL/min. The percentage removal of orthophosphates and pyrophosphates also reduced from (97–48%) and (91–35%), respectively, as the flow rate reduced. This is because, at high flow rates, the contact time gets shorter; limiting the capacity of the active sites of the phosphoric compounds from reaching full saturation and also causing the decrease in the number of phosphoric compounds adsorbed (Illy et al., Citation2020; Marin et al., Citation2014).
Table 6. Column data parameter obtained on sorption characteristics of maize tassel immobilized in PVA at varying flow rates
3.4.3. Column performance evaluation at varying initial concentration
In the same way, from , the percentage removal of phosphoric compounds increases as influent concentration decreases. The percentage removal of phosphorus increased from 74% to 97% when there was a reduction in the influent concentration from 2 to 1 mg/L. The percentage removal of orthophosphates and pyrophosphates increased from (76–93%) to (46–81%) when there was a reduction in the influent concentration from (6.13–3.15 mg/L) and (11.23–5.83 mg/L), respectively. The higher percentage removal of the phosphate ions at lower influent concentration despite reduction in the mass transfer coefficient is due to the availability of active sites which provided enough space for optimum solute molecules adsorption. At lower inlet concentration an extended breakthrough curve was obtained, however, at higher concentrations there were increasing driving force of the solutes toward the adsorbent, more phosphates ions were unadsorbed as a result of saturation of active sites (Gololobov, Citation1985)
Table 7. Column data parameter obtained on sorption characteristics of maize tassel immobilized in PVA at varying initial concentration
3.5. Analysis of fixed bed models
3.5.1. Clark Model
This model is based on the Freundlich isotherm model where Freundlich constant n = 2.06 is used for the calculation of the Clark model parameters A and r (min−1) (Zhu et al., Citation2009).
3.5.1.1. Effect of bed height on clark model
The R2 values using Clark model for the removal of phosphorus increased from 0.9498 to 0.975 as presented in . The result shows that at an increase in bed height, the removal efficiency of phosphoric compounds increases. The increase in bed height also shows a great increment in the rate constant and constant A for phosphorus, while, for the phosphoric compounds, an increase in bed height gave a resultant increase in constant A.
Table 8. Clark model constants at different bed heights of 2–6 cm and flow rate of 8 mL/min and initial concentration of phosphoric compounds
3.5.1.2. Effect of flow rate on clark model
The decrease in flow rate from 12 to 4 mL/min brought about an increase in R2 value from 0.9479 to 0.9746 (Phosphorus), 0.4009–0.6242 (Orthophosphates) and 0.3551–0.9648 (Pyrophosphates) as seen in . This is an indication that the Clark model is viable at a low flow rate for the removal of phosphoric compounds. As the flow rates increased, the rate constant increased and also the R2 values decreased for the phosphoric compounds.
Table 9. Clark model constants at different flow rate of 4–12 mL/min and bed height of 4 cm and initial concentration of phosphoric compounds
3.5.1.3. Effect of initial concentration on clark model
The effect of initial concentration on the Clark model shows that a reduction in the concentration of the surface water brought about a resultant decrease in the R2 values, the rate constant, and A ().
Table 10. Clark model constants at a different initial concentration of phosphoric compounds with a flow rate of 8 mL/min and a bed height of 4 cm
3.5.2. Thomas model
3.5.2.1. Effect of bed height on Thomas model
The R2 value using the Thomas model for the removal of phosphorus increased from 0.95 to 0.974 (phosphorus), 0.5228 to 0.6083 (Orthophosphates) and 0.5084 to 0.5509 (). It shows that at an increase in bed height, the removal efficiency of phosphoric compounds is high with higher amount adsorbed per each gram of the adsorbents.
Table 11. Thomas parameters at different bed heights of 2–6 cm, flow rate 8 mL/min and Initial concentration of the phosphoric compounds
3.5.2.2. Effect of flow rate
The R2 value using the Thomas model for the removal of phosphoric compounds decreased from 0.9735 to 0.9495 (phosphorus), 0.6083 to 0.4536 (Orthophosphates) and 0.5509 to 0.4139 (Pyrophosphates) with an increase in the flow rate from 4 to 12 mL/min ().
Table 12. Thomas parameters at different flow rates of 4–12 mL/min, bed height of 4 cm and initial concentration of the phosphoric compounds
3.5.2.3. Effect of initial concentration
A reduction in the concentration of the adsorbate gave a decrease in R2 values for orthophosphates and pyrophosphates with the following values 0.3761–0.9467 and 0.3274–0.9393, respectively. This reduction is as a results of the close dissociation constant for the ortho- to pyro phosphate while a decrease in the concentration of phosphorus brought about a decrease in R2 value from 0.9578 to 0.9562 as depicted in .
Table 13. Thomas parameters at different initial concentration of phosphoric compounds with flow rates of 8 mL/min and bed height of 4 cm
3.6. Reaction mechanism
The simplest compound of series of phosphoric acid is called ortho phosphoric acid (H3PO4). However, two or more ortho phosphoric acid molecules can be joined by condensation into larger molecules by elimination of water to form pyro phosphoric acid (H4P2O7)
2 H3PO4 → H4P2O7 + H2O
The reaction of maize tassel immobilized in polyvinyl alcohol for the uptake of phosphoric compounds can be represented thus;
ROH + O-P(OH)3 → O = P(OH)2OR + H2O(6) (Phosphorylation of hydroxide)
ROH + P4O10 → O = P(OH)2OR + H2O
N3CRRꞌCOOH + Ph3P→ Ph3P = N3CRRꞌCOOH→Ph3P+-NHCRRꞌCOO−(7) (Phosphorylation of carboxylic group)
The “RRꞌ” represent the complex maize tassel immobilized in PVA. The hydroxyl and carboxylic groups are the dominant functional group on the maize tassel and by esterification reactions with H3PO3 or H3PO4 they give phosphate groups (R-O-P(O)(OH)2, phosphite groups R-O-(OH)2 or phosphonic acid group R-P(O)(OH)2 that contain mobile hydrogen atoms that get attached to the adsorbents that are biodegradable and thereby leaving the contaminating solution free of the pollutants (Illy et al., Citation2020).
3.7. Comparison of the experimental data and the applied models
The Thomas model adequately predicted the experimental data better than the Clark model when considering phosphorus ranging from 0.9064 to 0.974, with orthophosphates and pyrophosphates being 0.3761–0.9467 and 0.3274–0.9393, respectively. The adsorption capacities were moderately high at increased bed heights. Increase in flow rate brought about a decrease in the correlation coefficient which was both similar to the experimental data. However, there was a difference between the experimental data and the Thomas model while varying initial concentration. The kinetic (kTh) constant increased with an increase in flow rate from 4 mL/min to 12 mL/min with values ranging from (0.0026 to 0.0051 mL mg/min) with corresponding reduction in adsorption capacity from 1630 to 630 mg/g for phosphorus. This implies that the breakthrough curve is favorable at a lower flow rate. For the Clark model, the correlation coefficient of the phosphoric compounds ranges from (0.3551–0.972). The Clark constant increased with the increase in bed height, with values (39.67–92.85) and had a reduction with values (86.84–31.81) when the flow rate was increased. This results in an increase in the values of the correlation coefficient from 0.9498 to 0.975 when considering an increase in bed height and a decrease in correlation coefficient, and 0.9746–0.9479 when considering an increase in the flow rate. This is similar to the experimental data realized for the removal of phosphorus.
3.7.1. Error function analysis
Clark and Thomas models used to study the adsorption of the phosphoric compounds by maize tassel PVA were verified by analyzing the correlation between the models by applying the error analysis functions SSE, HYBRID and MPSD. These values are presented on . The SSE values range of 0.0059–1.4884 and 0.0961–1.6641, HYBRID values of 0.0022–1.4078 and 0.00595–1.326, MPSD values of 0.0286–1.8298 and 0.1920–1.4241, R2 values of 0.5295–0.9740 and 0.5084–0.9740 were, respectively, obtained for Clark and Thomas model with respect to the variations in the bed height. Considering effect of flowrate using Clark and Thomas model, SSE values are 0.2717–1.6114 and 0.0361–1.3456, HYBRID values of 0.0768–2.0462 and 0.0311–1.6945, MPSD values of 0.3255–1.6119 and 0.4323–1.4502, and R2 value range of 0.4781–0.9746 and 0.5509–0.4735, respectively, for Clark and Thomas model. Comparing the values of the error functions of Clark and Thomas model with respect to the effect of initial concentration, SSE values are 0.0676–2.0025 and 0.0100–4.3264, HYBRID values of 0.0944–2.1774 and 0.0101–1.0901, MPSD values of 0.3630–1.8350 and 0.0108–1.6896, and R2 value range of 0.4009–0.9567 and 0.8745–0.9578, respectively. The low values of the error functions obtained from the verification of the two models indicate that Thomas Model can be considered to be the most fitted model for the adsorption operation and therefore reliable model since error function analysis is considered to be the most efficient optimization tool to verify the suitability of a model.
Table 14. Error Function values of the Clark model at different bed height
Table 15. Error Function values of the Clark model at different flow rates
Table 16. Error Function values of the Clark model at different initial concentrations
Table 17. Error Function values of the Thomas model at different bed height
Table 18. Error Function values of the Thomas model at different flow rates
Table 19. Error Function values of the Thomas model at different initial concentrations
4. Conclusions
The results from this study have demonstrated the removal efficiency of maize tassel immobilized in polyvinyl alcohol through the breakthrough curves obtained after column sorption process. The benefit of the analysis cannot be over emphasized as contaminated effluents were decontaminated and eutrophication of farmland aging processes was reduced drastically and solved at the long run. The application of the adsorbent revealed the extent of removal, up to and below the permissible limit. The maize tassel immobilized in PVA was characterized before and after adsorption with FT-IR, SEM and BET surface analyzer. These techniques showed the functional group responsible for the adsorption of phosphoric compounds, the morphology and porosity nature of the adsorbent. The column optimized studies showed that the increase in bed height, flow rates, and inlet concentrations had a significant effect on the breakthrough time and exhaustion time. The optimized column operates best at very low flow rate to give an extended breakthrough time. Furthermore, the Clark and Thomas were used to predict the breakthrough of the phosphoric compounds with the kinetics isotherms constant following the trends for column efficiency evaluation.
In 0.05 M NaNO3, the point zero charge value of maize tassel was 6.8. When the concentration of the salt was increased to 0.1 M, the point zero charge reduced to 6.6 with a minor reduction of PZC (0.2 pH unit). This was attributed to the slightly high concentration of the acid sites than that of the basic ones. This work agrees with Boparai et al. (Berber-Villamar et al., Citation2018) with the same salts and ionic strength with pHZPC of 6.25, and also in agreement with Berber-Villamer et al. (Ismadji et al., Citation2010) whose results was 6.83 for corncobs.At this value, the migration of phosphoric anions can easily be adsorbed by the immobilized maize tassel. Boehm’s method gives a semi-quantitative degree of surface functionalities since the chemical groups are more difficult and are indicated in Boehm titrations. The compounds, NaHCO3, Na2CO3, NaOH, and HCl acting as neutralizers for carboxylic groups, lactonic other groups, comparisons of the values as shown in revealed minor changes between the carbon samples and the acidic sites.
Additional information
Funding
Notes on contributors
Muibat Diekola Yahya
Muibat Diekola Yahya is a PhD holder in Chemical Engineering and lectures at the Federal University of Technology, Minna, Nigeria. Her area of specialization is on waste management, bio- remediation, environmental engineering, pollution and control. The indiscriminate release of toxic compounds in the form of heavy metals, contaminants and pollutants from small and medium scale enterprise has been a major challenge in developing nation and had spurred continuous research in waste managements. Agricultural wastes such as shea butter husk/cake, almond husk, kola nuts pods, maize tassels, cashew nuts shell, melon husk, cotton hulls to mention a few are among successful biomaterials that have been used for the decontaminations of wastewater. The application of column adsorption process at optimum conditions provides a database for pilot plant modelling and ultimately at industrial scale. This will enhance the environment, provides increase in job opportunity, entrepreneurial skills and revenue generation to host communities.
References
- Adebisi, J. A., Agunsoye, J. O., Bello, S. A., Haris, M., Ramakokovhu, M. M., Daramola, M. O., & Hassan, S. B. (2017). Proximate analysis and physicochemical properties of sugarcane bagasse, cassava periderm and maizeStalk. Iinternational workshop on advanced functional nanomaterials – IWAN 4 at: centre for nanoscience and technology, anna university, chennai – 600 025, tamil nadu, india, Volume 4.
- Amoo, T. O., & Komolafe, O. O. (2018). Assessment of water quality parameters in an artificial lake, southwestern Nigeria. Tropical Freshwater Biology, 27(2), 43–24. https://doi.org/10.4314/tfb.v27i2.4
- Bakatula, E., Richard, D., & Neculita, C. (2018). Determination of point of zero charge of natural organic materials. Environmental Science and Pollution Research, 25(8), 7823–7833. https://doi.org/10.1007/s11356-017-1115-7
- Berber-Villamar, N. K., Netzahuatl-Muñoz, A. R., Morales-Barrera, L., Cha´vez-camarillo, G. M., Flores-Ortiz, C. M., & Cristiani-Urbina, E. (2018). Corncob as an effective, eco-friendly, and economic biosorbent for removing the azo dye direct yellow 27 from aqueous solutions. PLoS ONE, 13(4), e0196428. https://doi.org/10.1371/journal.pone.0196428
- Boparai, H. K., Joseph, M., & O’Carroll, D. M. (2013). Cadmium removal by Nano Zerovalent Iron: surface analysis, effects of solution chemistry and surface complexation modelling. Environmental Science and Pollution Research, 20(9), 6210–6221. https://doi.org/10.1007/s11356-013-1651-8
- Chu, K. H., & Hashim, M. A. (2006). Copper bio-sorption on immobilized seaweed biomass: Column breakthrough characteristics. Journal of Environmental Sciences, 21 (4), 295–306. Dubai, United Arab Emirates (UAE).
- Ekpete, O. A., & Horsfall, M. (2011). Preparation and characterization of Activated Carbon derived from fluted pumpkin stem waste (Telfairiaoccidentalis Hook F). Research Journal of Chemical Sciences, 1(3), 10–17.
- Ekpete, O. A., & Marcus, A. C. (2017). Preparation and characterization of Activated Carbon obtained from plantain (Musa paradisiaca) fruit stem. Journal of Chemistry, 1–6. https://doi.org/10.1155/2017/8635615
- Gautam, R. K., Banerjee, S., Gautam, P. K., & Chattopadhyaya, M. (2014). Remediation Technology for Phosphate removal from waste water: an overview. Advances in Environmental Research, 36, 1–23.
- Goertzen, S. L., Theriault, K. D., Oickle, A. M., Tarasuk, A. C., & Andreas, H. A. (2010). Standardization of the Boehm Titration. Part I. CO2 expulsion and end point determination. Carbon, 48(4), 1252–1261. https://doi.org/10.1016/j.carbon.2009.11.050
- Gololobov, Y. G. (1985). Reactions of trivalent phosphorus with compound azides containing a mobile h-atom a conception of phosphazo-compound spirocyclization mechanism. Tetrahedron, 41(4), 793–799. https://doi.org/10.1016/S0040-4020(01)96459-2
- Guo, X., Liang, S., Feng, N., & Tian, Q. (2009). Adsorption of Cu2+ and Cd2+ from aqueous solution by mercapto-acetic acid modified orange peel. Colloids and Surfaces B: Bio-interfaces, 73(1), 10–14. https://doi.org/10.1016/j.colsurfb.2009.04.021
- Hashem, M. A. (2007). Adsorption of lead ions from aqueous solution by okra wastes. International Journal of Physical Sciences, 2(7), 178–184.
- Illy, I., Fache, M., Menards, M., Negrell, C., Caillol, S., & David, G. (2020). A review: phosphorylation of bio-based compounds: State of the art. Polymer Chemistry. https://doi.org/10.1039/x0xx00000x
- Ismadji, S., Ismanto, A., & Wang, S. S. (2010). Preparation of capacitor’s electrode from cassava peel waste. Bio-resource Technology, 101(10), 3534–3540. https://doi.org/10.1016/j.biortech.2009.12.123
- Jin, Y., Qu, J., Song, T., Liang, J., Bai, X., Wei, Y., Huang, S., & Dong, L. (2019). Adsorption Of Lead From Aqueous Solution by modified auricularia matrix waste: A fixed-bed column study. Ecotoxicology and Environmental Safety, 169, 722–729. https://doi.org/10.1016/j.ecoenv.2018.11.085
- Kahn, M. N., & Wahab, M. F. (2007). Characterization of chemically modified corncobs and its Application in the removal of metal ions from aqueous solution. Journal of Hazardous Materials, 141(1), 237–244. https://doi.org/10.1016/j.jhazmat.2006.06.119
- Krishnani, K. K., Xiaoguang, M., Christodoulatos, C., & Boddu, V. M. (2007). Bio-sorption mechanism of nine different heavy metals onto bio-matrix from rice husk. Journal of Hazardous Materials, 153(3), 1222–1234. https://doi.org/10.1016/j.jhazmat.2007.09.113
- Maepa, C. E., Jayaramudu, J., Okonkwo, J. O., Ray, S. S., Sadiku, E. R., & Ramontja, J. (2015). Extraction and characterization of natural cellulose fibers from maize tassel. International Journal of Polymer Analysis and Characterization, 20(2), 99–109. https://doi.org/10.1080/1023666X.2014.961118
- Mambaa, B., Olorundare, O., Krause, R., & Okonkwo, J. (2012). Potential application of activated carbon from maize tassel for the removal of heavy metals in water. Physics and Chemistry of the Earth, 50, 104–110.
- Marin, E., Rojas, J., & Ciro, Y. (2014). A review of polyvinyl alcohol derivatives: promising materials for pharmaceutical and biomedical applications. African Journal of Pharmacy and Pharmacology, 8(24), 674–684. https://doi.org/10.5897/AJPP2013.3906
- Mwangi, I. W., Ngila, J. C., & Okonkwo, J. O. (2011). A comparative study of modified and unmodified maize tassels for removal of selected trace metals in contaminated water. Toxicological and Environmental Chemistry, 94(1), 20–39. https://doi.org/10.1080/02772248.2011.638636
- Nguyen, N. T. (2015). Adsorption Of Phosphorus From Wastewater Onto Biochar: Batch And Fixed-bed Column Studies. Bachelor of Engineering, Helsinki Metropolia University of Applied Sciences.
- Onwuka, G. (2005). Food Analysis and Instrumentation Theory and Practice. Naphthali Prints A Division of HG Support Nigeria Limited No 6 Adeniyi Jones Close Surulere, Lagos, Nigeria.
- Sekhula, M. M., Okonkwo, J. O., Zvinowanda, C. M., Agyei, N. N., & Chaudhary, A. J. (2012). Fixed bed column adsorption of Cu (II) onto maize tassel-PVA beads. Chemical Engineering and Process Technology, 3(2), 1–5. https://doi.org/10.4172/2157-7048.1000131
- Sillerova, H., Komarek, M., Chrastny, V., Novak, M., Vanek, A., & Drabek, O. (2013). Brewers draft as a new low-cost sorbent for Chromium (VI): comparison with other bio-sorbents. Journal of Colloid and Interface Science, 396, 227–233. https://doi.org/10.1016/j.jcis.2013.01.029
- Singh, S. K., Katoria, D., Mehta, D., & Sehgal, D. (2015). Fixed bed column study and adsorption modelling on the adsorption of malachite green dye from wastewater using acid activated sawdust. International Journal of Advanced Research, 3(7), 521–529.
- Tumuluru, J. S. (2015). Comparison of chemical composition and energy property of torrefied switch grass and Corn Stover. Front. Energy Res, 3, 46. https://doi.org/10.3389/fenrg.2015.00046
- Viswanathan, T., Ramasahayam, S. K., Guzman, L., & Gunawan, G. (2014). A comprehensive review of Phosphorus. Journal of Macromolecular Science, Part A:Pure and Applied Chemistry, (51), 538–545.
- Wang, L., & Lin, C. (2008). Adsorption of Lead(II) Ion from aqueous solution using rice hull ash. Industrial Engineering Chemistry Research, (14), 4891–4897. https://doi.org/10.1021/ie071521z
- Yagub, M., Sen, T. K., Afroze, S., & Ang, H. (2015). Fixed-bed dynamic column adsorption study of Methylene Blue (MB) onto pinecone. Desalination and Water Treatment, 55(4), 1026–1039. https://doi.org/10.1080/19443994.2014.924034
- Yahya, M. D., Abubakar, H., Obayomi, K. S., Iyaka, Y. A., & Suleiman, B. (2020a). Simultaneous and continuous biosorption of Cr and Cu (II) ions from industrial tannery effluent using almond shell in a fixed bed column. Results in Engineering, 6(1). https://doi.org/10.1016/j.rineng.2020.100113
- Yahya, M. D., Aliyu, A. S., Obayomi, K. S., Olugbenga, A. G., & Abdullahi, U. B. (2020b). Column adsorption study for the removal of chromium and manganese ions from electroplating wastewater using cashew nutshell adsorbent. Cogent Engineering, 7(1), 1748470. https://doi.org/10.1080/23311916.2020.1748470
- Yahya, M. D., Obayomi, K. S., Orekoya, B. A., Olugbenga, A. G., & Akoh, B. (2020). Process evaluation study on the removal of Ni(II) and Cu(II) ions from an industrial paint effluent using kola nut pod as an adsorbent. Journal of Dispersion Science and Technology. https://doi.org/10.1080/01932691.2020.1822178
- Yahya, M. D., & Odigure, J. O. (2015). Fixed bed column study for Pb(II) adsorption using Calcium-Alginate treated shea butter husk (TSBH). Proceedings of the 2015 international conference on industrial engineering and operations management.
- Yahya, M. D., Yohanna, I., Auta, M., & Obayomi, K. S. (2020). Remediation of Pb (II) ions from kagara gold mining effluent using cotton hull adsorbent. Scientific African, 8, e00399. https://doi.org/10.1016/j.sciaf.2020.e00399
- Zhu, C., Wang, L., & Chen, W. (2009). Removal of Cu (II) from Aqueous Solution by agricultural by-product: peanut hull. Journal of Hazardous Materials, 168(2–3), 739–746. https://doi.org/10.1016/j.jhazmat.2009.02.085
- Zvinowanda, C., Okonkwo, J., Agyei, N., & Shabalala, P. N. (2008). Physiochemical characterization of maize tassel as an adsorbent. I. surface texture, microstructure and thermal stability. Journal of Applied Polymer Science, (111), 1923–1930.
- Zvinowanda, C. M., Okonkwo, J. O., Sekhula, M. M., Agyei, N. M., & Sadiku, R. (2009). Application of maize tassel for the removal of Pb, Se, Sr, U and V from borehole water contaminated with mine wastewater in the presence of alkaline metals. Journal of Hazardous Materials, (2–3), 884–891. https://doi.org/10.1016/j.jhazmat.2008.08.110