
 ?Mathematical formulae have been encoded as MathML and are displayed in this HTML version using MathJax in order to improve their display. Uncheck the box to turn MathJax off. This feature requires Javascript. Click on a formula to zoom.
Abstract
Reliable inspection of large steel forgings is a significant problem across multiple industries. When the dimensions of forgings are at least 1000 mm in each direction, ultrasonic phased array inspection becomes difficult because conventional probes are not designed to transmit and focus acoustic energy over such large distances. Using simulations and experiments, this article aims to discuss the possibilities and limitations of phased array imaging of large forged steel ingots. Simulations were used to design a transducer based on the reflected amplitude, as well as the lateral and axial resolutions of defects in a 1000 mm thick block. It was shown that when limiting the aperture to allow easy handling in an industrial inspection setting, the lateral resolution and the reflected amplitude were the main limitations. Increasing the element width maximizes the energy transmitted into the material, but it also moves elements away from each other, thus reducing the lateral resolution. Based on the simulations, an experimental phased array transducer was manufactured with eight elements of 9.25 × 22.5 mm. The probe was used to perform measurements and generate total focusing method images of three different at a depth of 370 mm in a 776 mm forged steel block.
PUBLIC INTEREST STATEMENT
Large size ingots of high-quality steel are generally dedicated to critical applications, such as plane landing gears or turbines. To prevent critical issues which can happen if a failure occurs, Non-Destructive Evaluation (NDE) is generally performed during the manufacturing process and during the part lifecycle. One of the most frequently used methods is the Ultrasonic Testing (UT) and one of its most advanced applications is Phased Array Ultrasonic Testing (PAUT), which creates images by processing ultrasonics measurements. One of the limitations of this technique is the dimensions of the parts because the longer the ultrasound propagates long distances, the more it is attenuated. For this reason, this work investigates the design of a PAUT probe which can provide enough energy to perform ultrasonic imaging for large dimension parts (more than one meter in each direction). This work will help ensure quality control for critical industrial applications.
1. Introduction
High strength forged steel is a material used in numerous critical applications, such as turbine shafts or aircraft landing gears. It is therefore important that it provides uncompromising quality and that its mechanical properties be guaranteed. To that end, non-destructive testing (NDT) is commonly used at the end of the manufacturing process to ensure integrity. Ultrasonic testing (UT) enables the detection of cracks and other heterogeneities. Phased array ultrasonic testing (PAUT) was first developed for medical imaging and was later applied to industrial inspections. This method uses an array of ultrasonic transducers that can be configured in a line, a two-dimensional matrix, or a circle (Loïc, Citation2012, march). The elements are activated following patterns also called sequences, and results can then be displayed as images. These images are used for crack detection and sizing at different depths with random orientations(Nanekar, Kumar, Jayakumar et al., Citation2015a, April). The multiple element configuration of the transducer also leads to a better signal-to-noise ratio (SNR). In order to increase imaging capabilities, several emitting sequences and reconstruction method have been proposed, such as Dynamic Depth Focusing which allows fast acquisition of high energy and Synthetic Aperture Focusing Technique to increase imaging framerate (Roberts, Citation2007) (Nanekar, Kumar, Jayakumar et al., Citation2015b). The main challenge is to adapt the probe to the material and the dimension of the block under inspection to reach the required sensitivity and resolution for the detection of cracks or other defects. Ultrasound beam computation is a critical step in the design process (Generazio & Harris, Citation1999) and depends on the size and the geometry of the emitting element, has been widely studied and can be computed through several methods, such as finite element(Chassignole et al., Citation2009) or ray tracing(Kolkoori et al., Citation2013). The ultrasonic testing sensitivity depends on the energy reflected from the flaws relative to a calibration(Cheeke, Citation2012). In full matrix capture (FMC) (Sutcliffe et al., Citation2012), the process of emitting with an element and receiving on all elements is repeated for all the elements in the array. The image obtained after beamforming is then the sum of the contributions from the reflections generated for each emission. This method, called Total Focusing Method (TFM), delivers the best resolution achievable. The reflection patterns depend on the relative position of the defects inside the emitted ultrasonic beams. Therefore, the accuracy of the interaction between the waves and defects is paramount in the development of new transducers (Calmon et al., Citation1998). Accordingly, models have been developed to compute these interactions using the Kirchhoff approximation or the geometrical theory of diffraction (GTD)(Darmon et al., Citation2016) (Darmon et al., Citation2009).
This study is interested in phased array inspection of blocks up to 1000 mm in thickness. The dimensions of the block lead to long propagation distances, and therefore, strong attenuation, which reduces SNR, and affects the maximum depth at which the inspection is reliable (Braconnier & Murakami, Citation2013)–(Villaverde et al., Citation2017). Moreover, most commercial transducers are designed for the inspection of small components, and as such transmit a limited amount of energy. For this purpose, some methods have demonstrated promising results to increase SNR for an FMC configuration by creating virtual sources of focused energy (Sumana & Kumar, Citation2020, December) or using Plane Wave Imaging (PWI)(Le Jeune et al., Citation2016). The elements of typical phased array probes are made of lead zirconate titanate (PZT), and the transmitted energy depends on the voltage applied across the electrodes of the elements, as well as on the dimensions of the elements. The voltage can, to some extent, be increased. However, depolarization of the element is possible when the voltage is too high. Therefore, industries that need to inspect large metallic blocks generally use single element transducers with diameters of 25 mm or more. Elements with large widths are detrimental to array imaging because as the element pitch increases the number of sources that can reach a given defect decreases. These parameters also affect the directivity and overlap between ultrasonic fields. Consequently, the number of paths used for the triangulation between the emission, the defect and the reception positions are reduced, and the lateral resolution decreases. As the resolution is one of the main concerns of this study, TFM will be used for image reconstruction.
This study, therefore, seeks to optimize the element dimensions, as well as the transducer aperture to reach a trade-off between the transmitted energy, the image resolution for the inspection of large size forged steel of a 1000 mm thick, and the handling of the probe in an industrial inspection setting. The first section of the paper presents the design optimization of the phased array transducer through simulations; a prototype probe was manufactured, and the results are compared with simulations. Finally, conclusions are drawn.
2. Probe design simulations
2.1. Configuration
A model was used to optimize the probe design with the NDT simulations software CIVA (Massy, France) (Calmon et al., Citation2006)–(Poidevin et al., Citation2008), using ray tracing, as well as finite elements through the Athena 2D plugin(Chassignole et al., Citation2009). The block was studied in two dimensions for computing time reasons. As the aim was to compute the optimal design for a transducer that enables the inspection of a 1000 mm block of forged steel, the inspection frequency was set to 2.25 MHz. This frequency is commonly used for parts of these dimensions as defined in ASTM, (Citation2015) and ASME(American Society of Mechanical Engineers and Committee on Nondestructive Examination, Citation2017) specifications because it provides a good compromise between resolution and attenuation. shows ultrasonic beams computed for element widths of 1 mm, 5 mm, 10 mm and 20 mm.
Figure 1. Ultrasonic beam comparison for a 600 × 300 mm block with element width of 1 mm, 5 mm, 10 mm and 20 mm
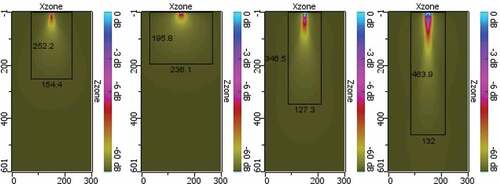
In , the black rectangles represent the area inside which the amplitude is above −40 dB relative to the beam maximum amplitude, and which corresponds to the minimum amplitude required to perform ultrasonic testing (generally −40 to −60 dB) (American Society of Mechanical Engineers and Committee on Nondestructive Examination, Citation2017). It can be observed that small elements are not adapted for the inspection of large blocks because the depth at which the amplitude is sufficiently high remains below 300 mm.
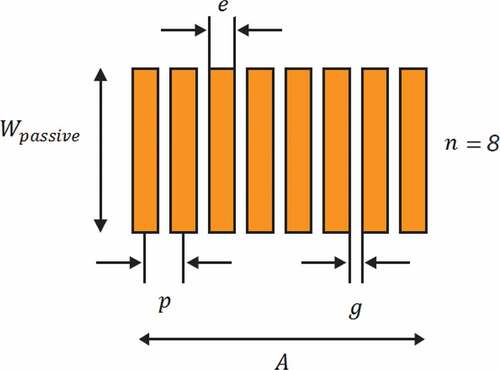
In order to optimize the phased array design, models with a 1.587 mm diameter side drilled hole at 50 mm, 262.5 mm, 475 mm, 687.5 mm and 900 mm were computed. The important parameters of the array transducer are shown in . is the passive aperture,
is the aperture,
is the element width,
is the gap between two elements,
is the pitch corresponding to the distance between two elements, and
is the number of elements. The element width was chosen to vary from 1 mm to 20 mm in five steps, and the gap between elements was set to zero (each element is in contact with its surrounding elements). The number of elements was chosen to vary (4, 8 or 16). This configuration allows us to evaluate a large variety of configurations with varying aperture, element size and number. The total aperture of the transducer was limited to 100 mm to allow easy handling in an industrial PAUT setting. As simulations were done in two dimensions, the passive aperture was not considered in the simulations.
Figure 2. Linear array transducer, where p is the pitch, g is the gap between two elements, n is the number of elements, e is the element width, A the aperture, and Wpassive is the passive aperture of the transducer
Aperture is varying from 4 mm for the smallest configuration to 100 mm. This range allows us to study the impact of the aperture on the focusing of the 5 SDH located a different depth. Based on this aperture range, it is expected to have a focussing limitation linked with the overall probe aperture’s nearfield. A good practical estimation of the near-field length is given by the formula (Olympus, Citation2004):
Based on this formula, the near-field length varies from 1.5 mm for a 4 mm aperture to 953 mm for a 100 mm aperture at 2.25 MHz.
The wedge configuration is a strong concern because of the long distances that the waves have to travel during the inspection of these large size blocks. Indeed, the phased array inspection of parts with smaller dimensions typically uses angled wedges because it reduces the amplitude of the echo associated with the backwall (Long et al., Citation2012), and allows the detection of defects using rebound and mode conversion. In the present work, the main problem was the strong attenuation associated with the large dimensions of the block. For this purpose, a straight wedge was chosen with a zero-degree inclination so as to reduce the distance between the potential defect and the probe, and therefore, maximise echo amplitudes. The disadvantage of this configuration is that axial cracks become difficult to detect. Computation was made for longitudinal, shear and converted modes (up to 100 modes) from reflections on reflectors, the back and side walls with maximum rebounds calculation. The FMC acquisition scheme was used.
The TFM was then applied to the FMC raw data. This reconstruction method defines pixels that are a sum of A-Scan, considering delays and
between the pixel, and, respectively, the transmitter and the receiver positions. Due to interferometry, the signal can be constructive or destructive, and an image is generated. The equation for the reconstruction is then:
is the amplitude of the pixel in an
,
matrix of
dimensions.
is the value of the signal for a
delay.
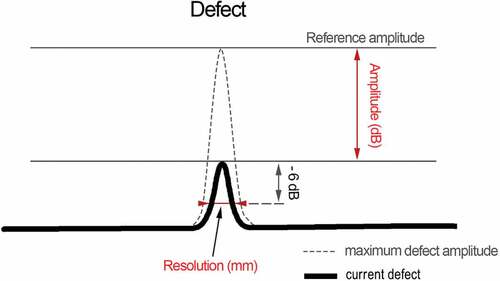
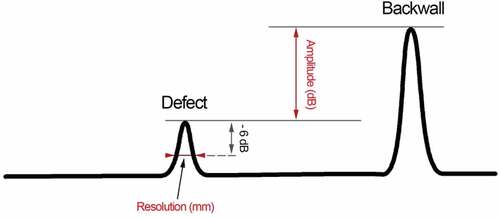
This method is well documented in the literature (Holmes et al., Citation2005) (Holmes et al., Citation2004). The reference amplitude was taken as the highest defect amplitude from all simulations and then the defect amplitude was set relative to that reference amplitude. The lateral and axial resolutions were, respectively, the peak dimensions along the width and the depth of the block at 6 dB below the defect maximum amplitude. The data processing method used is shown in .
Figure 3. Amplitude and resolution extraction from TFM simulation images
2.2. Results
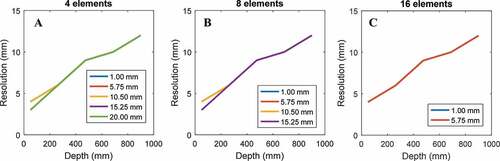
Fifty-five simulations and TFM reconstructions were carried out to evaluate the influence of the element width and the number of elements on the amplitude and resolutions over depth. The first parameter extracted was the defect’s reflected amplitude. presents the TFM reconstructed reflected amplitude as a function of the defect depth inside the steel block. The results are shown for 4 ( A), 8 ( B), and 16 ( C) elements. The decibel scale is relative to the maximum reflection corresponding to a defect depth of 50 mm and a phased array transducer containing 8 elements of 5.75 mm width.
Figure 4. TFM defect reflected amplitude as a function of defect depth for a 1.587 mm defect for a phased transducer with: A) 4 elements, B) 8 elements, and C) 16 elements for configurations of 1 mm, 5.75 mm, 10.50 mm, 15.25 mm and 20.00 mm width
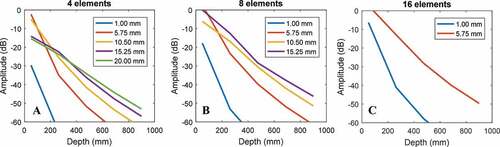
When the element width is 1 mm (blue lines in A, B, and C) the defect reflected amplitude decreased faster than for any other element width. Depending on the number of elements in the array, the reflected amplitude was under −60 dB for distances between 200 mm with 4 elements to 500 mm with 16 elements. This result demonstrates that conventional probes with narrow elements are not adapted for the inspection of large size forged ingots because the transmitted amplitude is too low. Therefore, this result confirms that a custom probe design was required. By analysing the trends of the curves for elements wider than 1 mm, it could be observed that increasing the number of elements increases the amplitude of the defect in the TFM images. For a low number of elements, the width did not appear to have a strong influence on the amplitude (except for 1 mm width), but for 8 and 16 elements, smaller elements provided lower amplitude, especially for long propagation distances. To obtain more information, the axial resolution was then computed and extracted, and is shown in .
Figure 5. TFM axial resolution as a function of depth for a phased array transducer with: A) 4 elements, B) 8 elements, and C) 16 elements for configurations of 1 mm, 5.75 mm, 10.50 mm, 15.25 mm and 20.00 mm width
The lines in are superposed, and are therefore not all visible. According to these simulations, the axial resolution appeared to be lower than 15 mm and followed similar trends for all transducer configurations. Considering the size of the ingots that this study aims to inspect, this value seemed to be low, and was not considered as a limitation for the transducer design.
Finally, the lateral resolutions were extracted and analysed following the same procedure, and are shown in .
Figure 6. TFM lateral resolution as a function of depth for a phased array transducer with: A) 4 elements, B) 8 elements, and C) 16 element for configurations of 1 mm, 5.75 mm, 10.50 mm, 15.25 mm and 20.00 mm width
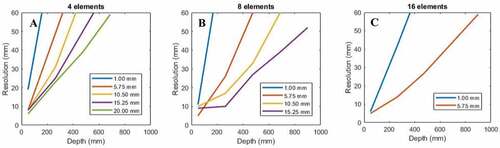
Compared with the axial resolution (), the lateral resolutions () were much worse. The low lateral resolutions would strongly limit the probability of detection of typical defects. A poor lateral resolution was observed for 1 mm element, especially for four and eight elements with values higher than 60 mm at 262.5 mm. Increasing the number of elements and thus the aperture provides better resolutions, and the best results are obtained when using elements between 5 mm and 15 mm. However, lateral resolution could be improved by combining images from two perpendicular plans with a second measurement taken from the side. In this configuration, axial resolution from one probe would become the lateral resolution of the other probe and the summation of both images would increase the axial resolution. However, a positioning system would be required for a second probe.
Using the amplitudes and resolutions that were computed and extracted from the previous simulations, it appeared that the best configuration would be 8 elements of 10.5 mm or 16 elements of 5.75 mm. These two configurations provided almost the same performance. However, a lower number of elements allow faster acquisition and reconstruction and is easier to manufacture. Therefore, the 8-element probe was chosen for experimental validation.
3. Experiments
3.1. Material
The material studied in this work is high strength forged steel. A block with dimensions 776 × 1000 × 1000 mm was forged and heat-treated. The nominal chemical composition is given in :
Table 1. Nominal chemical composition in percentage of the steel block used in this study
A previous study done on a similar block from the same manufacturing process provided extensive information on the metallurgical parameters and their impact on ultrasound wave propagation (Dupont-Marillia et al., Citation2019). The metallurgical analysis determined that the phases were mainly bainitic (98–99%) with residual austenite (less than 1%). From an ultrasonic point of view, velocities were 5950 m/s for longitudinal waves and 3230 m/s for shear waves, with an uncertainty of ±5 m/s along the inspection axis. Finally, attenuation was measured at 0.11 dB/mm at 2.00 MHz, with a power growth factor of 2. These values are consistent with the literature (Cheeke, Citation2012).
Using the parameters from the simulations, an experimental probe was made with eight elements in order to validate the simulation results experimentally. The element width was set to 9.25 mm, which is in line with the 10.5 mm recommendation plus a 1 mm gap due to the 3D printing capability of the case, and a 0.25 mm tolerance margin. The ratio of the element width to the transducer passive aperture was set to 0.4, in accordance with (Gros et al., Citation2002), therefore leading to a passive aperture of 22.5 mm.
Side holes were drilled (SDH) into the block with diameters of 6.25 mm, 3.18 mm, and 1.59 mm, at a depth of 370 mm. A 5-cycle 2.25 MHz Hann windowed toneburst was generated with an Agilent generator (trueform 33500b), amplified by a Ritec amplifier (RPR-4000) and multiplexed with 8 relays operated from an Arduino mega USB board ( A). The number of cycles could not be reduced due to the performance of the power amplifier when using externally generated signals.
Figure 7. Experimental setup: A) arduino multiplexing, and B) 8-element ultrasonic transducer
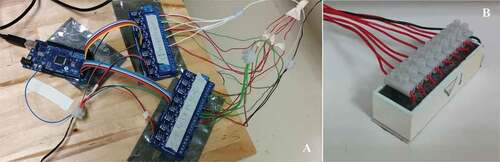
The transducer ( B) comprised a 3D ABS printed case, a 1.17 mm thick alumina matching layer and a tungsten loaded epoxy backing layer. The tungsten powder was used to increase the acoustic impedance of the epoxy to match the acoustic impedance of the piezoelectric elements of the transducer. Electrical connections were made with silver-epoxy and PZT 840 elements were used. Ultrasound coupling gel was used between the probe and the block. Measurements were done following the FMC acquisition sequence with eight elements, leading to 64 A-Scans. Then, TFM beamforming was performed using the delay and sum method. The reference amplitude was set relative to the backwall reflection, and resolutions were measured at 6 dB below the maximum amplitude of the defect, as shown in .
Figure 8. Experimental measurement of amplitude and resolution on TFM images
3.2. Experimental measurements and comparison with simulation
A 776 mm thick block was tested experimentally for three configurations: 3 SDH at a depth of 370 mm and with diameters of 1.59 mm, 3.18 mm and 6.35 mm. The three images generated using the conventional time domain TFM algorithm from FMC sequences for the three side drilled holes configurations are shown in .
Figure 9. Normalised TFM images of 370 mm depth defect in a 776 mm block from measurements: A) 1.59 mm, B) 3.18 mm, and C) 6.25 mm diameter
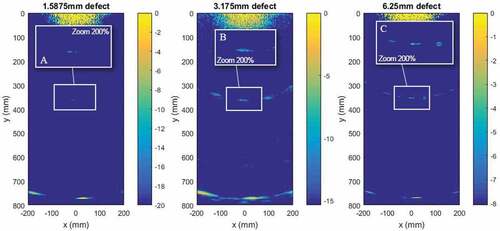
Cross-talk between the channels during transmission, as well as other electromagnetic noise, generated high amplitude artefacts near the surface of the block down to approximately 100 mm. The backwall and the defect were detected and reconstructed through the algorithm, but some artefacts were noticeable on both sides of the defect and of the backwall. These artefacts will be discussed later. In the reconstructed images, the defects were located between a depth of 365 mm and 375 mm with a standard deviation varying from 1 mm to 2.6 mm. The backwall was reconstructed at 777 mm (1.0 mm standard deviation) versus a theoretical value from simulations of 776 mm. This good precision in the backwall reconstruction validates the parameters used for the simulations.
3.3. Discussion
The measurements were then compared with the three equivalent simulated TFM reconstructions computed with CIVA software. The configuration from the previous section was used, except that the attenuation was reduced to 0.078 dB/mm in order to match the experimental backwall reflection amplitude. Profiles along the y- and x-axes were extracted and normalized to the backwall amplitude. The profiles were extracted from the maximum amplitude in a given direction. The profiles along the x-axis were extracted between 200 mm and 400 mm so as to include the artefacts on both sides of the defects, but discard the noise near the surface of the backwall. The simulations did not include noise because of the significant computation time associated with the long propagation distances. Therefore, the profiles along the axial y-axis were not compared to simulations. compares (A) the axial y-axis profiles and (B, C, D) the horizontal x-axis profiles for the 3 defects. Profiles were extracted from the maximum of each position.
Figure 10. TFM profiles along: A) the axial y-axis and B,C,D) the horizontal x-axis for defects with diameters of: B)1.59 mm C) 3.18 mm, and D) 6.35 mm
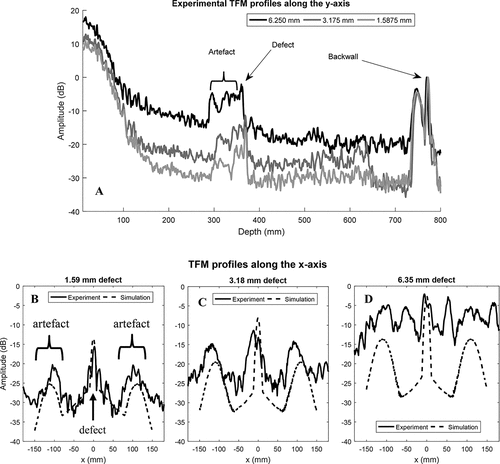
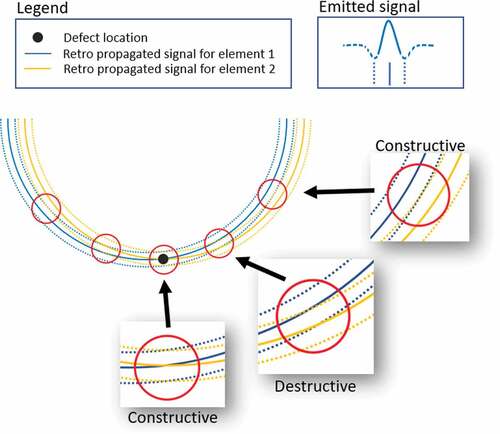
The comparison between the simulated and experimental amplitude profiles confirms that the artefacts on both sides of the defects are associated with the signal backscattered by the defects because they can be observed both in the simulations and the experiments. The artefacts are associated with the design of the probe: low element count on a large aperture. The small number of elements introduces reflections on the defect with low destructive interference. These artefacts can be explained by the low number of elements in the probe and the bandwidth of the emitted signal. At the defect location, all five cycles of the input signal of the eight elements are constructive. However, when the distance with the defect increases, the signals from the different element become destructive up to the position where the signal is completely destructive. Past this point, the inverse phenomenon happens, and the signals become constructive again with a phase change of 360°. For this reason, a new information named artefact is displayed on the image with a lower amplitude and a larger axial resolution since the 360° phase changes signal adds 1 cycle to the reconstruction. This phenomenon is illustrated in :
Figure 11. Artefact explanation for TFM imaging
In the experiments, the amplitude of the artefacts is proportional to the side drilled hole diameter. The overall trend in the simulated and experimental horizontal profiles is consistent: the peak amplitude agrees between simulations and experiments, as well as in the position of the artefacts on both sides of the defects. The amplitude of the artefacts relative to the peak amplitude of the defect increases with the defect diameter in experiments but remains roughly constant in simulations. The artefacts would therefore make the identification of defects more challenging in an industrial context, but a lower number of cycles could limit their impact.
The lateral/axial resolutions at −6 dB and the amplitudes of the defect relative to the backwall amplitudes were extracted and compared for each side of the drilled hole diameter. The resolutions were measured from images normalised to the peak amplitude of the defect so as to extract the full width at half maximum of the defect in both the axial and lateral directions. Results are presented in .
Figure 12. Comparison of A) the between the maximum defect amplitude and the maximum backwall amplitude, B) the axial resolution and, C) the lateral resolution for simulations and measurements
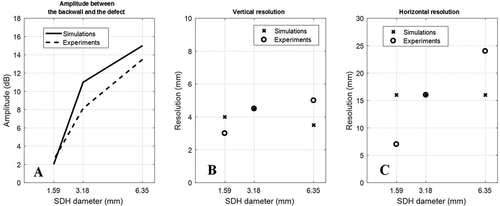
The experimental axial resolution is very close to the values extracted from the simulations, with a variation lower than 2 mm. The experimental horizontal resolution is better than the simulation for the 1.59 mm SDH, equal for 3.18 mm, and lower for 6.35 mm. Moreover, the results indicate that the amplitude difference between the defect and the backwall increased according to the same trend between experiments and simulations.
4. Conclusion
This paper explored the possibilities of adapting ultrasound phased array inspection to large forged steel blocks. A phased array transducer was optimized using the CIVA UT simulation platform. The main constraint was the maximum transducer aperture of 100 mm, which was set to enable easy handling in an industrial setting. The results showed that array transducers with elements of conventional size were not suitable because of the low transmitted acoustic energy. The results also showed that for a maximum aperture of 100 mm, the best compromise in these simulations was an 8-element transducer with 10.5 mm elements. This configuration provides a total aperture of 84 mm. A prototype probe was manufactured and tested on 776 mm forged steel blocks. The axial and lateral resolutions obtained experimentally were in good agreement with the simulations. However, strong artefacts due to the limited number of elements in the probe would limit the use of the probe in the detection of defects with large diameters. Also, this probe was designed to confirm the simulations, but the results show that increasing aperture would provide a better resolution. For this purpose, a fixed aperture of 100 mm would be preferred for a commercial solution. Finally, even if the 2.25 MHz frequency used in this study allows this inspection to be code compliant with ASME, a time-frequency multi-resolution study could be performed to evaluate the possibility to use a higher frequency to increase resolution. Also, the presence of artifacts introduced by the low number of elements was decreasing imaging capabilities. Advanced imaging techniques, such as Delay Multiply and Sum (DMAS)(Matrone et al., Citation2015) and Phase Coherence Factor (PCF)(Gauthier et al., Citation2021), have demonstrated a very good performance to decrease the amplitude of these unwanted artifacts. A future work should evaluate this algorithm. Finally, 9.25 mm elements would lead to a large nearfield length. This probe is not suitable to detect defect close to the inspection surface. Multiple scans from different sides could be performed to increase inspection reliability. Also, different emission sequences such as PWI could be studied.
Additional information
Funding
Notes on contributors
Frederic Dupont-Marillia
Frédéric Dupont-Marillia is a specialist in advanced applications of ultrasound imaging and a material engineer. He did his Ph.D. in the PulETS laboratory at ETS and work in close collaboration with Nucleom. His main topics are HTHA detection and Guided Wave inspection.
References
- American Society of Mechanical Engineers and Committee on Nondestructive Examination. (2017, issue 29). ASME Section V, Article 23 (Ultrasonic Standards). https://www.asme.org/codes-standards/publications-information/standards-certification-update/issue-29-fall-2017
- ASTM A714-99(2009)e1, Standard Specification for High-Strength Low-Alloy Welded and Seamless Steel Pipe (Withdrawn 2014), ASTM International, West Conshohocken, PA, 2009, https://doi.org/10.1520/a0714-99r09e01.
- Braconnier, D., & Murakami, T. (2013). Thick part inspection using volume focusing and large aperture phased arrays. 18th WCNDT. September. https://www.ndt.net/article/wcndt2008/papers/627.pdf
- Calmon, P., Lhémery, A., Lecœur-taı̈bi, I., Raillon, R., & Paradis, L. (1998, April). Models for the computation of ultrasonic fields and their interaction with defects in realistic NDT configurations. Nuclear Engineering and Design, 180(3), 271–14. https://doi.org/10.1016/S0029-5493(97)00299-9
- Calmon, P., Mahaut, S., Chatillon, S., & Raillon, R. (2006, December). CIVA: An expertise platform for simulation and processing NDT data. Ultrasonics, 44(Supplement), e975–e979. https://doi.org/10.1016/j.ultras.2006.05.218
- Chassignole, B., Duwig, V., Ploix, M.-A., Guy, P., & El Guerjouma, R. (2009, December). Modelling the attenuation in the ATHENA finite elements code for the ultrasonic testing of austenitic stainless steel welds. Ultrasonics, 49(8), 653–658. https://doi.org/10.1016/j.ultras.2009.04.001
- Cheeke, J. D. N. (2012). Fundamentals and applications of ultrasonic waves. CRC press.
- Darmon, M., Leymarie, N., Chatillon, S., & Mahaut, S. (2009). Modelling of scattering of ultrasounds by flaws for NDT. In A. Leger & M. Deschamps (Eds.), Ultrasonic Wave Propagation in Non Homogeneous Media (Vol. 128, pp. 61–71). Springer Berlin Heidelberg.
- Darmon, M., Dorval, V., Kamta Djakou, A., Fradkin, L., & Chatillon, S. (2016, January). A system model for ultrasonic NDT based on the Physical Theory of Diffraction (PTD). Ultrasonics, 64, 115–127. https://doi.org/10.1016/j.ultras.2015.08.006
- De Roumilly Loïc, and al. (2012, march). Introduction à la technique ultrasonore multiéléments. Techniques de l'ingénieur Analyses de surface et de matériaux, ref. article : p3790. https://www.techniques-ingenieur.fr/base-documentaire/mesures-analyses-th1/analyses-de-surface-et-de-materiaux-42383210/introduction-a-la-technique-ultrasonore-multielements-p3790/
- Dupont-Marillia, F., Jahazi, M., Lafreniere, S. & Belanger, P. Influence of Local Mechanical Parameters on Ultrasonic Wave Propagation in Large Forged Steel Ingots. J Nondestruct Eval 38, 73 (2019)
- Gauthier, B., Painchaud-April, G., Le Duff, A., & Bélanger, P. (2021, January). Towards an alternative to time of flight diffraction using instantaneous phase coherence imaging for characterization of crack-like defects. Sensors, 21(3), 730. https://doi.org/10.3390/s21030730
- Generazio, E. R., & Harris, C. E. (1999, July). The role of modelling and simulation in the development of advanced non-destructive evaluation systems. The Aeronautical Journal, 103(1025), 325–328. https://doi.org/10.1017/S0001924000064691
- Gros, X.E. & Cameron, N.B. & King, Martin. (2002). Current applications and future trends in phased array technology. Insight: Non-Destructive Testing and Condition Monitoring, 44, 673–678. https://www.ingentaconnect.com/content/bindt/insight#Supp
- Holmes, C., Drinkwater, B., & Wilcox, P. (2004). The post-processing of ultrasonic array data using the total focusing method. Insight-Non-Destructive Testing and Condition Monitoring, 46(11), 677–680. https://doi.org/10.1784/insi.46.11.677.52285
- Holmes, C., Drinkwater, B. W., & Wilcox, P. D. (2005, December). Post-processing of the full matrix of ultrasonic transmit–receive array data for non-destructive evaluation. NDT & E International, 38(8), 701–711. https://doi.org/10.1016/j.ndteint.2005.04.002
- Kolkoori, S. R., Rahman, M.-U., Chinta, P. K., Ktreutzbruck, M., Rethmeier, M., & Prager, J. (2013, February). Ultrasonic field profile evaluation in acoustically inhomogeneous anisotropic materials using 2D ray tracing model: Numerical and experimental comparison. Ultrasonics, 53(2), 396–411. https://doi.org/10.1016/j.ultras.2012.07.006
- Le Jeune, L., Robert, S., Lopez Villaverde, E., & Prada, C. (2016, January). Plane wave imaging for ultrasonic non-destructive testing: Generalization to multimodal imaging. Ultrasonics, 64, 128–138. https://doi.org/10.1016/j.ultras.2015.08.008
- Long, R., Russell, J., & Cawley, P. (2012, July). Ultrasonic phased array inspection using full matrix capture. Insight - Non-Destructive Testing and Condition Monitoring, 54(7), 380–385. https://doi.org/10.1784/insi.2012.54.7.380
- Matrone, G., Savoia, A. S., Caliano, G., & Magenes, G. (2015, April). The delay multiply and sum beamforming algorithm in ultrasound b-mode medical imaging. IEEE Transactions on Medical Imaging, 34(4), 940–949. https://doi.org/10.1109/TMI.2014.2371235
- Nanekar, P., Kumar, A., & Jayakumar, T. (2015a, April). Characterization of planar flaws by synthetic focusing of sound beam using linear arrays. Case Studies in Nondestructive Testing and Evaluation, Volume 3, 9–14. https://doi.org/10.1016/j.csndt.2015.01.001
- Nanekar, P., Kumar, A., & Jayakumar, T. (2015b, April). SAFT-assisted sound beam focusing using phased arrays (PA-SAFT) for non-destructive evaluation. Nondestructive Testing and Evaluation, 30(2), 105–123. https://doi.org/10.1080/10589759.2014.1002837
- O. Diligent, S. Chatillon, M. Darmon, A. Lhémery, and S. Mahaut, „Results of the 2004 UT Modeling Benchmark Obtained with the CIVA Software Developed at the CEA“AIP Conference Proceedings, 760(1843), 2005 https://doi.org/10.1063/1.1916894
- Olympus, N. (2004). Introduction to phased array ultrasonic technology applications. D Tech Guideline”, Olympus NDT, p111. https://www.olympus-ims.com/fr/books/pa/pa-intro/
- Poidevin, C., Roumilly, L., Cattiaux, G., Sollier, T., & Aux Roses, F. (2008). Simulation de la réponse ultrasonore de défauts réalistes dans CIVA. Actes Du Congrès COFREND, Toulouse, NDT.net :2009–01, Accessed: Jun. 22, 2015. https://core.ac.uk/download/pdf/21747318.pdf
- Roberts, R. A., “Dynamic control of aperture width using ddf phased array instrumentation,” in AIP Conference Proceedings, Portland, Oregon (USA), 2007, vol. 894, pp. 767–774, https://doi.org/10.1063/1.2718047.
- Standard practice for ultrasonic examination of austenitic steel forgings, ASTM A745. (2015) https://doi.org/10.1520/A0745_A0745M-15.
- Sumana,, & Kumar, A. (2020, December). Phased array ultrasonic imaging using angle beam virtual source full matrix capture-total focusing method. NDT & E International. Volume 116, Issue 102324. https://doi.org/10.1016/j.ndteint.
- Sutcliffe, M., Weston, M., Dutton, B., Charlton, P., & Donne, K. (2012, October). Real-time full matrix capture for ultrasonic non-destructive testing with acceleration of post-processing through graphic hardware. NDT & E International, 51, 16–23. https://doi.org/10.1016/j.ndteint.2012.06.005
- Villaverde, E. L., Robert, S., & Prada, C. (2017, September). ultrasonic imaging in highly attenuating materials with hadamard codes and the decomposition of the time reversal operator. IEEE Transactions on Ultrasonics, Ferroelectrics, and Frequency Control, 64(9), 1336–1344. https://doi.org/10.1109/TUFFC.2017.2690499