
Abstract
The implementation of renewable energy is a necessity nowadays and like any other technology involves challenges and opportunities to achieve. The main objective of our projects in an off-grid vulnerable community in Colombia is to design a smart grid to control the power grid, but also to understand the grid behavior and the actors (generators and consumers) for which a smart monitoring system must be implemented in the initial phase of these initiatives. This work proposes the design of a smart monitoring sensing system to gather information on both the status of electrical variables (i.e., power, current, voltage, reactive energy, and power factor) and environment variables (i.e., temperature, solar radiation, GPS, humidity, and atmospheric pressure) for an off-grid renewable energy system fit for a vulnerable community in Colombia. The system was created as a web-app that allows multiplatform access and allows scalability for large numbers of generators and loads. Finally, the system offers flexibility to exploit different sensors or hardware to measure the variables since it only reads the information from the data base.
PUBLIC INTEREST STATEMENT
The implementation of renewable energy is a necessity nowadays and like any other technology involves challenges and opportunities to achieve. The main objective of our projects in an off-grid vulnerable community in Colombia is to design a smart grid to control the power grid, but also to understand the grid behavior and the actors (generators and consumers) for which a smart monitoring system must be implemented in the initial phase of these initiatives. This work proposes the design of a smart monitoring sensing system to gather information.
1. Introduction
The use of renewable energies is a reality and a necessity, and like the traditional energy sources (Hydroelectric, Thermoelectric, Nuclear, etc.), it requires a grid to transmit and manage the supply of electrical energy. At the most fundamental level, the electric energy system is composed of three elements: generator, grid, and consumer. All three must be in balance with a constant management vigilance. To integrate all the actors coherently, the smart grid concept has become a critical solution. For the IEEE (IEEE, Citation2018), the smart grid is: “a revolutionary undertaking-entailing new communications-and control capabilities, energy sources, generation models and adherence to cross jurisdictional regulatory structures”. One of the objectives in the Enhancing Aquatic Renewable Energy (Universidad Cooperativa de Colombia, Citation2019) is to integrate the Renewable Energy source into the smart grid.
In Dileep (Citation2020), 16 functions of the smart grid are described, and one focus is: exchange data and real-time information. The information is vital to detect system failures or illegal behavior of the consumer but is the central piece in a renewable energy generation system. The energy produced is highly variable as it is a function of the environmental situations, such as solar energy and the amount of radiation or temperature, or wind energy with the wind speed and direction. Also, unlike traditional energy generation, renewable energy generators offer flexibility in their deployment and costs. So, it can be used to generate power in places where traditional energy sources are not feasible, like farms or distant communities. Also, urban homes are using renewable energy to generate their own energy and to reduce energy bills and increase autonomy.
The system developed is a solution that will be implemented in a region of Colombia which has been strongly affected by the armed conflict. In this region, there is no electricity supply for the entire community, so the implementation of this system will not only allow electricity to be provided to meet personal needs of the community but to store their fishing produce (an important source of their livelihood). Furthermore, this system will be supported on free technologies as well as on commercial-off-the-shelf (COTS) system elements leading to a low-cost system, easy to implement and easy to repair according to the community requirements.
In this paper, we propose the design of a smart sensing monitoring system for renewable energy fit for off-grid vulnerable communities in Colombia; the system will gather and exchange real-time information about the electrical and environmental variables of the system. The main goal is to enhance the use of renewable energy and in further work take decisions in the management and development of the electrical grid based on the data and calculated performance characteristics of the sources.
2. Literature review
Renewable energy, like traditional energy, requires monitoring to detect failures and take corrective action, which is one of the main objectives. Lazzarin (Citation2017) pointed to the other advantages and importance of monitoring renewable energy plants. Besides failures, the author identifies the inefficient working of the plant as the second objective in monitoring the system to achieve potential energy savings. To complement the electrical variable, as we mentioned before, environmental variables are important to measure in a renewable energy grid. The paper presented by Afonso et al. (Citation2011) describes a weather monitoring system for renewable energy production.
Thus, there are solutions of renewable management systems like those presented in Dumitru & Gligor (Citation2012). In Abo-Zahhad et al. (Citation2016), a wireless sensor network system with XBEE was used and all the monitoring was made using Labview. The same approach was used in Syafii et al. (Citation2017), but they focus on a solar panel grid. The system proposed by Ul Hassan et al. (Citation2019) is a real-time metering for the homes that are going to increase the production and utilization of renewable energy. They use differential privacy-based real-time monitoring to obtain the data and preserve the privacy of the users.
A cloud-fog-based approach was presented in Forcan & Maksimović (Citation2019) for smart grid monitoring. The architecture and the simulation show a viable smart grid monitoring system and can be modified for different topologies and dimensions. A real-time energy measurement IoT-based system is presented in Pawar et al. (Citation2017). The smart meter collects the data and stores in Google drive for subsequent analysis. Also, the system can give information about the energy consumption of a client and send energy bill messages. The paper in Villasevil et al. (Citation2013) presents a plug-in driven architecture for monitoring the renewable energy.
In Lunardi et al. (Citation2019), they gather the power characteristic information for the renewable energy system through wireless channels, and select the optimal voltage vector. A similar approach was made by Rodrigues Junior et al. (Citation2019), where smart meters were used for monitoring power quality disturbances over the smart grid.
With all the data collected by the smart system, an evaluation or simulations can be made. Nowadays multiple software tools are available, which are reviewed in Sinha & Chandel (Citation2014). There are also custom tools similar to that proposed by Kealy (Citation2020), where the authors used a closed-loop evaluation framework for renewable energy. The main goal of this work is to contribute to energy cost saving and emissions reductions. Another framework is described in Bhor et al. (Citation2016), which is a co-simulator for wide-area Smart Grid. Kabalci and Kabalci (Citation2017) model the requirements of renewable energy with a solar microgrid model using Matlab.
3. Experimental setup description and results
3.1. Architecture
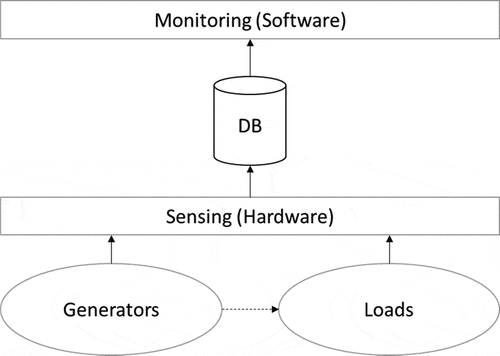
One of the first requirements is to design an architecture that captures the electrical and environmental data. For this system, we implement the architecture shown in . All the sensor and communication protocols will be implemented in a complementary sensing system (hardware based). We design the architecture to offer flexibility so custom sensors and embedded solutions can be used. The communication between the sensing and the monitoring is via the database in that the sensing will populate the database and the monitoring reads this information.
Figure 1. Overall architecture
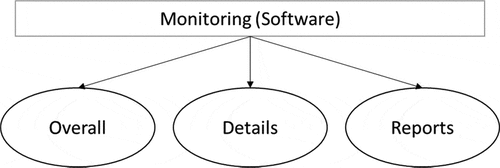
The monitoring software has three main components (). The first one is the real-time monitoring to the overall system; this is the dashboard that gives the user the general information in real-time about the energy grid. The second component is the detail of the generators and the loads in real-time. The electrical and environmental variables of the node (generator or load) can be monitored in this component if needed. The third component is the reporting function. As we said before, one of the main objectives of the sensing system is to enhance the use of renewable energy, so all the data gathered by the system must be analyzed to generate models to enhance the control and the performance of the grid.
Figure 2. System components
3.2. System implementation
The renewable energy smart sensing system monitoring software (RESS) was made as a WEB-APP using Apache 2.4.41 (The Apache Software Foundation, Citation2021) as server. The first version of the monitoring software was made with PHP 7.2.28 (The PHP Group, Citation2021), JavaScript (Pluralsight, Citation2021) for backend, Bulma CSS 0.8.2 (Thomas, Citation2021) as frontend and MYSQL 5.0.12 (Oracle Corporation, Citation2021) for the database. This is the first version developed to be a proof-of-concept of the monitoring software system.
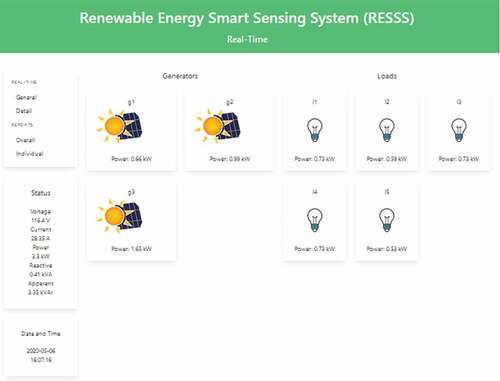
The RESS software was designed for a number of generators and loads. To date, the maximum number of generators is three with five loads that have been tested. gives a real-time view of the system. Since the main goal is to monitor an electrical grid, all the information in this view is about power generation and consumption in the grid. It gives us a general view of the state of the grid. The status box presents a summary of the electrical information of the generator nodes, where the voltage and power factor are the average of all the generators. The current, power, reactive power, and apparent power are the sum of the data in all the generators, and the date and time is the last timestamp in the data base. The status box shown in the detail view allows the user to observe the behavior of the grid from multiples viewpoints.
Figure 3. Real-time general view
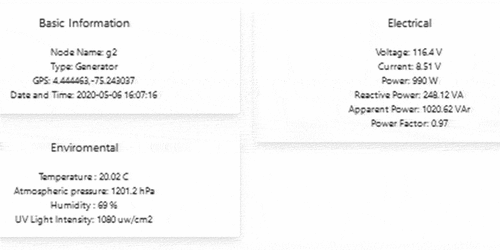
The detail view () can be accessed by clicking any of the generators or loads in the general view, and in the detail option in the menu. In this last option, a selector is made, so the user can choose between the generator or the load. For this version, we are only going to measure the environmental variables at the generators () because they directly affect the renewables generation efficiency. Also, one of the goals of the system is to create models about the behavior of the generators vs the environmental variables so in a later phase of work, a predictive model can be developed.
Figure 4. Details view
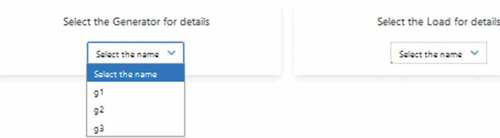
Figure 5. Generator detail view
The load detail view in only shows the electrical information and base information of the node. The system can be modified to measure environmental data for the load but will be defined as part of a future phase of the project.
Figure 6. Load detail view

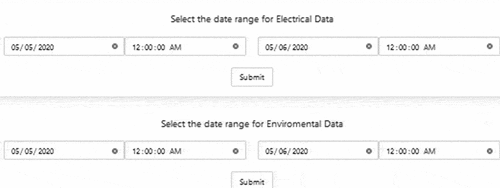
The last component of RESS is the report generation. RESS offers two options for reports. The first is an overall report (). This option filters the data of the report by date and time. The reports are downloaded in .xls format.
Figure 7. Overall reports view
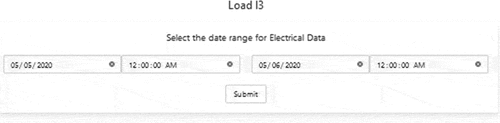
The second option is the individual report (). In this option, the user selects a generator node or a load. If a generator is selected, the electrical and environmental data are available for download (). Also, if a load is selected () in the first version only the electrical data can be downloaded. In both scenarios it is possible to filter by date and time.
Figure 8. Individual reports view
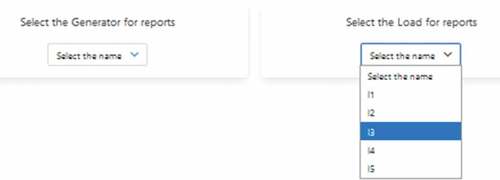
Figure 9. Load reports view
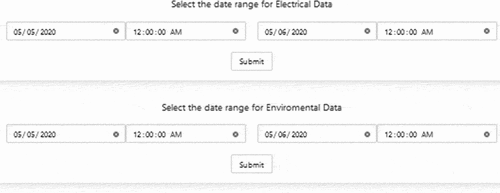
Figure 10. Generators reports view
3.3. Simulation and performance
A simulation was made to test the RESS and measure the initial performance. For the simulation, all the data were based on three generators and five loads all connected in a parallel topology. Each load is a house with 1 refrigerator, 1 washing machine, 1 laptop, 1 fan and 10 led 18 W bulbs. The power consumption model () was based and validated with data from (Le & Pitts, Citation2019) and has a random variation of 20% of the base power.
Table 1. Power consumption model
Since all the nodes are in parallel, the voltage theoretically is the same, so a random voltage is selected between 120 and 114 V. The power factor is also random where a number between 1 and 0.97 is selected. With the power, voltage, and power factor the current, reactive, and apparent powers are calculated. The total power consumption of the five loads is taken and with the voltage the electrical data of the three generators is created. We split all the power in 20%, 30% and 50% among the three generators. This simple approach allows us to generate all the electrical data needed to test and validate the performance of the RESS.
The environment data were simulated with the weather data based on (Cedar Lake Ventures, Citation2020) and random variations in the city of Ibague, Colombia. The variation of the temperature is 10% to 8%, atmospheric pressure is 0.01% and 0.02%, UV light intensity is 10% to 6% and humidity is 10% to 8%. All the variations are relatively small and could be caused as a fluctuation of a sensor reading.
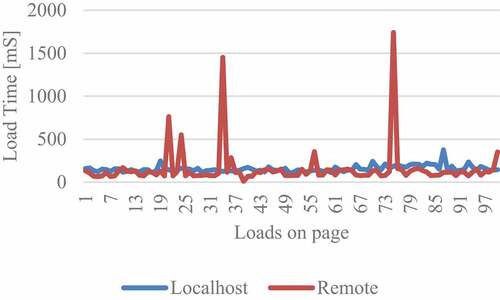
The performance test was made in two PCs: One is the localhost and the other is a PC in the same local network. Both with 1 Gigabit networks cards and Firefox as web browser. In all the 100 runs, we measure the load-time on the website using the network tool of Firefox. The first test was the input data performance created by the simulation script (). The results show an average load time of 154.6 ms for localhost and 153.51 ms in remote, but the behavior of the Localhost does not present important spikes.
Figure 11. Input data performance
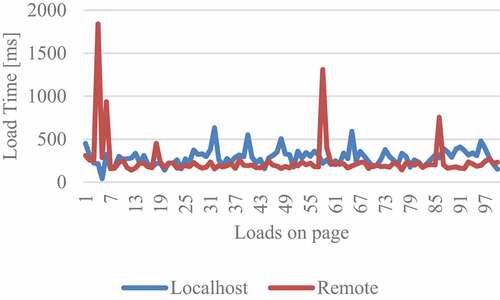
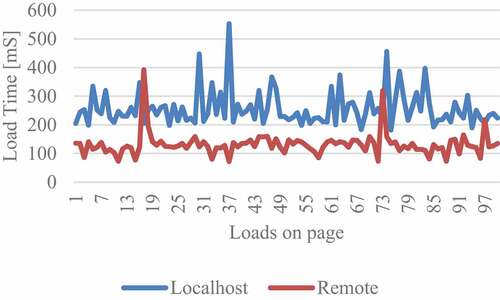
The next test is the load time of the Real-Time Performance (). The average load times for localhost are 286.33 ms and 244.38 ms for remote host. This difference of 41.95 ms could be higher if there are no spikes present.
Figure 12. Real-time general performance
As a final test, we measured the load times of Generator Detail () and Load Detail (). Both sites are similar, the only difference is that in generator, the environmental data is uploaded. The result shows a difference of 99.87 ms for generator and 125.21 ms in load. Both tests show that the remote has less load times than the localhost, but there are spikes because of the network connection.
Figure 13. Generator detail performance
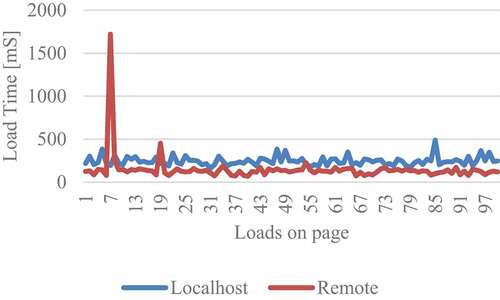
Figure 14. Load detail performance
4. Conclusions
The maximum load time in real-time monitoring at localhost was 633 ms and in remote 1840 ms. The remote shows reduced load times on average for all tests, but the network spikes change the maximum values. We conclude with 8 nodes in the system (3 generators and 5 loads) if the RESS is at Localhost a refresh rate of 633 ms could be achieved, but for a PC in the same network it would be 1840 ms. We selected 2 seconds of refresh as after some additional testing with users that a 2 second refresh gave enough information about the grid.
The simulation validates the correct functions of the components of RESS. The next step in the development of RESS is the integration of the sensors with all the hardware to measure an electrical grid for testing.
We presented the version 1.0 of RESS and recognize that there is room for improvement and enhancement. We show that as a proof-of-concept, RESS can be used to sense an electrical grid and gather all the electrical and environmental information. Also, we want to determinate the limit in terms of the relationship between the number of nodes and the refresh rate. This will be done with the integration of the hardware for sensing.
5. FutureWork
The present work is the result of the first phase of the implementation of the system. The main objective of this phase was to test and validate the performance of the monitoring software. A simple proof of concept was used by simulation of the sensor information.
The system will be implemented in a non-grid-connected zone of Colombia, where historical armed-violence relegated this zone in terms of provision of public services like water and energy. The second phase of RESS will be monitoring the implantation of energy generation and consumption with solar panels. Since the implementation of the energy will be an important upgrade for the community, the study of the utilization and the performance of the grid will allow a better understanding of the needs in terms of electrical consumption and generation.
Acknowledgements
The authors acknowledge the financial support received from Colombo-French Association of Researchers (COLIBRI) (project name: “Ecosistema Sostenible alrededor de las Energías Renovables paraPuerto Carreño”), and the Universidad Cooperativa de Colombia (UCC) (project name: “Sistema Inteligente de Sensado basado en IOT para Redes con Energía Renovable”), grant number: INV2786. Also, the acknowledgment is for the COST Actions CA17128 “LignoCOST”, CA17133 “Implementing nature based solutions for creating a resourceful circular city”, and the Institute for Planning and Promotion of Energy Solutions for Non-Interconnected Zones (IPSE) of the Colombian Ministry of Mines and Energy for their support and encouragement in carrying out scientific networking between different stakeholders.
Additional information
Funding
Notes on contributors

Ramón Fernando Colmenares-Quintero
Ramón Fernando Colmenares-Quintero is currently the national head of research in engineering and Professor Dr. at UCC with research focus on energy generation, simulation and modelling in the energy sector and vulnerable communities.
Oscar Camilo Valderrama-Riveros is an electronic engineer and a Master in Electronic and Computer Engineering graduated from Andes University. With experience in smart sensors, and wireless sensor networks with radial topology.
Fernando Macho is Managing Partner of SEC which is a consulting firm in Spain, whose main aim is to advise on international matters and foreign trade, and to give support ranging from financial aid and means of obtaining it, training and employment projects.
Kim E. Stansfield got a PhD in Composites from Kingston University. He was sustainable energy systems transformation planner at the UK ETI. Joined Warwick WMG in 2016.
Prof. Dr. Juan Carlos Colmenares-Quintero is the leader of the research group CatSEE from the IPC/PAS in Poland. His interests range from materials science/nanotechnology to photocatalysis and water/air purification.
References
- Abo-Zahhad, M., Ahmed, S. M., Farrag, M., Ahmed, M. F. A., & Ali, A. (2016). Design and implementation of building energy monitoring and management system based on wireless sensor networks. Proceedings - 2015 10th International Conference on Computer Engineering and Systems, ICCES 2015, 230–12. https://doi.org/10.1109/ICCES.2015.7393051
- Afonso, M., Pereira, P., & Martins, J. (2011). Weather monitoring system for renewable energy power production correlation. IFIP Advances in Information and Communication Technology, 349(AICT), 481–490. https://doi.org/10.1007/978-3-642-19170-1_53
- The Apache Software Foundation. (2021). Welcome! - The Apache HTTP server project. https://httpd.apache.org/
- Bhor, D., Angappan, K., & Sivalingam, K. M. (2016). Network and power-grid co-simulation framework for Smart Grid wide-area monitoring networks. Journal of Network and Computer Applications, 59(June2015), 274–284. Elsevier. https://doi.org/10.1016/j.jnca.2015.06.016
- Cedar Lake Ventures. (2020). The typical weather anywhere on earth - weather spark. https://weatherspark.com/
- Dileep, G. (2020). A survey on smart grid technologies and applications. Renewable Energy, 146, 2589–2625. https://doi.org/10.1016/j.renene.2019.08.092
- Dumitru, C.-D., & Gligor, A. (2012). SCADA based software for renewable energy management system. Procedia Economics and Finance, 3(12), 262–267. https://doi.org/10.1016/S2212-5671(12)00150-5
- Forcan, M., & Maksimović, M. (2019). Cloud-Fog-based approach for smart grid monitoring. Simulation Modelling Practice and Theory, 101988. https://doi.org/10.1016/j.simpat.2019.101988
- IEEE. (2018). Home - IEEE smart grid. Institute of Electrical and Electronics Engineers (IEEE). https://smartgrid.ieee.org/about-ieee-smart-grid
- Kabalci, Y., & Kabalci, E. (2017). Modeling and analysis of a smart grid monitoring system for renewable energy sources. Solar Energy, 153, 262–275. https://doi.org/10.1016/j.solener.2017.05.063
- Kealy, T. (2020). A closed-loop renewable energy evaluation framework. Journal of Cleaner Production, 251, 119663. https://doi.org/10.1016/j.jclepro.2019.119663
- Lazzarin, R. M. (2017). The importance of monitoring renewable energy plants: Three case histories. Thermal Science and Engineering Progress, 4, 197–204. https://doi.org/10.1016/j.tsep.2017.09.010
- Le, V. T., & Pitts, A. (2019). A survey on electrical appliance use and energy consumption in Vietnamese households: Case study of Tuy Hoa city. Energy and Buildings, 197(2019), 229–241. https://doi.org/10.1016/j.enbuild.2019.05.051
- Lunardi, A. S., Sguarezi Filho, A. J., Capovilla, C. E., Casella, I. R. S., & De Medeiros, A. A. M. (2019). A wireless coded predictive direct power control for renewable energy sources in smart grid environment. International Journal of Electrical Power and Energy Systems, 112(July2018), 319–325. https://doi.org/10.1016/j.ijepes.2019.05.004
- Oracle Corporation. (2021). MySQL. Oracle Corporation. https://www.mysql.com/
- Pawar, J. P., Amirthaganesh, S., Arunkumar, S., & Satiesh Kumar, B. (2017). Real time energy measurement using smart meter. Proceedings of 2016 Online International Conference on Green Engineering and Technologies, IC-GET 2016, 1–5. https://doi.org/10.1109/GET.2016.7916747
- The PHP Group. (2021). PHP: Hypertext Preprocessor. PHP Group. https://www.php.net/
- Pluralsight. (2021). JavaScript.com. Oracle Corporation. https://www.javascript.com/
- Rodrigues Junior, W. L., Borges, F. A. S., Veloso, A. F., Da, S., Rabêlo, R., De, A. L., & Rodrigues, J. J. P. C. (2019). Low voltage smart meter for monitoring of power quality disturbances applied in smart grid. Measurement, 147, 106890. https://doi.org/10.1016/j.measurement.2019.106890
- Sinha, S., & Chandel, S. S. (2014). Review of software tools for hybrid renewable energy systems. Renewable and Sustainable Energy Reviews, 32, 192–205. https://doi.org/10.1016/j.rser.2014.01.035
- Syafii, R. M. I., Putra, R., & Putra, M. H. (2017). Real-time measurement of grid connected solar panels based on wireless sensors network. Proceeding - 2016 International Conference on Sustainable Energy Engineering and Application: Sustainable Energy for a Better Life, ICSEEA 2016, 95–99. https://doi.org/10.1109/ICSEEA.2016.7873574
- Thomas, J. (2021). Bulma: Free, open source, and modern CSS framework based on Flexbox. Bulma. https://bulma.io/
- Ul Hassan, M., Rehmani, M. H., Kotagiri, R., Zhang, J., & Chen, J. (2019). Differential privacy for renewable energy resources based smart metering. Journal of Parallel and Distributed Computing, 131, 69–80. https://doi.org/10.1016/j.jpdc.2019.04.012
- Universidad Cooperativa de Colombia. (2019). La UCC y COTECMAR trabajando en proyecto de Energías Renovables Acuáticas. https://www.ucc.edu.co/noticias/prensa/investigacion/la-ucc-y-cotecmar-trabajando-en-proyecto-de-energias-renovables
- Villasevil, F. X., Vigara, J. E., & Chiarle, L. (2013). Plug-in driven architecture for renewable energy generation monitoring. Renewable and Sustainable Energy Reviews, 27, 401–406. https://doi.org/10.1016/j.rser.2013.06.048