
 ?Mathematical formulae have been encoded as MathML and are displayed in this HTML version using MathJax in order to improve their display. Uncheck the box to turn MathJax off. This feature requires Javascript. Click on a formula to zoom.
Abstract
Environmental hazards associated with release of emission from petroleum refineries have caused serious concerns for the host communities. The study focused on the assessment of the contribution of Nigerian refineries to the ambient air quality. Total emission of toluene, ethyl benzene and xylene (TEX) from Nigerian twenty-six (four existing and twenty-two proposed) refineries were estimated using emission factor approach, under no-control measure (worst case scenario) option. Results showed that the four existing refineries emit 2.90 × 10¹³ tons of toluene, 1.93 × 10¹³ tons ethyl benzene and 1.06 × 10¹³ tons per year while the twenty-two proposed refineries have the capacity of releasing annually 9.17 × 10¹³ tons of toluene, 6.69 × 10¹³ tons of ethyl benzene and .95 x 1013 tons of xylene. If operated at full capacity, the total estimated TEX emission from the existing refineries stood at 5.89 × 10¹³ tons/year while the proposed refineries have the potential of adding additional 2.01 × 10¹⁴ tons/year. These concentrations were considered as environmental menace that could have adverse health challenge of the residents of the host communities. Some technologically driven measures to control and subsequently reduce TEX emission from these refineries were suggested.
PUBLIC INTEREST STATEMENT
The study investigate the amount of Hazardous Air Pollutant that will be released from the existing and proposed refineries into the ambient air of their host communities. Total emission of toluene, ethyl benzene and xylene (TEX) from Nigerian twenty-six (four existing and twenty-two proposed) refineries were estimated using emission factor approach. It was observed that the emissions from these refineries will be of great threat to the host communities if control measures are not put in place.
1. Introduction
Continuous increase in both global population and energy consumption has led to a decrease in air quality and this phenomenon is being rapidly recognized as a major environmental and public health issue in both developing and developed nations (WHO, Citation2005). Ambient air quality is associated with United Nations Sustainable Development Goals. Mitigating measures targeted at enhancing clean air directly influence climate mitigation access, access to clean and affordable energy, sound waste management and other areas of socio-economic development (Rafaja et al., Citation2018). Clean air ensures safe and resilient environment, retards climate and its impacts and promotes environmental sustainability. Several health issues such as asthma, bronchitis, acute respiratory infection, cardiovascular diseases, lung cancer and nervous system disorder have been traced to adverse effect of air pollution (Brauer et al., Citation2007; McConnell et al., Citation2010; Odekanle et al., Citation2016; Pope et al., Citation2006). Apart from this, close to 2.4 million deaths per year are attributable to varying degrees of exposure to different types of air pollutants (Magaji & Hassan, Citation2015). Industrialization and urbanization accompanied by increase in energy consumption have significantly contributed to air pollution problem in Nigeria as a result of the release of emission from anthropogenic activities such as domestic, industrial, and vehicular activities (Odekanle et al., Citation2017; Shukla et al., Citation2008).
Petroleum refineries are parts of the largest industries in Nigeria having the greatest contribution to national economy. The impacts of petroleum as source of Nigerian economy cannot be underestimated. They separate crude oil into different fractions and other products through sequence of separation techniques. However, potential environmental pollution associated with the petroleum refineries continues to generate great concern to the host communities (Damian, Citation2013). Exposure to pollutants emitted from petroleum refinery has been reported to be responsible for cancer-related illness; developmental and reproductive difficulties; complication in respiratory condition as well as cardiovascular diseases (Edokpolo et al., Citation2014). Sources of these pollutants within a refinery either through normal, fugitive or accidental emissions include but not limited to equipment leaks (from valves or other devices); high-temperature combustion processes in the actual burning of fuels for electricity generation; the heating of steam and process fluids; and the transfer of products (U.S. Department of Energy (DoE), Citation2007). Pollutants can also be released during maintenance and shut-down operations (Bozlaker et al., Citation2013). Petroleum refineries have been recognized as major emitters of toxic pollutants such as benzene, toluene, ethyl benzene, and xylene (commonly referred to as BTEX) apart from emission of hydrocarbons like natural gas (methane) and light volatile fuels which are less toxic (Beckett et al., Citation1998). They also release criteria air pollutants such as particulate matter (PM), nitrogen oxides (NOx), carbon monoxide (CO), hydrogen sulfide (H2S), and sulfur dioxide (SO2).
With a maximum crude oil production capacity of 2.5 million barrels per day, Nigeria is ranked as Africa’s largest producer of oil and the eighth largest oil producing country in the world. Nigeria has four existing petroleum refineries: Kaduna Refining and petrochemical company (KPRC) located at Chikun Local Government of Kaduna State operating at 110,000 bbl/day; Warri Refining and petrochemical company (WRPC) located at Warri southwest local government of Nigeria’s Delta State with an installed capacity of 125,000 bbl/day; Port Harcourt Refining Company (PHRC) has two refineries at Alesa-Eleme, near Port Harcourt in Nigeria’s Southern Province, Rivers State. Port Harcourt I refinery has installed capacity of 60,000 bbl/day while Port Harcourt II refinery is the complex new refinery with installed capacity of 150,000 bbl/day. One of the strategies developed in Nigeria to increase her refining potential includes approval of more refineries to complement the existing ailing four state-owned refineries which, despite having a combined production capacity of 445,000 bbl/day, remain unable to meet the nation’s petroleum products demand (scarcity of petroleum products); twenty-two proposed refineries have been licensed and are at various stages of completion (Department of Petroleum Resource DPR, Citation2004, Citation2010).
Several research works have been reported on the assessment of emission of benzene, toluene, ethylbenzene and xylene from some anthropogenic sources. For instance, Moslem et al. (Citation2020) measured BTEX concentrations in the ambient air of eight different operating rooms in hospital of Sabzevar, Iran, using passive sampler. He reported the overall mean concentrations of benzene, toluene, ethylbenzene, xylene and total BTEX to be 10.0, 7.2, 1.8, 0.4 and 19.4 µg/m3, respectively. Of all these pollutants, the report indicated that only benzene has cancer risk of exposure in all operating rooms above the USEPA acceptable limit. In a similar study, spatial distribution and risk assessment of BTEX compounds in Urmia, Iran, were investigated by Mohammadi et al. (Citation2020) in twenty monitoring stations. The study found the mean concentrations of benzene, toluene, ethylbenzene and xylene to be 12.83, 27.03, 4.72 and 27.35 µg/m3, respectively, with lifetime carcinogenic risk of exposure to benzene higher than threshold limit of 1 × 10⁻⁶. In addition, in the capital city of Qom, Iran, mean concentrations of benzene, toluene, ethylbenzene and xylene were found to be 15.2, 22.49, 5.69 and 12.38 µg/m3, respectively (Mojarrad et al., Citation2020). The study of Mokhtari et al. (Citation2016) did not only show that benzene and toluene emissions concentrations were higher in the late morning hours than early hours but also that the main sources of the emissions could be linked to street traffics and gasoline stations. There are other various submissions from several other authors on the monitoring and assessment of BTEX in ambient air (Tiwari et al., Citation2010; Esmaelnejad et al., Citation2015; Tehrani et al., Citation2020). From literature search however, few documented reports on the assessment of benzene and criteria pollutants from refinery were obtained (Edokpolo et al., Citation2014; B. S. Fakinle et al., Citation2021). Dearth of reported information on the investigation of TEX (toluene, ethyl benzene) from petroleum refineries is a driving force behind this study.
As part of research efforts to assess the impacts of various anthropogenic activities on ambient air quality, coupled with scarce documented information on the contribution of refineries to local atmospheric pollution load across Nigeria, there is urgent need to investigate emission from these industrial facilities in order to provide necessary scientific information for environmental sustainability. It is opined that the more the refineries, the more the emissions generated, and the more dangerous it becomes on health and the environment which may result in degraded air quality of host environment, hence the need to control the rate of emissions in the refineries. This study aims at assessing the potential contribution of petroleum refineries to emission of toluene, ethyl benzene and xylene in Nigeria’s airshed using the emission factor approach. Activities data of the refineries were combined with the emission factors of different units at the refineries to estimate the emissions of toluene, ethylbenzene and xylene. The result of the study will provide information that would help in policy making on how to mitigate the release of these hazardous pollutants from petroleum refineries.
2. METHODOLOGY
2.1. Study area
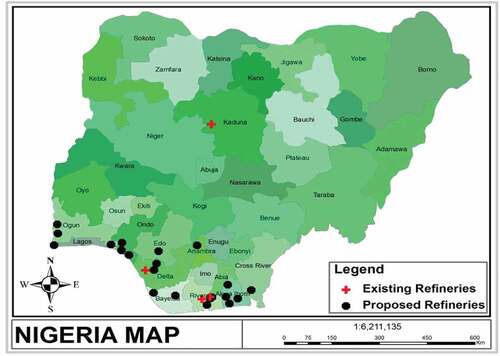
Nigeria is one of the most populous countries in West Africa sub-region, having about 400 ethnic groups and 500 languages. Nigeria is the eighth largest producers of oil among the Organization of Petroleum Exporting Countries (OPEC). Although, the country is classified into six geopolitical zones, based on similarity in culture, history and ethnicity (B.S. Fakinle et al., Citation2017), it could also be broadly divided into northern and southern regions with each region having different number of states. Apart from one of the existing refineries which is located in the northern part of Nigeria, all the other three existing petroleum refineries and twenty-two proposed are located in the southern part of the country () possibly because of the large availability of deposit of crude oil in the region. The refineries’ names, location (including longitude and latitude), capacity and year of production are as obtained from B. S. Fakinle et al. (Citation2021).
Figure 1. Map of the study area showing the existing and proposed petroleum refineries
2.2. Estimation of TEX emissions
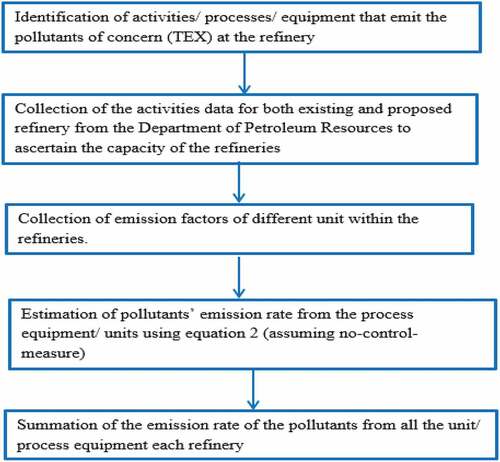
Using the method described by Sonibare et al. (2007) and subsequently utilized by B. S. Fakinle et al. (Citation2021), emission factors of various units within the refineries were combined with the activities of the refineries to quantify the rate of emission of toluene, ethylbenzene and xylene (WHO, Citation2005). Following the procedure presented in , the approach involves preparation of detailed emission inventory using the information on the activities of the refineries as contained in the documented reports of the Department of Petroleum Resources [(Department of Petroleum Resource (DPR), Citation2001; Department of Petroleum Resource DPR, Citation2004; Department of Petroleum Resource DPR, Citation2010) as well as information on the emission factors of different units at the refineries (RTI: Research Triangle Institute, Citation2015) to estimate toluene, ethyl benzene and xylene (TEX) emission as follows:
Figure 2. Flowchart showing procedure for estimating TEX emission rate
Emission rate (E) (ton/annum) =
where P = annual operating rate of the refinery; Q = emission factor (kg/unit)
D = % control efficiency, since there was absence of information on the level of efficiency of the control devices, control efficiency was assumed to be zero (Mulenga & Siziya, Citation2019; B. S. Fakinle et al., Citation2021). Therefore, EquationEq. (1)(1)
(1) becomes:
Emission rate (E) (ton/annum) = PQ(2)
At each of the refinery, processes, equipment and activities from where the pollutants are released were identified. This ensured the use of appropriate emission factor and the estimation of emission rate of each unit or process. The nation’s Department of Petroleum Resources was then contacted to obtain the activities data of the proposed refineries. This helped to ascertain individual production capacity. Using the emission factor of each unit obtained from literature, the emission rates from each process were estimated. Total emissions of the pollutants from the refineries were determined as the sum of emission from point and area sources .
Table 1. Estimated Toluene emission (tons/yr) for existing refineries
Table 2. Estimated ethyl benzene emission (tons/yr) for existing refineries
3. Results and discussion
Total estimated emission rates from the four existing refineries were presented in . The estimated average emission rates from Kaduna Refining and Petrochemical Company were 1.78 × 10¹¹ tons/yr for toluene, 1.62 × 10¹¹ tons/yr for ethyl benzene and 3.12 × 10¹⁰ tons/yr for xylene. For Port Harcourt Refinery I, average emission rates of TEX were 1.12 × 10¹¹ tons/yr for toluene, 7.69 × 10¹⁰ tons/yr for ethyl benzene and 1.70 × 10¹⁰ tons/yr for xylene. For emissions from Port Harcourt Refinery II, average value of 2.43 × 10¹¹ tons/yr was recorded for toluene, 2.21 × 10¹¹ tons/yr for ethyl benzene and 4.26 × 10¹⁰ tons/yr for xylene. For Warri Refinery, average values of 2.03 × 10¹¹ tons/yr for toluene, 1.84 × 10¹¹ tons/yr for ethyl benzene and 3.55 × 10¹⁰ tons/yr for xylene were recorded.
Table 3. Estimated xylene emission (tons/yr) for existing refineries
From the tables, highest emission rates of toluene, ethylbenzene and xylene were obtained from Port Harcourt Refinery II, while Port Harcourt Refinery I recorded the lowest emission rates of these pollutants. This could possibly be attributed to the production capacity of each of the refineries, with Port Harcourt refinery II having the highest production capacity of 150,000 bbl/day and Port Harcourt refinery I having the lowest capacity of 60,000 bbl/day. Total of 2.90 × 10¹³ tons of toluene, 1.93 × 10¹³ tons of ethylbenzene and 1.06 × 10¹³ tons of xylene are released to Nigerian’s airshed on annual basis from the existing refineries. Under full operation, the total estimated TEX emission from the existing refineries stood at 5.89 × 10¹³ tons/year.
Grouping the proposed refineries based on their localization, the emission rates of Amakpe International Refinery, Chase Wood Consortium Nigeria Limited, Qua Petroleum Refinery Limited and Resource Refinery and Petrochemical Limited were projected to have mean value of 4.12 × 10¹² tons/year for toluene, 3.12 × 10¹² tons/year for ethylbenzene and 6.42 × 10¹² tons/year for xylene. Annual average emission rates of Antonsio Oil, Gasoline Association International Refinery, and Total Support Limited were projected to be 3.28 × 10¹² tons for toluene, 2.48 × 10¹² ton of ethylbenzene and from 6.05 × 10¹¹ tons for xylene.
Emission rates of Clean Water Refinery, NPS Refineries Limited Services, Rivgas Petroleum and Energy Services as well as Starrex Petroleum Refinery were projected to have mean values of 4.52 × 10¹² tons/year for toluene, 3.45 × 10¹² tons/year of ethylbenzene and 8.36 × 10¹¹ tons/year for xylene. Ilaje Refinery and Petrochemical, Ode Aye Refinery Limited and Owena Oil and Gas Limited- all have the potential of emitting annual average of 5.06 × 10¹² tons/year of toluene, 3.85 × 10¹² tons/year of ethylbenzene and 9.36 × 10¹¹ tons/year of xylene. Similarly, under no-control measure, Niger Delta Refinery and Petrochemical as well as Sapele Refinery have capacity of emitting average of 5.85 × 10¹² tons of toluene per year, 4.43 × 10¹² tons of ethylbenzene per year and 1.08 × 10¹² tons of xylene per year. Orient Petroleum Resources Limited had the potential to emit average of 3.21 × 10¹² tons of toluene, 2.44 × 10¹² tons of ethylbenzene and 5.99 × 10¹¹ xylene annually; Rehoboth Natural Resources had capacity for annual average emission of 7.01 × 10¹¹ tons of toluene, 5.31 × 10¹¹ ethylbenzene and 1.29 × 10¹¹ tons of xylene, while Union Atlantic Petroleum Refinery has potential for the annual average emission of 5.85 × 10¹² tons of toluene, 4.44 × 10¹² tons of ethylbenzene and 1.08 × 10¹² tons of xylene. illustrates the estimated emission rates of toluene, ethylbenzene and xylene from each of the twenty-two proposed petroleum refineries.
Figure 3. Total TEX emission rate from each of the proposed refineries
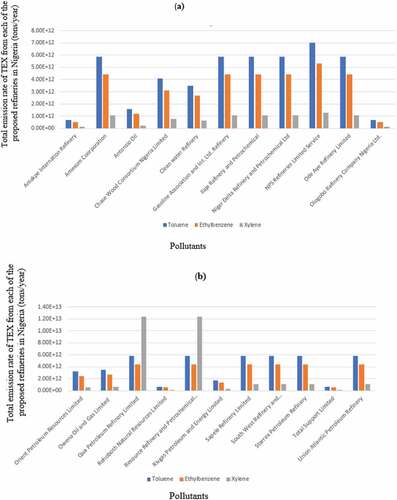
From the proposed refineries, when fully operational, NPS Refineries Service Limited was projected to be the highest annual emitter of toluene (7.01 x10¹² tons/year). The lowest concentration was projected to come from each of Rehoboth Natural Resources Limited and Total Support Limited. Similarly, NPS would have the potential of releasing about 5.31 × 10¹² ethylbenzene to the ambient air; Amakpe International Refinery, Rehoboth Natural Resources Limited and Total Support Limited have potential of emitting 5.31 × 10¹¹ tons/year each into the atmosphere. Each of Qual Petroleum Refinery Limited and Resources Refinery and Petrochemical Limited would have the capacity to release the highest concentration of about 1.24 × 10¹³ tons/ year of xylene into the ambient air, while each of Amakpe International Refinery, Ologobo Refinery Company Nigeria Limited, Rehoboth Natural Resources Limited and Total Support Limited was expected to emit lowest concentration of 1.29 × 10¹¹ tons/ year.
It was estimated that each of Resources Refinery and Petrochemical Limited and Qua Petroleum Refinery has the potential of releasing 2.27 × 10¹³ tons of TEX per year, followed by NSP Refineries and Oil Services Limited which is projected to be capable of releasing 1.36 × 10 13 annually. Total support Limited with the proposed capacity of 12,000 bbl/day (4,380,000 bbl/yr) is release a minimum emission of 1.36 × 10¹² tons of TEX per year. Total anticipated TEX emission from the twenty-two proposed refineries stood at 2.01 × 10¹⁴ tons/year. Comparatively, the concentrations reported in this study were much higher than the reported TEX levels in some of the previous studies (Cerón-Bretón et al., Citation2014; Iovino et al., Citation2007; Kerchich & Kerbachi, Citation2012; Rad et al., Citation2014). Similarly, several authors have documented a much lower concentration of TEX compounds in the atmosphere of different regions (Baltrėnas et al., Citation2011; Esmaelnejad et al., Citation2015; Esteve-Turrillas et al., Citation2007). For instance, Sergio et al. (Citation2012) reported mean concentration of 47.7 µg/m3 for toluene, 23.3 µg/m3 for ethylbenzene and 61.3 µg/m3 for xylene from gas station while similar study by Mehrjerdi et al. (Citation2014) reported average concentrations of toluene, ethylbenzene and xylene as 148, 667 and 216 µg/m3, respectively. The lower concentrations of TEX compounds in the previous studies could be attributed to the emission sources. While the documented studies focused on emissions from fuel stations, the focus of this study was on emissions from refineries where higher concentration is expected. It could also be due to the level of implementation of mitigating measures put in place in the respective nations where the studies were conducted. While the reported studies were carried out in developed nations where there are strict regulations against environmental pollutions, this study was carried out in developing nation where air pollution regulations are more relaxed. Despite, their effects on human health, in Nigeria, there is no regulation that controls the release of these pollutants into the ambient air. A worst scenario case adopted in this study could also be responsible for the elevated concentrations of these pollutants. It would be expected that under adequate control strategy, much lower concentration could be recorded. Apart from this, emission sources being focused in this study differed from the pollution sources assed by previous studies. While this study estimated emission from refinery; many of the previous studies focused on the estimation of the concentrations of these pollutants from other manufacturing industries and vehicular and manufacturing industries sources. It has been reported that toluene, ethylbenzene and xylene concentrations present in refineries are generally higher than typical outdoor air levels (Pourfarzi et al., Citation2016). The difference in TEX levels reported in different cities around the world can be attributed to differences in fuel quality and their BTEX content, traffic, variety of industries, different atmospheric conditions, and topography, among other factors
These variations observed from one refinery to the other in this study could be associated to the level of the release of these pollutants from the identified sources (units) from each refinery. Also, since emission rate is proportional to the installed capacity, the variation could also be explained in terms of different capacity of the individual refineries which is consequential on the amount of these pollutants being released. The most affected state with possibility of highest exposure to TEX is Rivers State which hosts six refineries (existing and four proposed), followed by Akwa Ibom with four proposed refineries while other states with one refinery each are least affected by TEX emission. Calculated ambient TEX concentrations of the criteria pollutants emitted by the proposed and existing refineries revealed toluene and xylene as being the highest and lowest respectively. Accumulation of TEX in the atmosphere is thought to be a function of their atmospheric lifetime and this is considered to favour toluene which is a comparatively less reactive species (due to its longer atmospheric lifetime). It has been reported that the atmospheric lifetime of toluene, ethyl benzene, m-xylene, p-xylene, o-xylene are 1.9 days, 1.6 days, 11.8 hr, 19.4 hr and 20.3 hr respectively (Monod et al., Citation2001). The implication is that there will be continuous accumulation of toluene and ethyl benzene in the airshed of the refineries host states due to their longer lifetime. Effects of closeness to petroleum refineries on ambient concentrations of benzene, toluene, ethyl benzene and xylene have been reported by (Na et al., Citation2001) and it is expected that ambient concentration of these pollutants will decrease as the emissions from petroleum industries reduce (Kajihara et al., Citation2003).
Apart from the fact that, the present measures to combat the release of these pollutants into the atmosphere are considered inadequate, it is also projected that the growth rate in petroleum refining capacity in Nigeria would increase in the future which would amount to increase in the levels of pollutants being emitted from the refining operation. It is therefore extremely important to map out more stringent regulatory and technologically driven measures that can be applied, with acceptable level of capital investment to bring about absolute reduction in the emission of pollutants to the environment from refineries. Some of the measures may include introduction of basically new refining processes, improved units and equipment, and advanced methods for organizing production (Damian, Citation2013), improvement in the crude oil pretreatment method before processing, the use of larger tank for storage of crude oil and petroleum products, with the installation of floating roofs. Also, avoidance of leakages and cracks from valves, pipes and tanks must be ensured; discharge of pressure relief valves into treatment equipment should be put in place and the effect of the construction of combination of units for several processes in a single process block should not be underestimated (Damian, Citation2013). Deployment of Internet of Thing (IoT) solution could also be helpful in air emission monitoring and abatement process. Several IoT devices and attached sensors are mounted at the refineries, periodically collect emission data from the facilities and send the data to IoT cloud. This can help Environmental Protection Agency to identify pollution hotspots; shape and develop policy and decision making as well as enhancing transparency in sharing air quality data. On the overall, government agencies responsible for environmental issues must not only enact laws that prohibit emission of pollutants above threshold limits, compliance with the laws guidelines and regulation must be enforced even on refining operators.
4. Conclusion
Total emission of toluene, ethyl benzene and xylene (TEX) from Nigerian twenty-six (four existing and twenty-two proposed) refineries were estimated using emission factor approach. Results showed that the four existing refineries emitted a total of 2.90 × 10¹³ tons of Toluene, 1.93 × 10¹³ tons Ethyl benzene and 1.06 × 10¹³ tons of xylene per year while the twenty-two proposed refineries have the capacity of releasing 9.17 × 10¹³ tons of Toluene, 6.96 × 10¹³ tons of Ethyl benzene and 3.95 × 10¹³ tons of Xylene annually. When operated at full capacity, the total estimated TEX emission from the existing refineries stood at 5.89 × 10¹³ tons/year apart from additional 2.01 × 10¹⁴ tons/year anticipated from the twenty-two proposed refineries. This implies that 2.27 × 10¹⁴ tons of TEX will be released into Nigerian airshed yearly from petroleum refineries. This is thought to be of great magnitude and the consequence could be devastating on ambient air quality of the host communities. Implementation of control measures for the abatement of this emission is therefore advocated.
Cover Image
Source: Author.

Additional information
Funding
Notes on contributors

Bamidele Sunday Fakinle
E. L. Odekanle is an Environmental Specialist who works in the university while J. A. Sonibare and O. T. Akande are research collaborators from Obafemi Awolowo University and Northumbria University respectively.
A. T. Olayanju, C. O. Aremu, B. S. Fakinle, R. O. Ogumdokun and C. B. Bakut all belong to the Sustainable development goals 9 and 13 (Industry, Innovation and Infrastructure and Climate action) research group at Landmark University.
References
- Baltrėnas, P., Baltrėnaitė, E., & Serevičienė., Pereira., P. (2011). Atmospheric BTEX concentrations in the vicinity of the crude oil refinery of the Baltic region. Environmental Monitoring and Assessment, 182(1–4), 115–22. https://doi.org/10.1007/s10661-010-1862-0
- Beckett, K. P., Freer-Smith, P. H., & Taylor, G. (1998). Urban woodlands: Their role in reducing the effects of particulate pollution. Environmental Pollution, 99(3), 347–360. https://doi.org/10.1016/S0269-7491(98)00016-5
- Bozlaker, A., Buzcu-Güven, B., Fraser, M. P., & Chellam, S. (2013). Insights into PM10 sources in Houston, Texas: Role of petroleum refineries in enriching lanthanoid metals during episodic emission events. Atmospheric Environment, 69:, 109–117. https://doi.org/10.1016/j.atmosenv.2012.11.068
- Brauer, M., Hoek, G., Smit, H. A., de Jongste, J. C., Gerritsen, J., Postma, D. S., Kerkhof, M., & Brunekreef, B. (2007). Air pollution and development of asthma, allergy and infections in a birth cohort. European Respiratory Journal, 29(5), 879–888. https://doi.org/10.1183/09031936.00083406
- Cerón-Bretón, J. G., Cerón-Bretón, R. M., & Kahl, J. D. (2014). Diurnal and seasonal variation of BTEX in the air of Monterrey, Mexico: Preliminary study of sources and photochemical ozone pollution. Journal of Air Quality, Atmosphere and Health, 1–14. https://doi.org/10.1007/s11869-014-0296-1
- Damian, C. (2013). Environmental pollution in the petroleum refining industry. Versita, 2:(109–114). https://doi.org/10.2478/auoc-2013-0018
- Department of Petroleum Resource (DPR). (2001). Nigeria Oil Industry Statistical Bulletin. Department of Petroleum Resources, Ministry of Petroleum Resources.
- Department of Petroleum Resource DPR. (2004). Nigeria oil industry statistical bulletin. Department of Petroleum Resources, Ministry of Petroleum Resources.
- Department of Petroleum Resource DPR. (2010). Nigeria oil industry statistical bulletin. Department of Petroleum Resources, Ministry of Petroleum Resources.
- Edokpolo, B., Qiming, J. Y., & Connell, D. (2014). Health risk assessment of ambient air concentrations of Benzene, toluene and xylene (btx) in service station environments. International Journal of Environmental Research and Public Health, 11(6), 6354–6374. https://doi.org/10.3390/ijerph110606354
- Esmaelnejad, F., Hajizadeh, Y., Pourzamani, H., & Amin, M. M. (2015). Monitoring of benzene, toluene, ethyl benzene, and xylene isomers emission from Shahreza gas stations in 2013. International Journal of Environmental Health Engineering, 4, 1–8. DOI: 10.4103/2277-9183.157716
- Esteve-Turrillas, F. A., de la Guardia. M, P. R. A., & de la Guardia, M. (2007). Assessing air quality inside vehicles and at filling stations by monitoring benzene, toluene, ethylbenzene and xylenes with the use of semipermeable devices. Analytica Chimica Acta, 593(1), 108–116. https://doi.org/10.1016/j.aca.2007.04.055
- Fakinle, B. S., Adesanmi, A. J., Olalekan, A. P., Alagbe, A. A., Odekanle., E. L., & Sonibare, J. A. (2017). Changes in evaporative emissions from gasoline in the Nigeria market. Petroleum Science and Technology, 3(10), 1040–1046. https://doi.org/10.1080/10916466.2017.1305405
- Fakinle, B. S., Olalekan, A. P., Odekanle, E. L., Bakut, C. B., Ogundokun, R. O., Sonibare, J. A., Aremu, C. O., & Arellano-Garcia, H. (2021). Assessment of the contribution of hazardous air pollutants from Nigeria’s petroleum refineries to ambient air quality. Part 1. Cogent Engineering, 8(1), 1870792. https://doi.org/10.1080/23311916.2020.1870792
- Iovino, P., Salvestrini, S., & Capasso, S. (2007). Background atmospheric levels of BTEX in a medium-sized city and surrounding area in Southern Italy. Journal of Air Pollution, 86, 611–618. https://doi.org/10.2495/AIR060601
- Kajihara, H., Fushimi, A., & Nakanishi, J. (2003). Verification of the effect on risk due to reduction of benzene discharge. Chemosphere, 53(4), 285–290. https://doi.org/10.1016/S0045-6535(03)00014-6
- Kerchich, Y., & Kerbachi, R. (2012). Measurement of BTEX (benzene, toluene, ethylbenzene, and xylene) levels at urban and semirural areas of Algiers City using passive air samplers. A&WMA, 62, 1370–1379. https://doi.org/10.1080/10962247.2012.712606
- Magaji, J. Y., & Hassan, S. M. (2015). An Assessment of Air Quality in and around Gwagwalada Abattoir, Gwagwalada, Abuja, Fct. Journal of Environment and Earth Science, 5, 87–92.
- McConnell, R., Islam, T., Shankardass, K., Jerrett, M., Lurmann, F., Gilliland, F., Gauderman, J., Avol, E., Künzli, N., Yao, L., Peters, J., & Berhane, K. (2010). Childhood incident Asthma and traffic-related air pollution at home and school. Environmetal Health Perspect, 118:(1021–6). https://doi.org/10.1289/ehp.0901232
- Mehrjerdi, M. H., Tahmasebi, N., Abadi, A. B., Fallahzadeh, H., Esmaielian, S., and Soltanizadeh, K. (2014). The investigation of exposure to benzene, toluene, ethylbenzene and xylene (BTEX) with Solid Phase Microextraction Method in gas station in Yazd province. Iran South Med J (Res), 16(6), 419–427
- Mohammadi, A., Ghassoun, Y., Löwner., M.-O., Behmanesh., M., Faraj., M., Nemati., S., Toolabi., A., Abdolahnejad., A., Panahi., H., Heydari., H., & Miri., M. (2020). Spatial analysis and risk assessment of BTEX compounds in Urmia, Iran. Chemosphere, 246, 125769. https://doi.org/10.1016/j.chemosphere.2019.125769
- Mojarrad, H., Fard, R. F., Rezaali, M., Heidari, H., Izanloo, H., Mohammadbeigi, A., Mohammadi, A., & Sorooshian, A. (2020). Spatial trends, health risk assessment and ozone formation potential linked to BTEX. Human and Ecological Risk Assessment, 26(10), 2836–2857. https://doi.org/10.1080/10807039.2019.1688640
- Mokhtari, M., Hajizadeh, Y., Mohammadi, A., Miri, M., Abdollahnejad, A., & Niknazar, H. (2016). Ambient Variations of Benzene and Toluene in Yazd, Iran, Using Geographic Information System. Journal of Mazandaran University of Medical Sciences, 26, 131–139.
- Monod, A., Sive, B. C., Avino, P., Chen, T., Blake, D. R., & Sherwood, R., . F. (2001). Monoaromatic compounds in ambient air of various cities: A focus on correlations between the xylenes and ethylbenzene. Atmospheric Environment, 35(1), 135–149. https://doi.org/10.1016/S1352-2310(00)00274-0
- Moslem, A. R., Rezaei, H., Miri. M, Y. S., & Miri, M. (2020). Comparing BTEX concentration related to surgical smoke in different operating rooms. Ecotoxicology and Environmental Safety, 203(15), 111027. https://doi.org/10.1016/j.ecoenv.2020.111027
- Mulenga, D., & Siziya, S. (2019). Indoor air pollution related respiratory III health, a sequel of biomass use. SciMedicine Journal, 1(1), 30–37. http://dx.doi.org/10.28991/SciMedJ-2019-0101-5
- Na, K., Kim, Y. P., Moon, I., Moon, K. C., & Fung, K. (2001). Concentrations of volatile organic compounds in an industrial area of Korea. Atmospheric Environment, 35(15), 2747–2756. https://doi.org/10.1016/S1352-2310(00)00313-7
- Odekanle, E. L., Fakinle, B. S., Akeredolu, F. A., Sonibare, J. A., & Adesanmi, A. J. (2016). Personal exposures to particulate matter in various modes of transport in Lagos city, Nigeria. Cogent Environmental Science, 2(1), 1260857. https://doi.org/10.1080/23311843.2016.1260857
- Odekanle, E. L., Fakinle, B. S. J., Okedere, L. A., Sonibare, J.A, O. B., . A. F. A., Akeredolu, F. A., & Sonibare, J. A. (2017). In-vehicle and pedestrian exposure to carbon monoxide and volatile organic compounds in a mega city. Urban Climate, 21:(173–182), 173–182. https://doi.org/10.1016/j.uclim.2017.06.004
- Pope, C. A., Young, B., & Dockery, D. W. (2006). Health effects of fine particulate air pollution: Lines that connect. Journal of the Air & Waste Management Association, 56:(709–742), 709–742. https://doi.org/10.1080/10473289.2006.10464485
- Pourfarzi, F., Hazrati, S., & Hazrati, S. (2016). Benzene, toluene, ethylbenzene and xylene concentrations in atmospheric ambient air of gasoline and CNG refueling stations. Air Quality, Atmosphere & Health, 9(4), 403–409. https://doi.org/10.1007/s11869-015-0349-0
- Rad, H. D., Babaei, A., Gourdarzi, G., Angali, K. A., Ramezani, Z., & Mohammadi, M. (2014). Levels and sources of BTEX in ambient air of Ahvaz metropolitan city. Air Quality, Atmosphere & Health, 7(4), 515–524. https://doi.org/10.1007/s11869-014-0254-y
- Rafaja, P., Kiesewettera, G., Gülb, T., Schöppa, W., Cofalaa, J., Klimonta, Z., Purohita, P., Heyesa, C., Amanna, M., Borken-Kleefelda, J., & Cozzib, L. (2018). Outlook for clean air in the context of sustainable development goals. Global Environmental Change, 53, 1–11. https://doi.org/10.1016/j.gloenvcha.2018.08.008
- RTI: Research Triangle Institute (2015). Emission estimation protocol for petroleum. refineries.https://www3.epa.gov/ttn/chief/efpac/protocol/ProtocolReport. Accessed on June 20, 2019
- Sergio, M. C., Graciela, A., Monica, R. C., & Katia, M. P. (2012). The impact of BTEX emissions from gas stations into the atmosphere. Atmospheric Pollution Research, 3(2), 163–169. https://doi.org/10.5094/APR.2012.016
- Shukla, J. B., Misra, A. K., Shyam, S., & Ram, N. (2008). Effect of rain on removal of a gaseous pollutant and two different particulate matters from the atmosphere of a city. Mathematical and Computer Modelling, 48(5–6), 832–844. https://doi.org/10.1016/j.mcm.2007.10.016
- Tehrani, A. M., Bahrami, A., Leili, A., Poorolajal, J., Zafari, D., Samadi, M., & Mahri, A. (2020). Investigation of seasonal variation of probalistic risk assessment of BTEX emission in municipal solid waste transfer station. Int. Journal of Environmental and Analytical Chemistry. https://doi.org/10.1080/03067319.2020.1814269
- Tiwari, V., Hanai, Y., & Masunaga, S. (2010). Ambient levels of volatile organic compounds in the vicinity of petrochemical industrial area of Yokohama, Japan. Air Quality, Atmosphere & Health, 3(2), 65–75. https://doi.org/10.1007/s11869-009-0052-0
- U.S. Department of Energy (DoE) (2007). Energy and Environmental Profile of the U.S. Petroleum Refining Industry. Office of Industrial Technologies, Available online at. http://www.oit.doe.gov/petroleum/pdfs/profile.pdf. Accessed on December 23, 2019
- WHO. (2005). Health effects of transport-related air pollution.