
 ?Mathematical formulae have been encoded as MathML and are displayed in this HTML version using MathJax in order to improve their display. Uncheck the box to turn MathJax off. This feature requires Javascript. Click on a formula to zoom.
Abstract
The experimental study presents an improved thermal analysis performance for the conventional unglazed transpired collector (UTC). Decreasing radiation and convection heat transfer loss to the environment and increasing heat transfer coefficient of the passing air with, first: Adding fifteen-wire mesh layers as an alternative of the perforated absorbing plate. The porous media, with a cross-sectional area of 2.2 mm× 2.2 mm and an internal diameter of 4.11 mm, located in the plenum channel of the collector to enlarge the absorbing heat area and heat transfer coefficient. Second: Fixed a 3 mm thickness of galvanized plat above the wire mesh layers for decreasing the heat loss from the unglazed solar collector to the environment. The relation of the inlet temperature, solar intensity, and the temperature difference, with a time of day, was indicated for air velocity from 2 m/s to 7 m/s. The results showed that thermal efficiency improved by increasing the airflow rate and the maximum thermal efficiency of 63.3% for seven m/s. However, the temperature difference (ΔT) was increased to a maximum value of 31.6°C, at air velocity decreased to 2 m/s. The thermal efficiency increased as the temperature parameter (Ti-Ta)/I reduced. When temperature parameter (Ti-Ta)/I, increased high heat loss was made. Also, there was a good agreement between the outlet temperature experimental results and the theoretical model’s prediction.
PUBLIC INTEREST STATEMENT
Heating air with solar collectors is much cleaner than heating air with fossil fuel as well as cheaper than electrical heating. The delivered air from a solar collector can be used in various applications including heating of buildings and drying of agricultural products: Fruits, grapes, apricot and vegetables. Over the past decades, it has been recognized that the consumption of fossil fuels affects the environment negatively causing global warming and adverse impacts on the Earth due to the increase in the amount of carbon dioxide gas. Unglazed Transpired Collector (UTC), investigated in this article, is an efficient type of a solar energy technology that is used in many applications especially in drying agricultural products and as an auxiliary heater in buildings to reduce fossil fuel consumption.
1. Introduction
Heating air with solar collectors is much cleaner than heating air with fossil fuel and cheaper than electrical heating. The delivered air from the solar system can be used for various applications such as auxiliary heaters in constructions during winter or drying agricultural products: Fruits, grapes, apricot, and vegetables.
Over the past decades, the consumption of fossil energy caused an effect on global warming. This phenomenon raised researchers’ attention as a significant global issue. The continuing consumption of fossil fuels leads to increased global warming and adverse impacts of the Earth on the increase in the amount of carbon dioxide gas. Unglazed Transpired Collector (UTC) is a kind of new solar energy technologies used in various industries such as drying agricultural products and as auxiliary heaters in buildings to reduce fossil fuel consumption polluting gases for the Earth’s atmosphere (Kutscher et al., Citation1993). The conventional design of an unglazed transpired collector (UTC) consists of a duct made of aluminium or galvanized steel. The duct’s topside was a perforated plate, which worked as an absorber plate so that ambient air continuously withdrawn through the perforations. All the duct sides are painted black and fixed to face the sun (Naveed et al., Citation2006). Due to low pressure from the air intake fan, hot air distributed throughout the building. When air suction occurs through perforated plates, the loss of heat to the environment significantly made, cause of the outer glass cover to set. Several studies have conducted to calculate the amount of heat loss in the (UTC) collectors. (Kutscher et al., Citation1993) have studied the amount of heat loss and the efficiency of the flat solar system (UTC), and they conclude that the heat loss due to the wind and natural convection to the outside. (Hollick, Citation1994) mentioned in his research a summary of different solar systems (UTCs); their experimental results show the effect of suction velocities on thermal efficiencies. (Kutscher, Citation1994) replaced circular holes with triangular holes for the perforated absorber plate (low porosity plate), the air pressure drop, and heat exchange effectiveness correlations. (Summers, Citation1995) presented the measurements of heat exchange effectiveness of the perforated plate with circular, triangular, and square holes, extending a range of wind speeds covering 0 to 5 m/s. A suitable explanation of the pitch measure is helpful for plates laid out with square and triangular hole placements. Flow distribution utilizing a commercial computational for dynamic flow cod of large solar systems by researcher (Gunnewiek et al., Citation1996) done; they presented graphs showing thermal changes in large-area of (UTC) systems. The researchers (Dymond & Kutscher, Citation1997) considered the airflow distribution through (UTC) using pipe network analysis. They summarized their work that this model runs faster than a commercial computational fluid dynamic code on the computer.
Some researcher added porous media or wire mesh layers instead of absorber plate to increase the absorber porosity by more than 80%. Thus, the heat transfers and thermal efficiencies are increased. To decrease the heat loss to the environment, a glazed collector was used—the study of (Aldabbagh et al., Citation2010), using a glazed collector with wire mesh layers. Perforated Plexiglas cover is used with wire mesh layers by (Nowzari et al., Citation2014). (Sözen et al., Citation2020), (Sözena et al., Citation2021) utilized various processes of space heating in two studies. The first heater was a hollow tube-type heater with the properties of iron meshes added in the flow channel to extend its heat transfer surface area (Sözen et al., Citation2020). The Second heater of aluminium meshes has been added into the tubes to raise the system’s thermal efficiency (Sözena et al., Citation2021).
Other results, such as the plate’s temperature and suction velocity profile for a sizeable perforated plate, were presented. (Van Decker et al., Citation2001) predicted a heat exchanger’s efficiency in (UTC) with a pattern of square holes. They calculated the heat exchanger’s efficiency in three areas: First, the front side of the plate, Second hole area, Third, the back of the perforated plate. (Gawlik & Kutscher, Citation2002) studied experimentally and numerically the heat loss by convection between corrugated absorber plat and the wind; they found the correlation for convection heat loss in the airflow on the wave surface of the plate such as separated flow and attached flow. (Gawlik et al., Citation2005) studied the low thermal conductivity of air in the solar system experimentally and numerically. They concluded that physical conductivity had little effect on the thermal performance of the system. A mathematical model predicts the solar system’s thermal performance, which was developed by researchers (Leon & Kumar, Citation2007). They have performed situation studies to change some factors such as air suction velocity and solar radiation. The airflow distribution on the corrugated absorber plate for the (UTC) solar system studied by (Greig et al., Citation2012) detected a high turbulence airflow even at the low Reynolds number causes the UTC fixed on the surface of building and surface body immersed in the atmospheric boundary layer. Hence, the passing airflow is highly turbulent (Li et al., Citation2013). The consideration of the thermal efficiency and outlet temperature indicated (Badache et al., Citation2013). They found the essential parameters that affected the thermal performance of (UTC) are absorber plate and airflow rate. Perforated absorber sheets represented as a porous metal plate (corrugated or flat), generally, with a porosity between (0.5–2 %), the porosity (σ) can be defined as, where the porosity depended on pitch value. Although previous research has reduced the pitch scale to improve thermal efficiency, they have not reached 5%, and this low porosity will create intricate airflow patterns (Incropera & De Witt, Citation1985).
The idea of the current study is using wire mesh layers with porosity of 87% instead of perforated plat that does not reach more than 5% in porosity. The high porosity increases the passing air velocity; thus, the heat transfer coefficient and the thermal performance are improved. In previous studies, the increase in porosity of the perforated plate was done by changing the circular holes to triangular holes or by decreasing the pitch of the holes, nevertheless porosity of more than 5 % was not achieved (Incropera & De Witt, Citation1985). Furthermore, the use of solid cover with opening inlet air area of 20 cm2 aimed at decreasing the convection heat loss of the wire mesh layers and forcing the inlet air to completely pass through the mesh layers.
2. System description
Unglazed solar collector considered to transfer sunlight as heat into passing air through the channels, then channels in your house or building, warmed there to cozier temperatures. For this work, the perforated absorber plate replaced by 15 wire mesh layers, the cost of the unglazed heater is reduced significantly. This unglazed solar system worked with your heating system as a simplistic to help heat your things more effectively and cut your utility cost. It’s easy; it’s simple; it’s an effective way to fresh air improved and decrease resource consumption of CO2 emissions.
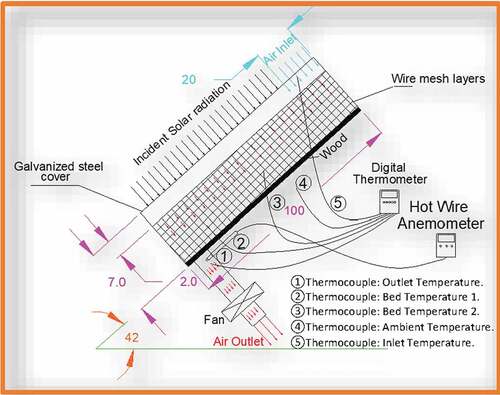
The unglazed solar system commonly used for heating space and building ventilation. The experimental work of the (UTC) is constructed and tested in Baghdad- Iraq, a zone of (33.3152 °N, 44.3661 °E), the surface of the collector mounted to the south way at the slop of 42° with the horizon, to allow sun rays falls on the collector surface from morning 8.00 am to 4.00 pm at evening. For increasing the heat transfer rate between passing air in the plenum channel and radiation sun’s, the (UTC) designed by adding First; (Fifteen wire mesh layers placed between the cover plate and back bed, all mesh layers’ parallel to cover plat, 2 cm the distance between first mesh layer and cover). Second, (Galvanized solid plate 3 mm thickness fixed, as a metal cover on the collector). Thus, the improvement of the outlet temperature and thermal efficiency of the (UTC) made. All the collector components, such as galvanized cover and wire mesh layers painted black to concentrate the solar radiation. At the collector’s end, a blower was employed to suck air from the opening area of 0.2 m2 upper of the cover plate through the wire mesh layers. The blower used to enter the required airflow rate (velocity of 2 to 7 m/s). The rectangular collector, area of 1.5 m × 1 m, high of 7 cm constructed to improve the thermal energy and heat transfer. shows the (UTC) scheme: 1.3 m2 area of solid galvanized absorbing cover; the space between the solid galvanized surface and the wire mesh layers was 2 cm, where the distance between the covered galvanized plate and back bed was 7 cm. The wire mesh layers (2.2 × 2.2) mm2 square voids area have absorptivity of 0.96 and 0.87 porosity, adding wire mesh layers to increase the absorbing size. Therefore, the air passing through the voids, the non-uniform flow is done, the heat transfers between wire mesh layers and passing air were increased (Mahmood, Citation2019; Nowzari et al., Citation2014). The passing air velocity increased from 2 m/s to 7 m/s; this was controlled by an inverter model of 0.01–400 Hz, 5A, SV008iC5-1. A Hot Wire Anemometer model of 60–90 mA/ HT-9829, (more details and descriptions can be found in ), was calibrated and fixed at the outlet air section () for measuring air velocities. An EXTECH, 5-channel thermometer, model SDL200, an accuracy of ± (0.4 % + 0.5°C), with five thermocouples (T-type) used for measuring temperature in five points, two thermocouples used for measuring temperatures inside (UTC) (Bed temperature 1, and Bed temperature 2. The three thermocouples used for measuring inlet temperature, outlet temperature and ambient temperature, with a thermocouple hanged under the collector. The solar intensity registered from the morning from 8.00 am to 5.00 pm by using a Pyranometer, which placed upper and close to the solar heater.
Figure 1. Assembly schematic of the unglazed solar collector (all dimensions in cm)
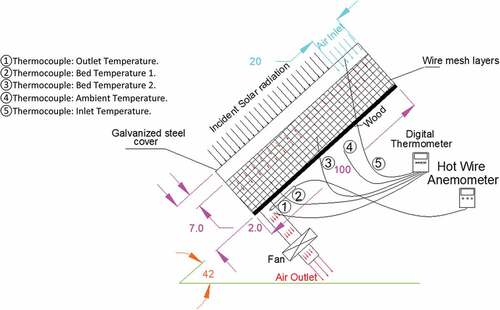
Table 1. The description of the equipment used during the work
3. Transpired collector analysis
3.1. Thermal efficiency of the solar collector
The first law of thermodynamic applied for evaluating the thermal efficiency of the unglazed solar system. Thermal efficiency can be defined as the useful energy gain to receive energy where the useful energy was defined as thermal energy and receives energy as heat flux or solar radiation energy.
Where: Received energy and useful energy gain in (W), ṁ is the airflow rate (m/s), Cp is the specific heat of the air (kJ/kg. K), Ac is the collector area in (m2), To is the outlet air temperature (oC) and Ti is the inlet air temperature (oC) (Badache et al., Citation2012; Gholampour & Ameri, Citation2014; Mahmood, Citation2019; Vaziri et al., Citation2015; Zheng et al., Citation2017).
EquationEquation 22
2 can be simplified to:
It’s clear from Equationeq. 33
3 , there is a linear relationship between η and
, the positive slope has given with
.
From energy balance equation as (Badache et al., Citation2012):
where FR is the collector heat removal factor and R is the conversion factor of heat system:
The performance of flat plate solar collectors can be successfully described EquationEq.44
4 . Thermal efficiency and heat removal coefficient (FR) have been solved as shown (Gholampour & Ameri, Citation2014):
where () is the instantaneous efficiency, (FR) is the collector heat removal factor which depending on the actual useful energy gain and the useful energy gain, when the collector surface at the inlet air temperature. (UL) is the overall heat loss coefficient in W/ (m2. K), and (τα) is the effective transmittance absorbance product, the EquationEq. (5)
5
5 gives a linear relationship between and
, but a negative slope of
and the origin order at FR (τα).
4. Results and discussion
4.1. Solar intensity and inlet temperature
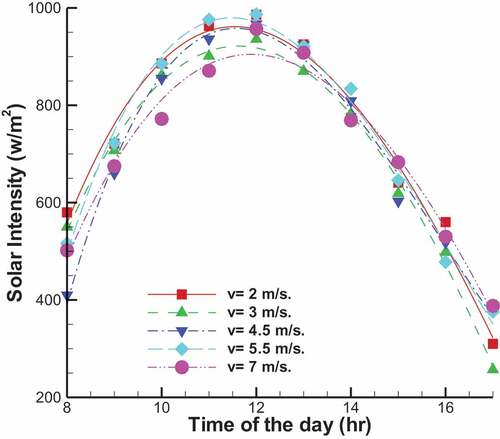
The daily values of ambient air temperature and solar intensity are registered every hour; Five experimental days’ work took five different air velocities contently. The solar intensity curves with time are shown in . The curves followed a similar arrangement for all days of the work. The solar intensity value is increased from sunshine until midday. The maximum curve point at noon then slowly decreased till sunset; the solar intensity curves for all experiment days were close to each other. The maximum values of the solar intensity are indicated to be between 927 W/m2 to 983 W/m2. The highest value of the inlet temperature and solar radiation was between 12:00 am to 1:00 pm o’clock in the afternoon, and this result corresponds to the studies; (Nowzari et al., Citation2014) indicated that the highest solar intensity 1092 W/m2 was also measured at noon, while (Vaziri et al., Citation2015) recorded the maximum value of solar intensity was 914.2857 W/m2 at 12:30 pm.
Figure 2. Solar intensity versus time of the day for UTC, during testing having, opening cover plate area of 0.2 m2
The relation of inlet temperature Ti and time from morning to the evening for five days is shown in . Ti peak value of inlet temperatures between 41.8°C and 39.8°C for five days of the work. Ambient temperatures are taken beside registered the inlet air temperature. The five curves of inlet temperatures and solar intensity in and seem closed to each other cause of the clear sky and stable wind speed. The Uncertainty (ω) and the average values of inlet temperature, ambient temperature, and solar intensity values are shown in .
Figure 3. Inlet temperature versus time of the day for opening cover plate area of 0.2 m2
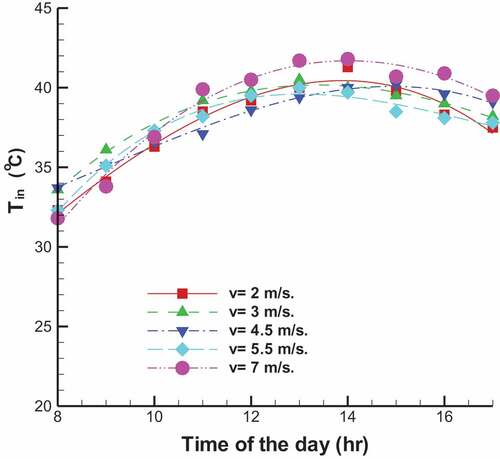
Table 2. Shows the uncertainty (ω), the average values of the inlet temperature, ambient temperature, and solar intensity values
The uncertainty analysis is conducted of an experimental result (Aldabbagh et al., Citation2010; Vaziri et al., Citation2015):
4.2. Temperature differences between the outlet and inlet temperatures ∆T
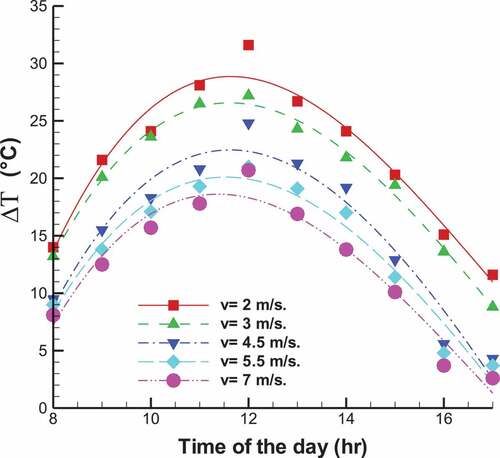
The temperature differences (Outlet temperature—Inlet temperature) with an opening cover plate area of 0.2 m2 are shown in . For all velocity values, the temperature difference (ΔT = To—Ti), curves shape was symmetrical with the solar radiation curves. The ΔT results increased a morning at 8.00 am of 14°C, to noon at 5:00 pm of 12°C (at the end of the day). From morning to noon, the temperature differences increased slowly to maximum temperature at noon, and afternoon ΔT gradually decreased to the end of the day at 5:00 pm. shows the maximum values of ΔT 31.6°C are done at noon for the solar intensity of 877 W/m2, air velocity of 2 m/s. Increasing the airflow velocity from 2–7 m/s through the collector observed that the ΔT decreased. When the air velocity is reduced, the moving time of passing fluid through the collector decreased, thus more absorption heat is added. The UTCs model for previous research as shown in the introduction, (Hollick, Citation1994), (Gholampour & Ameri, Citation2014) and (Summers, Citation1995), fully opening perforated plate is done, their results of temperature difference, ΔT (6 to 16 °C), (7 to 18 °C) and (4 to 16°C), respectively, for air velocity 0.035 m/s and solar intensity from 300 to 1000 W/m2.
Figure 4. Temperature difference versus time of the day at different for the collector opening perforated plate area of 0.2 m2
4.3. Thermal efficiency (η)
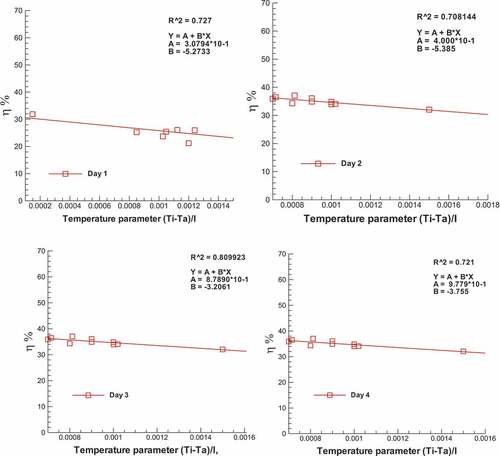
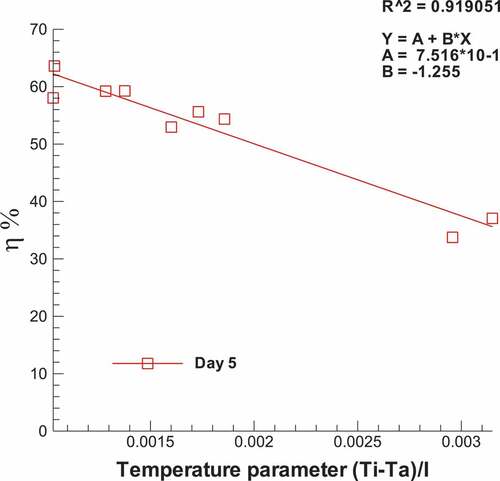
4.3.1. Thermal efficiency with temperature parameter (Ti-Ta)/I
From EquationEq. 44
4 , the efficiency plotted against the temperature parameter (Ti-Ta)/I, straight-line has done, where the slope is indicative of (UL), and the y-intercept is indicative of (τα). In fact, the (UL) isnt a constant, it is a function of the ambient temperature and the collector’s outlet temperature. presents the instantaneous thermal efficiency (ηi) of the collector versus (Ti—Ta)/I for different air velocities. The maximum efficiency gained 63.6%, for air velocity 7 m/s (day 5), with the negative linear fit behaviour slope B = −1.1255 and a correlation coefficient R2 = 0.919. The thermal efficiency decreased as the temperature parameter (Ti-Ta)/I increased. When temperature parameter (Ti-Ta)/I increased, high heat loss is made from the upper cover to the environment, therefore thermal efficiency reduced.
Figure 5. Variation of UTC instantaneous efficiencies with a temperature parameter
The obtained empirical expression:
Replacing the slope by B and the origin by A, we obtain.
The calculation for EquationEq. (7)7
7 and (Equation3
3
3 ), the expression results for (To) as a function of the ambient temperature (Ta) and inlet air temperature (Ti):
where the variable λ is defined as:
Replacing in EquationEq. (8)8
8 the values of B, A and λ, the model for UTC is:
If the ambient temperature was the same inlet temperature (Ta = Ti), then EquationEq. (10)10
10 given as:
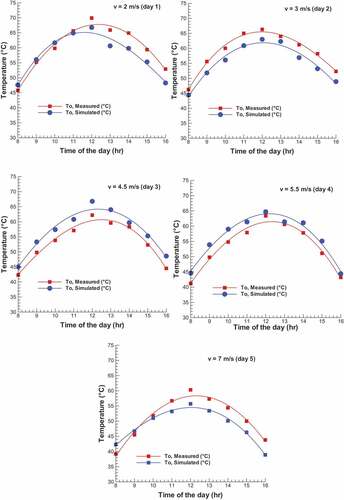
shows the experimental measure of outlet air temperature (To) and predicted outlet air temperature (To, Simulated), as calculated by EquationEq. (10)10
10 for five days’ work. There was a validation of the work conditions for the unglazed solar collector. The maximum different value between predicted data and experimented 5°C, for all days of work. A good agreement was made between simulated work and experimental work.
Figure 6. Experimented measured outlet temperature and predicted outlet air temperature
In general, the rise in the outlet temperature depends on the value of solar radiation and the amount of heat loss to the atmosphere, as indicated by the researchers (Gawlik & Kutscher, Citation2002), (Li et al., Citation2013) and (Zheng et al., Citation2017).
4.3.2. Effects of air velocity on thermal efficiency
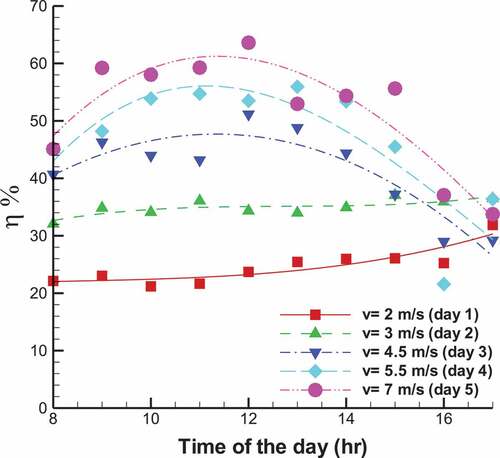
Thermal efficiencies versus the time of the day, at different air velocities, are presented in . Efficiency continuously increased as air velocity increase. The air velocity increased. The convective heat transfer coefficient increased to enhance the heat transfers between the working fluid and perforated plate, (i.e., the heat transfer rate was directly proportional to the air velocity). The highest efficiency for opening cover plate area of 0.2 m2 is found at 63.61%, for an airflow rate of 7 m/s. The peak value of thermal efficiencies was at velocities 4.5 m/s to 7 m/s, at noon from 12:00 am to 1:00 pm. However, it gradually decreased from noon to sunset for efficiencies during days’ work from 2 m/s to 3 m/s. In general, the thermal efficiencies were continuously increased from morning to evening, explaining this event; the heat flux from the sun was absorbed and stored in the porous media, resulting in slow heat loss from the absorber plate in the environment. In (Nowzari et al., Citation2014) studies, the researchers also mentioned that the maximum efficiency of the solar heater with 20D quarter perforated covers was 51.07% at 1:00 pm. (Hollick, Citation1994), the highest thermal efficiency (η = 58.02%) at 13:10 pm. (Vaziri et al., Citation2015), the maximum efficiency of unglazed white solar heater was 52% and 55% at noontime.
Figure 7. A variation of the collector efficiency of different air velocity for opening cover plate area of 0.2 m2
The thermal efficiency for the present work compared with the previously reported data. The proposed work showed significant improvement in the thermal efficiency with an air velocity of 7 m/s, as shown in .
Table 3. The comparison between present work and previous works
The efficiency continuously increased with the air velocity increased, but the outlet temperature decreased as air velocity decreased, as shown in . The results for the present study and earlier works (Li et al., Citation2013), (Badache et al., Citation2012; Gholampour & Ameri, Citation2014; Mahmood, Citation2019; Vaziri et al., Citation2015; Zheng et al., Citation2017) showed that the thermal efficiencies increased with the airflow increased; when the airflow raised, the thermal efficiencies increased because the heat removal capacity depends directly on the airflow. The outlet temperature increased with the airflow rate decrease; low speed moving air through the collector allows air to absorb more heat from the sun.
Figure 8. The relation of average outlet temperature, To with the average thermal efficiencies for the air velocity from 2 m/s to 7 m/s
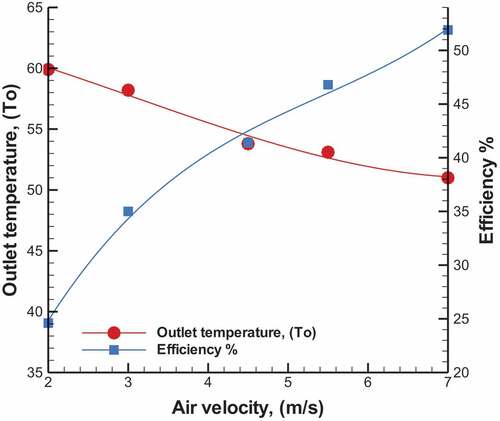
The maximum average thermal efficiency 52%, at air velocity 7 m/s, while the maximum average outlet temperature 60°C, at air velocity 2 m/s. The heat transfers from wire mesh layers and the cover plate to flowing air inside the collector are increased with low air velocity. Therefore, to satisfy the buildings’ thermal comfort, the application of the solar system should be at a low air velocity in cold weather, or if the solar system designed for the ventilation air system of the building, the high-efficiency solar system is chosen.
As shown in , the behavior of the efficiency curve is opposed to the behavior of the outlet air temperature curve, the efficiency increased as airflow increased. The efficiency was proportional to the airflow rate of the passing air (EquationEq. 33
3 ), but as increase airflow velocity, the heat loss increased; thus, the outlet temperatures decreased.
5. Conclusion
The current experimental study is conducted by evaluating the thermal analysis of a single-flow unglazed transpired collector for five days at an outward working environment. According to the experimental results of the thermal efficiencies and outlet temperatures, the unglazed transpired collector has been introduced to decrease heat loss to the environment and improve the heat transfer to the flowing air. The peak value of thermal efficiency corresponding to maximum airflow velocity of 7 m/s was 63.3 % at noon for a solar intensity value of 962 W/m2. It was seen that the outlet temperature decreased as the air velocity increased from 2 m/s to 7 m/s while the thermal efficiency increased. This experimental study has been done to find the optimum operating values of an unglazed solar system for residents to feel warm enough in the building. The best outlet temperature was 45°C when the system operated with outlet air velocity of 4.5 m/s which achieved average thermal efficiency of 41 %, in Baghdad city of Iraq. Finally, the predictions of the theoretical model for the outlet temperature were studied and compared with the experimental results. A good agreement was seen with a small difference of 5°C between the experimental and the predicted temperatures.
Nomenclature
Ac= Absorbed area (m2).
Cp = Specific heat of the air (KJ/kg. K).
FR= Collector heat removal factor.
UL= Overall heat loss coefficient, (W/m2. K).
I= Solar intensity (W/m2).
k = Air conductivity (W/m.K).
ṁ= Air flow rate (kg/s).
Ta = Ambient temperature (oC).
Ti= Inlet air temperature (oC).
To= Outlet air temperature (oC).
∆T= Temperature differences (oC).
v = Velocity (m/s).
Q= Energy absorbed (KJ).
Wp= Uncertainty results.
τα= Effective transmittance.
η= Thermal efficiency.
ηi= Instantaneous thermal efficiency.
ρ= Intensity (kg/m3).
ωn= Uncertainty of independent variable Xn.
Additional information
Funding
Notes on contributors

Afaq Jasim Mahmood
Dr. Afaq Jasim is an Associate Professor in the Department of Power Mechanics / Institute of Technology- Baghdad/ Middle Technical University. She has received her Doctor of philosophy degree in Mechanical Engineer, from Eastern Mediterranean University, in 2015. She has more than 20 years of teaching experience in mathematics, thermodynamics, and hydraulics systems. Her research interest includes the development of solar energy applications. She has published several research articles in National and International Journals of repute.
References
- Aldabbagh, L. B. Y., Egelioglu, F., & İlkan, M. (2010). Single and double pass solar air heaters with wire mesh as packing bed. Energy, 35(9), 3783–17. https://doi.org/10.1016/j.energy.2010.05.028
- Badache, M., Rousse, D. R., Hall, E. S., & Quesada, G. (2013). Experimental and numerical simulation of a two-dimensional unglazed transpired solar air collector. Solar Energy, 93(7), 209–219. https://doi.org/10.1016/j.solener.2013.02.036
- Badache, M., Rousse, D. R., Hallé, S., Quesada, G., & Dutil, Y. (2012). Experimental and two-dimensional numerical simulation of an unglazed transpired solar air collector. Energy Procedia, 30(20), 19–28. https://doi.org/10.1016/j.egypro.2012.11.004
- Dymond, C., & Kutscher, C. (1997). Development of a flow distribution and design model for transpired solar collectors. Solar Energy, 60(5), 291–300. https://doi.org/10.1016/S0038-092X(96)00157-0
- Gawlik, K., Christensen, C., & Kutscher, C. (2005). A numerical and experimental investigation of low-conductivity unglazed, transpired solar air heaters. Journal of Solar Energy Engineering, 127(1), 153–155. https://doi.org/10.1115/1.1823494
- Gawlik, K., & Kutscher, C. (2002). Wind heat loss from corrugated, transpired solar collectors. Journal of Solar Energy Engineering, 124(3), 256–261. https://doi.org/10.1115/1.1487886
- Gholampour, M., & Ameri, M. (2014). Design considerations of unglazed transpired collectors: Energetic and exergetic studies. Journal of Solar Energy Engineering, 136(3), 31004–31011. https://doi.org/10.1115/1.4026251
- Greig, D., Siddiqui, K., & Karava, P. (2012). An experimental investigation of the flow structure over a corrugated waveform in a transpired air collector. International Journal of Heat and Fluid Flow, 38(6), 133–144. https://doi.org/10.1016/j.ijheatfluidflow.2012.07.003
- Gunnewiek, L. H., Brundrett, E., & Hollands, K. G. T. (1996). Flow distribution in unglazed transpired plate solar air heaters of large area. Solar Energy, 58(4–6), 227–237. https://doi.org/10.1016/S0038-092X(96)00083-7
- Hollick, J. C. (1994). Unglazed solar wall air heaters. Renewable Energy, 5(1–4), 415–421. https://doi.org/10.1016/0960-1481(94)90408-1
- Incropera, F. P., & De Witt, D. P. (1985). Fundamentals of heat and mass transfer. John Wiley & Sons.
- Kutscher, C. F. (1994). Heat exchange effectiveness and pressure drop for air flow through perforated plates with and without crosswind. Journal of Heat Transfer, 116(2), 391–399. https://doi.org/10.1115/1.2911411
- Kutscher, C. F., Christensen, C. B., & Barker, G. M. (1993). Unglazed Transpired Solar Collectors: Heat Loss Theory. Journal of Solar Energy Engineering, 115(3), 182–188. https://doi.org/10.1115/1.2930047
- Leon, M. A., & Kumar, S. (2007). Mathematical modeling and thermal performance analysis of unglazed transpired solar collectors. Solar Energy, 81(1), 62–75. https://doi.org/10.1016/j.solener.2006.06.017
- Li, S., Karava, P., Savory, E., & Lin, W. E. (2013). Airflow and thermal analysis of flat and corrugated unglazed transpired solar collectors. Solar Energy, 91(5), 297–315. https://doi.org/10.1016/j.solener.2013.01.028
- Mahmood, A., “Exergy analysis of flat plate solar air heaters having obstacles and filled with wire mesh layers”, 2nd International Conference on Sustainable Engineering Techniques, Baghdad, Iraq, IOP, pp. 32001–32010, 6–7 March 2019.
- Naveed, A. T., Kang, E. C., & Lee, E. J. (2006). Effect of unglazed transpired collector on the performance of a polycrystalline silicon photovoltaic module. Journal of Solar Energy Engineering, 128(3), 349–353. https://doi.org/10.1115/1.2212438
- Nowzari, R., Aldabbagh, L. B. Y., & Egelioglu, F. (2014). Single and double pass solar air heaters with partially perforated cover and packed mesh. Energy, 73(10), 694–702. https://doi.org/10.1016/j.energy.2014.06.069
- Sözen, A., Şirin, C., Khanlari, A., Tuncer, A. D., & Gürbüz, E. Y. (2020). Thermal performance enhancement of tube-type alternative indirect solar dryer with iron mesh modification. Solar Energy, 207(1), 1269–1281. https://doi.org/10.1016/j.solener.2020.07.072
- Sözena, A., Kazancıoğlu, F. S., Tuncer, A. D., Khanlarie, A., Bilgec, Y., & Gungor, A. (2021). Thermal performance improvement of an indirect solar dryer with tube-type absorber packed with aluminum wool. Solar Energy, 217(15), 328–341. https://doi.org/10.1016/j.solener.2021.02.029
- Summers, D. N., 1995, “Thermal simulation and economic assessment of unglazed transpired collector systems,” Master thesis, University of Wisconsin.
- Van Decker, G. W. E., Hollands, K. G. T., & Brunger, A. P. (2001). Heat-exchange relations for unglazed transpired solar collectors with circular holes on a square or triangular pitch. Solar Energy, 71(1), 33–45. https://doi.org/10.1016/S0038-092X(01)00014-7
- Vaziri, R., İlkan, M., & Egelioglu, F. (2015). Experimental performance of perforated glazed solar air heaters and unglazed transpired solar air heater. Solar Energy, 119(9), 251–260. https://doi.org/10.1016/j.solener.2015.06.043
- Zheng, W., Zhang, H., You, S., & Fu, Y. (2017). Experimental investigation of the transpired solar air collectors and metal corrugated packing solar air collectors. Energies, 10(3), 1–12. https://doi.org/10.3390/en10030302