
 ?Mathematical formulae have been encoded as MathML and are displayed in this HTML version using MathJax in order to improve their display. Uncheck the box to turn MathJax off. This feature requires Javascript. Click on a formula to zoom.
Abstract
Poultry products such as chicken and eggs are part of staple foods and a source of protein in Indonesia so their availability for consumers needs to be ensured. Besides that, there is also a pressing need to reduce imports and keep prices stable. In Indonesia, poultry products are consumed more than beef, fish, and other staple protein products. This paper aims to develop a model of poultry product-supply chain using System Dynamics (SD) approach to a) capture the causality between variables in the availability of corn supply, feed mills, chicken production and customer demand; and b) to create a scenario where commodity demands can be fulfilled adequately so that food security can be strengthened. As the main ingredient of poultry feed, corn produce can be increased by using a tight planting method and the use of superior seeds. The sustainable availability of chicken feed is then expected to help boost poultry produce, in addition to improving the chicken farming methods per se. The proposed model is expected to provide a better understanding of poultry product food chain, which will subsequently inform relevant policymakers in formulating strategic programmes to strengthen food security.
PUBLIC INTEREST STATEMENT
Strengthening food security requires a multi-pronged approach and the availability of staple protein has become one of the prioritised areas in the Government of Indonesia’s national agenda. The complexity of protein-food supply chain is high because it involves various actors and interconnected factors. To break down this complexity into a simpler actionable plan, a supply chain model is needed. This paper proposes a model of poultry-product supply chain using a System Dynamics (SD) approach to capture the causality between variables in corn supply, feed mills, chicken production and customer demand. The results of this study yield several solutions; first, corn supply could be increased by intensifying its production using a tight planting system and the use of superior corn seeds. Meanwhile, to improve the production of the poultry products, modern farming and chicken strain programmes can also be applied.
1. Introduction
Food security is a multi-layered business that requires intense collaboration among stakeholders and policymakers in a well-organised and fully functional service-oriented supply chain system (Moragues-Faus et al., Citation2017). Problems related to food security are now becoming more complex because food production involves the sourcing of water, land and energy, which are decreasing due to the growing population, excessive exploitation of resources, vulnerable trade transactions and unforeseen political events (Vieira et al., Citation2018). Recently, this has also been exacerbated by the COVID-19 pandemic. Population growth continues year by year; and according to FAO, from the latest report by the UN, the world population is projected to grow by 34%, from 6.8 billion in 2020 to 9.1 billion in 2050, with a significant increase occurring in developing countries (FAO, Citation2020). Meanwhile, the prolonged COVID-19 pandemic has also disrupted and reduced production as countries are grappling to deal with the impacts. Therefore, FAO strives to enhance food security’s resilience in emerging and poor nations (FAO, Citation2020) through its advocacy programmes.
Food availability is a critical output of food systems and a critical success factor of food security. Ensuring a continuous and efficient food production and supply chain is the main objective in food security (Namany et al., Citation2020). However, food availability is continuously challenged by compounded externalities (Namany et al., Citation2020) so the system must be supported by proper supply chain management. A key indicator of success is when people’s needs are fulfilled, whereas the variables of success include entities and processes in the supply chain such as farming, food processing, distribution and storage. Self-sufficiency is often the ultimate goal, and dependence on imports is not desirable as it can jeopardise local businesses and economy.
Indonesia’s population reached 266.8 million in 2018, which was the fourth largest in the world (Worldometer, Citation2019). Ensuring food security is not an easy task, especially in a challenging time like the COVID-19 pandemic. Disrupted supply chain may impact prices in the market, which will not only affect people with low purchasing power, but the economic, social and political situations in general. The complexity of the problem is further influenced by rapid population growth, volatile climate change, poor transportation and logistics infrastructure and others. Moreover, the supplies that must be managed are not only those consisting of carbohydrates, but also protein. Poultry products, e.g.,, chicken meat and eggs are the main protein staples consumed in Indonesia compared to other sources such as beef, mutton and duck (BPS, Citation2018a); and their consumption in Indonesia has been increasing along with the growth of the economy (BPS, Citation2018b).
Previous research on food security has focused on rice commodity as the staple food of Asian countries. Bala and Hossain (Citation2010) modelled a rice supply chain to ensure the availability of rice commodity in Bangladesh using a system dynamics (SD) approach. Further research subsequently improved the model with more diverse subsystems (Bala et al., Citation2017). A model of rice production for food security in Malaysia captured the causality between variables in the paddy and the rice system (Bala et al., Citation2014). The findings suggested research and development in bio-fertilizer application, paddies varieties and new extension approach. Research has been extensive in this area. Chung (Citation2018) also modelled and simulated Malaysian rice value chain using the dynamics system; Chopra et al. (Citation2017) mapped the role and relationship of stakeholders in India’s rice supply chain, recommending scenarios and policies aimed at ensuring availability under uncertain situations; Das and Nayak (Citation2017) investigated the uncertainty factors; Sahle et al. (Citation2018) mapped the supply and demand of a certain crop in Ethiopia to improve the food security; and Tey et al. (Citation2019) investigated the potential of smallholders to improve rice value chain using SD approach.
In Indonesia, previous studies in food safety also focus on the availability of rice commodity. Pertiwi (Citation2004) developed a food security model using the SD approach with rice production as a case study. Muslim (Citation2015) analysed the volatility of deflated retail price of rice and its implication to food security in two major markets in Indonesia. Avianto et al. (Citation2016) developed a new spatial SD model for rice production that combines the concepts of space and time. Makbul et al. (Citation2019) investigated the implications of Trans Java toll road construction, which means the reduction of rice field is a threat to food security. Vanany et al. (Citation2019) modelled food security system of protein staple foods. However, with regards Indonesia’s food security for protein staple foods, especially poultry products, there are still a few comprehensive studies that propose a new model SD approach to create effective scenarios to improve the food security system in Indonesia. Therefore, this study aims to (a) capture the causal relationship between variables affecting corn supply, feed mills, chicken production, and consumer demand; and (b) to construct a scenario in which commodity needs may be met satisfactorily, therefore strengthening food security using SD approach.
2. Food security for staple protein in Indonesia
In Indonesia, the two staple food commodities that are an integral part of food security are staple vegetables and staple protein (Investor Daily, Citation2015). Chicken meat, eggs, beef, fish and milk are the examples of staple protein commodities in Indonesia. Among these, chicken meat and eggs are the most consumed (Ariani et al., Citation2018). Following the relative success securing the availability of rice commodity as the main staple food, the Indonesian government’s next target is to improve staple protein commodities.
Protein sources are important for consumers of all ages, especially for the younger generation. Reports have indicated that 37% of children under five suffer from stunting (height does not match age) and 12.1% suffer from wasting (body weight does not match age) (Balitbang Kemenkes, 2019). Protein consumption is also reported to be below recommended levels (Balitbang Kemenkes, 2019). On the other hand, the population continues to increase and is estimated to reach 312 million in 2040 (Worldometer, Citation2019). Middle-class population is predicted to reach 200 million in 2045 (Laucereno, Citation2017), and this means the protein consumption will also increase. Staple protein commodities widely consumed are chicken meat, with per capita consumption being higher (5.683 kg) than beef (0.469 kg) and other commodities in 2017 (BPS, Citation2018a).
Staple protein supply chain involves many actors and interconnected factors. Because it is complex, the existing sub-model for the chicken supply chain is based on the supply chain actors. Vanany et al. (Citation2019) developed a model of chicken production with four subsystems, namely corn supply, feed mill plant, chicken production and customer demand. Corn is the main ingredient in the feed mill industry (Marcó et al., Citation2002). In Indonesia, corn farm yields could be categorised as high, medium and low based on the land quality and the technology used. Domestic corn used for animal feed is predicted to reach 55% (Rusono et al., Citation2015). Aside from causing price surge, the supply of domestic corn can decrease animal feed supply, which is the main food for broilers and egg-laying hens (Zuprizal, Citation2019). Feed of 3.399 kg is needed to produce 1 broiler (+-1.8–2 kg) (Cobb-Vantress, Citation2018) and feed of 6.6 kg is needed for 1 laying hens (+-1.475–1.5 kg) (ISA, Citation2018).
3. Research design
System Dynamics (SD) is a robust method for simulating a complex system and is often used for food security policy analysis (Bala et al., Citation2014, Citation2017; Chung, Citation2018; Van der Heijden et al., Citation2019). SD could be used to test possibility scenarios with a problem system view (Ahmadvand et al., Citation2013). As such, policymakers can understand the long-term outcomes of their policies by simulating them under different scenarios for more informed decision-making (M Bastan et al., Citation2013). Sterman (Citation2000) describes five stages of modelling a problem based on the SD approach, which are problem articulation, dynamic hypothesis, formulation, testing, and policy formulation and evaluation. The stages of this research are based on Sterman (Citation2000), which consists of five problem-solving stages, which are: (1) observation and problem identification; (2) conceptual framework and causal loop diagrams (CLD); (3) stock and flow diagram; (4) model validation; and (5) actual condition and scenario evaluation. The current study carried out five stages over a period of 6 months.
The scope of the current research is chicken meat and eggs and does not consider beef, goat and other poultry products. The rationale behind it is because these are the most consumed staple protein in Indonesia. The first stage of the research was to select the research object and observation area before identifying the problems in the supply chain. East Java province was selected as an observation area because it is a producer of national agriculture and livestock. It can supply the staple protein commodities in demand locally and nationally.
In the first stage of the research, food security problems related to staple protein needs are also identified by interviewing food security policymakers. Overall, this research was supported by primary and secondary data from stakeholders related to food security for protein foods (e.g., livestock department, feed mills, corn production, and chicken farming). The primary data sources were obtained from interviews with corn and chicken farmers; with policymakers from the East Java Department of Animal Husbandry; and feed mill companies. Secondary data about the production and food security was obtained from the Central Statistics Agency, the Department of Agriculture and the Department of Animal Husbandry.
In the second stage, the conceptual framework and causal loop diagrams (CLDs) were developed. The entities involved in the supply chain are identified in the conceptual framework, and their relationships are also determined. The entity types inform the creation of the sub-model. The development of CLD is to show what main variables are to be described in the model. As such, understanding causal relationship between the variables will be easier, as well as the influence of each variable on the system behaviour and on other areas (Sterman, Citation2000) such as food security (e.g., Bala et al., Citation2014; Guma et al., Citation2018; Popp et al., Citation2019), energy policy (e.g., Tong & Qu, Citation2011; Xu & Szmerekovsky, Citation2017) and traceability policy (e.g., Gunawan et al., Citation2019).
In the third stage (stock and flow diagram), after describing the interactions between variables by using the CLD, stock and flow diagram is used to involve the mathematical equation/formulation and to illustrate the interactions or relationships between the variables (Mahdi Bastan et al., Citation2018; Tsolakis & Srai, Citation2017). The main components of the SD approach are the identification of stocks, flows, feedback loops, table functions and time delays, based on the observations (Tey et al., Citation2019). Stock indicates the accumulation of variables, while flow illustrates the level of stock changes in a certain period.
In the fourth stage (verification and validation), trust in the study’s outcomes is increased by using simulations (Robinson, Citation1997). The goal of the verification stage is to check that no debugging occurs and that the logic of the simulation model works (Shannon, Citation1998). The validation test is used to determine if the model fits the real conditions and to confirm that the model generated is accurate enough to reflect the system under investigation (Robinson, Citation1997, Citation2004). Law and Kelton (Citation2000) pointed out that the verification stage needs software debugging for verification stage and checking for inappropriate implementations of the conceptual model and verifying calculations for the validation stage.
To validate the model, an extreme condition test, boundary adequacy (structure and behaviour) test, is carried out. Extreme condition test sets the extreme value parameters to test the consistency and significance of variable’s behaviour in a model (Mahdi Bastan et al., Citation2018). It aims to discover flaws in a model structure and enhance the usefulness of a model in analysing policies that may force a system to operate outside the historical regions of behaviour (Senge & Forrester, Citation1980). The boundary adequacy for structure test considers the important structural relationships that are essential to meet the model’s purpose (Senge & Forrester, Citation1980). The adequacy of the model boundaries can be cross-checked against the expert judgment too for validation (Mahdi Bastan et al., Citation2018), which was conducted via interviews with experts and policymakers in the current study. Finally, the structure verification test is used to compare model structures directly with the real system structure that the model represents (Barlas, Citation1996).
In the final stage (the actual condition and the scenario evaluation), different scenarios based on different policies and perspectives are generated. Identifying the leverage points of the problem is necessary at this stage (Mahdi Bastan et al., Citation2018). Three leverage points are used to present the scenario results of the simulation, namely increasing corn production, reducing corn import, and fulfilment of staple protein demand. Based on these leverage points, the proposed scenario can be analysed to formulate well-informed policies.
4. System dynamics approach for staple protein food security
4.1. Observation area and identification of problem
4.1.1. Observation area
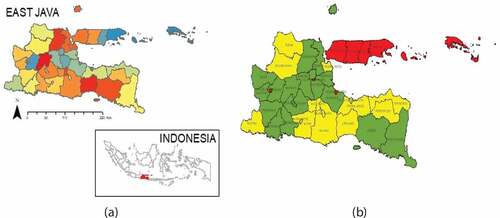
East Java province was selected because it plays an important role in providing staple protein in Indonesia. East Java (see ) is inhabited by nearly 39.3 million (data from 2017) and has been a major producer of agriculture and livestock products in Indonesia (BPS, Citation2019a). East Java is the largest corn producer, contributing 31% of the total national production (BPS, Citation2019b). In the livestock sector, East Java province also produces the largest chicken eggs supply, at 28% of the total national production in 2018, and is the third largest producer of chicken meat, at 13% of total national production (BPS, Citation2019a). Overall, East Java is expected to continue to be the main producer of corn production, staple protein (chicken, beef and chicken eggs) to supply several other provinces in Indonesia (Ilham & Saptana, Citation2020).
Figure 1. (a) Selected province as case study in this research and (b) corn productivity in case study’s districts
4.1.2. Identification problem
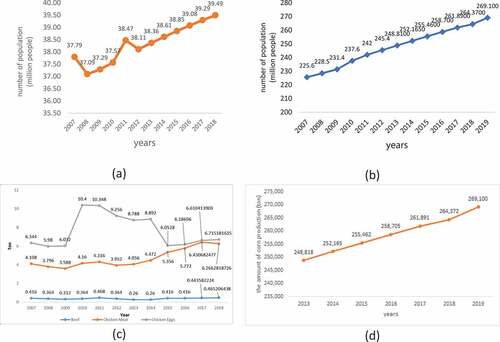
Based on the data and the interviews with the department of agriculture and livestock in East Java, the consumption of chicken meat and eggs locally and nationally was increasing (see and 2b) along with the increase in population. However, this was not followed by the same rate of increase in corn production required for feeding. As shown in , there is no significant growth, and the production tends to be stable or is even declining. In fact, the allocation of land for corn farming will decrease. With the constant demands of the poultry products, it is estimated that there will be a shortage of chicken meat and eggs in the future.
Figure 2. Growing population in East Java Province (a), growing population in Indonesian (b), chicken meat and eggs demand in East Java (c) and corn production growth in East Java (d) (summarised from: BPS, Citation2019a), BPS Citation2019b, BPS, Citation2018a, and BPS, Citation2018b
4.2. The conceptual framework and causal loop diagram
4.2.1. The conceptual framework
The conceptual framework in the current study is based on literature review and expert opinions from governmental policymakers. The conceptual framework is made to find the most suitable sub-model. There are four relevant sub-models: corn supply, feed mill production, chicken production and customer demand (see ). In the corn supply sub-model, corn productivity value in each region needs to be calculated to differentiate between those with high productivity and low productivity. The productivity is categorised as high, medium and low. The value is obtained from the amount of annual corn production divided by its area. The corn supply sub-models were developed by considering previous research, such as by Khodeir and Abdelsalam (Citation2016), Suryani et al. (Citation2020), and Vanany et al. (Citation2019).
Figure 3. Conceptual framework for food security in staple protein supply chain
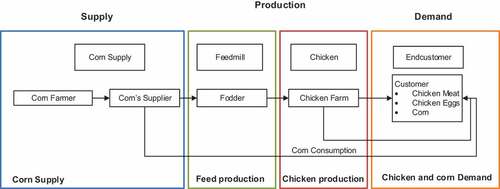
In the feed mill production sub-model, the number of factories, their capacity and average production are important variables to understand the availability of chicken feed, as well as the number of feed mill plants outside the province. Based on the interview results with feed mill plant stakeholders, 50–60% of chicken feed requires corn as a main raw material. Meanwhile, 60–70% of the operation cost in a chicken farm is spent on the feed (Sarno & Hastuti, Citation2007).
In the chicken production sub-model, chicken meat and eggs are a type of food commodity produced by chicken farms. The amount of production per year is an important variable to understand the availability of chicken meat and eggs. Lastly, in the customer demand sub-model, the consumption of chicken meat and egg commodities are the important variables. Such demands should also consider the demands from other provinces and other countries. Samsuddin et al. (Citation2015) pointed out that sustainable chicken farming is critical in addressing food security problems in Malaysia.
4.2.2. Causal loop diagram (CLD)
In the development of the proposed model using SD approach, the elements of CLD are presented as a set of variables, arrows/links, feedback and feedback loops. The variables in CLD represent the relationship of causality (cause and effect) between identified variables in the system, while arrows indicate which variables that affect other variables. The feedback shows a positive/negative direction of the influential relationships, while the feedback loops indicate the loop types (both in the clockwise direction) whether it is a reinforcing loop (R) or a balancing loop (B).
Reinforcing loops is a positive feedback that reinforces change by rewarding it with further change (Forester, Citation1961). This research includes four balancing loops. For instance, in the feed mill sub-model, adding the fodder stock variable increases chicken fodder consumption. Fodder intake benefits corn demand, which means the higher the fodder consumption, the greater the corn demand. When demand exceeds supply, the corn stock is depleted, and the causal loop diagram receives negative feedback. This negative feedback is also called balancing loop, whose ultimate value is zero (Forrester, Citation1961). This study employed a single reinforcing loop. For instance, in the sub-model for feed mills and grain supplies, corn demand expansion will have a negative influence on corn stock; in other words, the more corn demand there is, the less corn stock there will be. Concerning the corn stock variable, it will have a positive influence on the material required for fodder. In other words, if corn stock is lowered, the material required for fodder will grow, resulting in a negative effect on corn for human consumption.
Based on the conceptual framework for staple protein food security, the CLD was created using a software and classified into four sub-models: the corn supply, the feed-mill production, the chicken production, and the end-customer demand sub-model. These sub-models in CLD are related to each other and five loops are identified within the CLD, involving four balancing loops (B) and two reinforcing loops (R) (see ). Considering the dynamic hypothesis and the four sub-models in the conceptual framework, the CLD was drawn as presented in .
Figure 4. Clause loop diagram of food security for staple protein supply chain in Indonesia
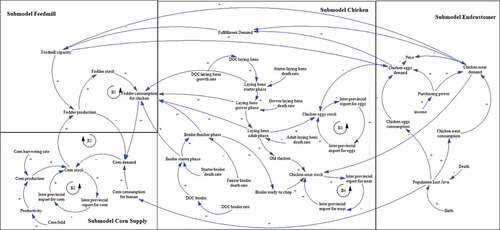
In the corn supply sub-model, the corn stock and corn field become the main decision variables that can influence variables in other sub-models. However, the corn stock variable is a decision variable that is affected by some other variables too, such as the corn production as the response variables in this sub-model, the corn consumption by the locals, the inter-provincial trading, and the export and import. Meanwhile, corn stock positively influences fodder production, inter-provincial trading and export. Each variable in this sub-model has each feedback types to the influenced variables. Furthermore, in the feed-mill production sub-model, the fodder production becomes the main decision variable that has an impact on the chicken production sub-model. However, the fodder production is influenced by some variables such as feed-mill production capacity, the number of feed mills, corn stock and fodder stock. Only fodder stock has a negative impact on fodder production.
In the chicken production sub-model, the fulfilment demand for chicken meat and eggs based on demand data is a significant factor affecting the amount of chicken production. The response variables for this sub-model include chicken meat and eggs stock, as well as chicken fodder consumption. The availability of corn stock is a response variable that positively influences income and consumption. Lastly, in the customer demand sub-model, the demand of chicken meat and eggs is the main variable that influences price. Another dataset relevant to the current study is the population data and customer rates from East Java, as well as other provinces in Indonesia. The CLD of food security for staple protein in Indonesia is shown in .
4.3. Stock flow diagram
The basic simulation model using the SD approach comprises mostly stock and flow diagrams. The stock and flow diagram to involve the model’s mathematical equations was developed after the causal loop diagram was completed. The stock and flow diagram is used to depict model variables such as the accumulation process, and the movement of information and materials in the system (Mahdi Bastan et al., Citation2018). In building a stock flow diagram, four components are needed: (1) state (level variable); (2) flow (value, control or process variable); (3) converter (translation variable); and (4) connector (information arrow) (Sterman, Citation2000). The stock flow diagram is also divided into four sub-models according to the CLD. illustrates the stock flow diagram for the four sub-models.
Figure 5. Stock flow diagram for (a) corn supply, (b) feed mill production, (c) chicken production and (d) demand for chicken meat and eggs sub-model
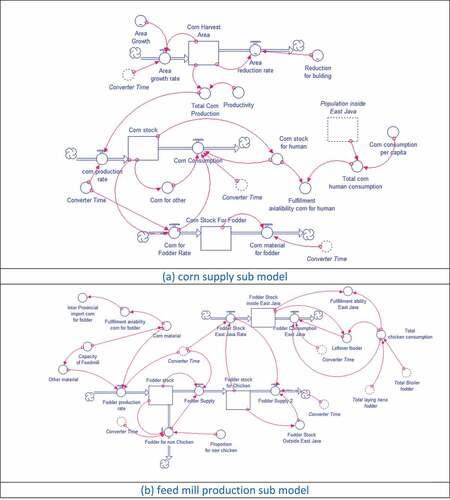
Figure 5. Continued
In addition, the reinforcing loop can be defined as a positive loop and the balancing loop as a negative loop. shows the sub-model, variables, unit and formula/relationship equation in the model. The main variables within the sub-model were identified with the units and formulas of each variable. For instance, the corn production in the corn-supply sub-model has a “ton/ha” dimension, which can be calculated from the multiplication of productivity, corn field and harvesting rate. Some of the variables have no formulation at all because their values can be directly obtained from the historical data. It should be noted that the data used in this study were obtained from both historical data and assumptions. For example, the composition of fodder production formulation was derived from secondary data. Whereas the variables of birth and death are defined differently, the birth and date rates are calculated using the underlying assumptions’ values.
Table 1. The sub-model, variables, unit and formula/relationship equation in the model
In the corn supply sub-model, historical data are utilised to generate corn productivity variables that accurately reflect the productivity on corn farming land in each district. According to the data by East Java’s Central Statistics Agency, the corn production in some districts, including Trenggalek (67,642 tons/ha), Pamekasan (87,668 tons/ha) and Sampang (92,242 tons/ha) was low; in other districts such as Bondowoso (130,516 tons/ha), Lumajang (137,507 tons/ha) and Gresik district (139,513 tons/ha) the production is moderate; and in Tuban (62,283 tons/ha), Jember (471,285 tons/ha) and Lamongan (426,133 tons/ha), the production was high. The data used to calculate the production of corn in each district is based on the actual conditions. In the feed mill production sub-model, the variable input is the available factory capacity, the raw corn supply and the animal feed consumption. The fodder stock is the amount of animal feed that can be produced by the industry in a year. The animal feed industry not only produces animal feed for chickens, but also for other livestock such as pigs, cows, quails and ducks. The formulation of fodder production is a composition formulation of raw material for animal feed, namely 50% corn and 50% other ingredients.
In the chicken production sub-model, there is a broiler model and a layer chicken model. The former has a two-phase life cycle, and the latter has a three-phase life cycle. The variables involved in the production of eggs and chicken meat range from Day Old Chick (DOC) to eggs and chicken meat. This sub-model aims to determine the annual production of eggs and chicken meat. The rate of addition is influenced by DOC input and the rate of reduction is influenced by mortality rate. Mortality may be caused by a disease or lack of feed. The rate of chicken stock addition is influenced by the number of broilers ready for harvest, whereas the rate of reduction is influenced by the large demand for chicken meat in the market. Meanwhile, the rate of increasing egg stock is influenced by the number of adult layer hens, whereas the rate of reduction is influenced by the demands for chicken eggs.
The customer demand sub-model represents the total demand for eggs and chicken meat each year. The increasing and declining demand for eggs and chicken meat are the variables in this sub-model. The rates of stock addition of eggs and chicken meat are influenced by the number of live chickens that can produce meat and eggs. Meanwhile, the rate of reduction is the demand for eggs and chicken meat as influenced by per capita consumption, population and people’s purchasing power. The demand for chicken eggs is not only from within the province of East Java but from other provinces. People’s purchasing power is influenced by income and the proportion of expenditure on eggs and chicken meat. shows the stock flow diagram of each sub-model and describes the formula/relationship each sub-model.
4.4. Simulations results and validation
To verify the proposed model, we checked the unit and verified the model using SD software to ensure that no errors had occurred. The findings indicate that no errors were found and all units within the proposed model appeared to be consistent. This was confirmed by interviews with chicken farming experts that were performed to assess the suggested model’s logics’ appropriateness.
To validate the proposed model, we performed four validation tests: (1) boundary adequacy; (2) parameters model; (3) extreme condition and (4) statistical mean comparison test. The boundary adequacy test included interviews with two experts (chicken farming and feed specialists), a review of relevant literature and records, and observations of corn farming in Tuban and chicken farming in Malang. The results show that the model is legitimate. Meanwhile, the results of parameter model test demonstrate that the model’s logics are appropriate when compared to the actual ones. For instance, increasing corn acreage logically results in more corn production and vice versa; and the simulation results also confirm these findings. In addition, an extreme condition test was conducted by replacing choice variables with extreme values and examining the resulting changes in linked response variables; or instance, by altering the choice variables’ egg output per chicken and the response variables’ egg production. The findings demonstrate conformity among them.
The two major variables in the corn supply sub-model and two key variables in the chicken production sub-model were compared using a mean comparison test. The corn production and corn harvest areas are significant variables in the corn supply sub-model. Meanwhile, the chicken meat and chicken eggs production are significant in the chicken production sub-model. The verification and validation were conducted using the relative error and mean absolute percentage error (MAPE) indicators. The two indicators were used to make comparisons between historic data and simulation data, and to calculate MSE indicators with formulas as follows:
Note:
E = Percent error mean
S ̅ = The average value of the simulation data
A ̅ = The average value of the actual data
shows the four variables used to test whether the simulation model is valid or not based on the level of error. The error-level indicator used is the MSE indicator. In general, the results of the simulation are equitable and reasonable (valid) when the MSE indicator value is below 5% (Barlas, Citation1996). According to Equationequation 3(3)
(3) and Equation4
(4)
(4) , the MAPE indicator values of four validation indicators were calculated: 0.006, 0.015, 0.029 and 0.041 (see ), so that theoretically, the proposed model has met its accuracy requirement.
Table 2. Validation results using mean absolute percentage error (MAPE)
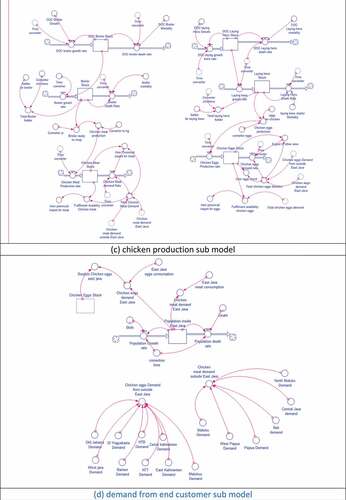
The findings of the four tests conducted in this study are all valid, indicating that the model is robust and consistent with existing conditions. According to Shreckengost (Citation1992) and Sterman (Citation2000), a model is acceptable if it accurately represents the existing condition that has been validated and appraised for its structure and behaviour using a variety of validation tests. A sensitivity analysis was also performed in this study to determine the consistency of the results on corn stock and chicken meat stock. Corn stock as a choice variable is shown in to be consistent with changes in corn production. The productivity level is varied between 30% increase (0.095) and 30% reduction (0.051), while the visual pattern remains stable. The continuous visual pattern displayed in demonstrates that the chicken meat stock sensitivity study results are similarly resistant to changes in the converter to kg variable. The converter to kg variable’s value was increased by 30% (1.69 kg) and decreased by 30% (1.69 kg) (0.091 kg).
Figure 6. The sensitivity analysis results for (a) corn stock and (b) chicken meat stock
4.5. Actual condition and simulated scenarios
After the verification and validation stages are completed, a simulation analysis is conducted to determine the actual conditions of the land area, corn production, chicken meat and eggs production, as well as the demand for chicken meat and eggs. The prediction of corn production, animal feed production and the availability of chicken meat and eggs are needed to predict possible food security problems. The simulation period used in this study is for the next 15 years starting from 2020 to 2035. The policy and subsequent development of a food safety roadmap for staple foods, particularly staple protein foods in Indonesia, are reviewed each 10–15 years. The prediction results show that: first, the reduction of land area for corn farming will cause a decrease in corn production from 2020 to 2035. This is estimated to be caused by the conversion of land functions from agriculture to settlement and buildings. Consequently, there will be an increase in the amount of corn import to meet the raw material needed by the animal feed industry. Second, the reduced corn production will lead to an increase in corn import by the feed mill industry starting from 2021 until 2035. Third, the demand for chicken meat from other provinces cannot be fulfilled in 2020 and neither can the demand for eggs in 2030. In , the actual conditions of corn farming, corn production, corn import and the availability of chicken meat and eggs show that there will be a decline in corn fields, thus affecting a decrease in corn production, and an increase in corn imports. Therefore, the demand for chicken meat for other regions cannot be fulfilled.
Table 3. Actual condition for corn farming, corn production, corn import, and availability of chicken meat and eggs
Three objectives need to be improved when developing food security policy scenarios for staple protein such as increasing corn production, reducing corn imports and fulfilling demands for staple protein. The first scenario to improve corn supply is through the formulation of public policy. This should be more effective in boosting corn production and reduce corn import. Consistent availability and affordable prices of corn will support farmers in producing more chicken meat and eggs. Sufficient supply of poultry products in the market will stabilise the price, and this will help to ensure food safety.
Another two scenarios were also created based on prior research stages: the findings of interviews with experts and policymakers, and the decision variables identified in this study, namely corn stocks and feed stocks resulting from fodder production. Experts and policymakers believe that by using superior corn seeds and a tight corn planting system, corn stock—which is a decision variable in this study—can be increased; hence, the demands for chicken meat and eggs could also be met efficiently. Poultry farming requires feed, and the manufacturers require corn as their main raw material. Increasing chicken meat and eggs production through the use of chicken boiler strains and modern poultry farming is regarded by some experts to be a feasible method of increasing chicken meat and eggs production (Abidin, Citation2003; Tangendjaja, Citation2019). Additionally, initiatives for chicken boiler strains and modern poultry farming have been established for small and medium-sized chicken farming enterprises.
4.5.1. Scenario 1: Improving corn supply policy
In scenario 1, the policy to increase corn supply was recommended because it could indirectly solve chicken meat and eggs shortage in Indonesia. Corn is the main raw material for chicken feed that chicken farming needs. There are two sub-scenarios that can be implemented, namely by using superior corn seeds (scenario 1A) and by using a tight corn planting system (Scenario 1B). The superior corn seed programme can increase the productivity of corn yields per hectare (Mardani et al., Citation2017). According to Sutoro and Soeleman (Citation1988), another important programme to increase corn productivity is to increase plant density per unit area. The spacing of corn that is applied in Indonesia is in one row of about 20 cm and the spacing between rows is 75 cm, or 20 cm times 70 cm (Balitbangtan, Citation2016).
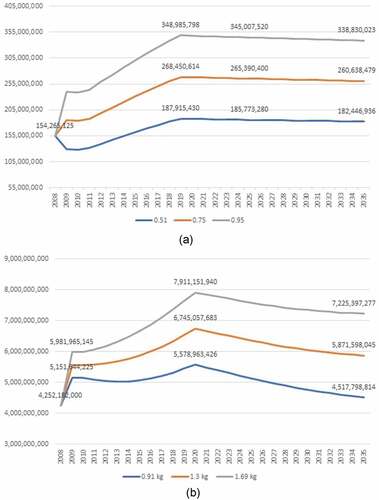
The two-pronged policy that could be implemented is to increase corn production and reduce corn import at the same time. This is because insufficient local corn production, particularly in East Java province, will mean that the domestic demand must be fulfilled by importing corn from other countries. Meanwhile, in the superior corn seed programme (sub-scenario 1A), corn output could be increased by a considerable amount (5–8% per year). By 2033 only 92.94%, and by 2035 only 41.09% can be fulfilled by domestic corn production. Therefore, from 2033 to 2035, corn import will be required to meet the existing demand. Meanwhile, the tight corn planting system programme (sub-scenario 1B) is expected to result in a considerable production increase (5–10%), which subsequently will decrease corn import from 2020 until 2035. Additionally, we also conduct sub-scenario 1 C, which involves combining sub-scenarios 1A and 1B, and increases corn production (16–29%). The implication of scenario 1 C is that no import will be needed to fulfil the shortage of corn stock for feed production. describes the results of the corn supply policy in terms of increasing corn production and reducing import.
Table 4. The results of increasing corn supply policy (scenario 1)
is designed to assist policymakers in determining which scenario to pick from. While the superior corn seed programme is less successful at improving corn output, the tight corn planting system programme and its combination are able to increase corn productivity significantly (see ). The improved corn seed programme is still ineffective in meeting corn demand, necessitating import from other countries (see ). Naturally, the combination of the superior corn seed programme and the tight corn planting system will yield a bigger amount of corn and allow for increased corn output, eliminating the need for import.
Figure 7. Comparison between three sub-scenarios for the chicken broiler strain programme (scenario 2A) to (a) increasing corn production and (b) reducing corn import
4.5.2. Scenario 2: Policies aimed at improving the production of chicken meat and eggs
The policy of improving the production of chicken meat and eggs in this research can be divided into two programmes, namely the chicken boiler strain (scenario 2A) and the modern poultry farming programme (scenario 2B). The chicken boiler strain programme can be carried out by implementing biotechnology, i.e., applying genomic solutions. Based on the interviews with practitioners in a modern broiler farm, the chicken broiler strain programme (scenario 2A) can reduce feed consumption by 48%. The superior chicken boiler strain can reduce the harvest time from 45 days to 35 days. The broilers have two phases of the life cycle, namely the starter phase and the adult phase. In the starter phase, 1.2 kg of feed consumption is required, while in the adult phase, 4.9 kg of feed is required. In , the chicken broiler strain programme is predicted to be able to reduce feed consumption by 20% or about 623.10 tons annually.
Table 5. The results of the chicken broiler strain programme to reduce feed consumption (scenario 2A)
The modern farming programme (scenarios 2B1 and B2) can increase chicken meat and eggs production by different percentages. Based on the interviews with practitioners who work in a modern poultry and boiler farming, the programme can upgrade their farming to increase eggs production by 20% and meat production by 22%. The modern poultry farming programme is predicted to be able to increase production per year by an average of 585,300 tons and can cover the shortage of national egg consumption from (+ −30 tons) in 2030 to (+ −12,780 tons) in 2035 (see ). Meanwhile, the modern boiler farming is predicted to increase chicken meat production per year by an average of 2,553,340 tons. The shortfall of chicken meat consumption in 2027 (+- 110 tons) can be fulfilled until in 2035 (+-1,120 tons). shows the results of the modern chicken farming programme in poultry and boiler farming.
Table 6. The results of the modern chicken farming programme to increase eggs (scenario 2B1) and chicken meat (scenario 2B2) production
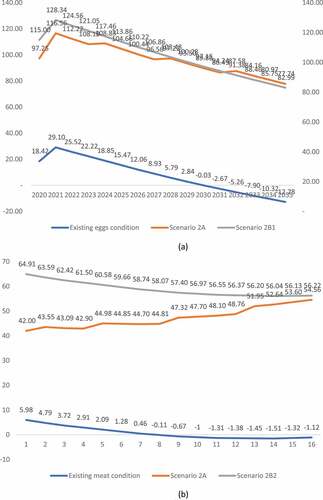
According to , the modern poultry farming programme scenario 2B1 is the best option for the first years (2020–2031), as it is capable of meeting eggs demand and provids a sufficient stock. However, scenario 2A might result in increased egg stocks in the later years (2032–2035). According to , scenario 2B2 is the most efficient way to increase chicken meat stock and to fulfil chicken meat demand.
Please find : The results of the modern chicken farming programme to increase (a) eggs (scenario 2B1) and (b) chicken meat (scenario 2B2) production.
Figure 8. The comparison between existing condition, chicken broiler strain programme (scenario 2A), and the modern chicken farming programme (scenario 2B) to fulfil (a) eggs (scenario 2B1) and (b) chicken meat demand (scenario 2B2)
5. Policy implications
In Indonesia, staple protein supply that contributes to food security is largely dependent on chicken meat and eggs. The Indonesian government needs to strengthen its policies to meet the market demands, reduce import and maintain price stability over the coming years. The results of the simulation predict that there could be a shortage of chicken meat and eggs, and a decrease in corn production due to land subsidence. The findings warrant policy implementations to prevent shortages. For policies on corn supply, the findings from the simulation studies show that the tight corn planting system programme has a greater impact than the superior corn seeds to increase corn production and to reduce imports. However, it is recommended to carry out a combined superior corn seeds and a tight corn planting system programme because of the significant increase. Training and provision of seeds for farmers is effective to increase production.
To improve the production of chicken meat and eggs policy, it is advisable for the Indonesian government to implement the modern chicken farming policy more intensively than the chicken strains programme because it can increase productivity of broilers and egg-layer hens more significantly (20–22%). The existence of a programme that is carried out simultaneously will be able to cover possible shortage in the future. Training and providing capital assistance to chicken breeders is also necessary. Government-owned banks need to be encouraged to provide loans for chicken farmers who have undergone professional development training. Chicken strains require biotechnology applications that can only be done for broiler seeds to reduce feed consumption. This programme requires high expertise and modern laboratories. Stimuli for research and development centres, universities and breeding companies are necessary to discover superior chicken strains.
6. Conclusions and future research
Ensuring staple protein supply is important for food safety in Indonesia, which aims not only to meet the market demands but also to reduce the dependence on import and to stabilise prices. This paper explores a System Dynamics (SD) approach of food safety for staple protein to simulate action condition and possibility scenarios. The SD approach was applied to construct a chicken production model for food security system that pays attention to customer demand, feed mill production, and the availability of corn supply. The proposed model is built upon the interaction of the four sub-models.
In this study, the availability of chicken meat and eggs as important staple protein in Indonesia was analysed. Due to the decline in corn production, it is predicted that there will be a shortage of chicken meat and eggs in the future. Two policies are proposed: (a) increasing corn supply and reducing import and (b) increasing the availability of chicken meat and eggs. Four specific scenarios were tested at this leverage point to improve the food security: a superior corn seeds programme; a dense corn planting system; a chicken boiler strain; and a modern chicken farming programme.
The simulated results show that the superior corn seed programme and the dense corn planting system can increase corn production to meet the needs of the animal feed industry, which has an indirect impact on the chicken meat and eggs production. When compared to the superior corn seeds scenario (1B), the tight corn planting system (increase 25%—1A) scenario is more capable of increasing corn production and reducing the demand for imported corn (1B). The planting system scenario (1A) is more recommended than the combined scenario (1A and 1B) because it is more effective in boosting corn production and in reducing corn import till 2035. The government should encourage chicken farmers (both individuals and businesses) to update their poultry farming operations. Modern chicken farming methods can considerably enhance the production yield of chicken meat and eggs to secure staple protein supply. In conclusion, this model can provide better understanding and insights into food security to anticipate shortage issues in the future, and the proposed SD approach can be efficiently used to inform policymakers.
Meat consumption continues to rise annually as human populations grow along with the economy (Godfray et al., Citation2018). The consumption levels as a function of expenditure on chicken meat and eggs are a variable that should be explored in future studies. The study design should be supplemented by a survey of expenditures on chicken meat along with expert judgments. This is consistent with the FAO’s (Citation2015) advice to utilise the findings of a food expenditure survey to determine food availability and food access. Chicken meat and eggs are made available through a sophisticated and dynamic system of corn and chicken farming. Climate conditions, the volume of trade locally, regionally and worldwide, and the extent to which infrastructure is owned should all be considered factors in the future study.
Disclosure statement
No potential conflict of interest was reported by the author(s).
Additional information
Funding
Notes on contributors
Iwan Vanany
All authors have participated sufficiently in the work to take public responsibility for the content, including participation in the concept, design, analysis, and interpretation of the data, writing, or drafting the article or revising of the manuscript. Furthermore, each author certifies that this manuscript has not been submitted to, nor is under review at another journal.
References
- Abidin, Z. (2003). Meningkatkan Produktivitas Ayam Ras Petelur. Agromedia.
- Ahmadvand, A., Bastan, M., & Nasiri, M. (2013). Strategic map explanation dynamics analysis using a system dynamics approach. 9th International Conference on Industrial Engineering, Khajeh Nasir Toosi University of Technology, Tehran, Iran.
- Ariani, M., Suryana, A., Suhartini, S. H., & Saliem, H. P. (2018). Keragaan konsumsi pangan hewani berdasarkan wilayah dan pendapatan di tingkat rumah tangga. Analisis Kebijakan Pertanian, 16(2), 143–28. https://doi.org/10.21082/akp.v16n2.2018.147-163
- Avianto, T. W., Putro, U. S., & Hermawan, P. (2016). System dynamics approach to sustainable food security policy. Actual Problems of Economics, 176(2), 348–357
- Bala, B. K., Alias, E. F., Arshad, F. M., Noh, K. M., & Hadi, A. H. A. (2014). Modelling of food security in Malaysia. Simulation Modelling Practice and Theory, 47, 152–164. https://doi.org/10.1016/j.simpat.2014.06.001
- Bala, B. K., Bhuiyan, M. G. K., Alam, M. M., Arshad, F. M., Sidique, S. F., & Alias, E. F. (2017). Modelling of supply chain of rice in Bangladesh. International Journal of Systems Science: Operations & Logistics, 4(2), 181–197. https://doi.org/10.1080/23302674.2016.1179813
- Bala, B. K., & Hossain, M. A. (2010). Modeling of food security and ecological footprint of coastal zone of Bangladesh. Environment, Development and Sustainability, 12(4), 511–529. https://doi.org/10.1007/s10668-009-9208-1
- Balitbangtan. (2016). Pedoman Pendekatan Pengelolaan Tanaman Terpadu (PTT) Jagung. Departemen Pertanian: Badan Penelitian dan Pengembangan Pertanian.
- Barlas, Y. (1996). Formal aspects of model validity and validation in system dynamics. System Dynamics Review: The Journal of the System Dynamics Society, 12(3), 183–210. https://doi.org/10.1002/(SICI)1099-1727(199623)12:3<183::AID-SDR103>3.0.CO;2-4
- Bastan, M., Abdollahi, F., & Shokoufi, K. (2013). Analysis of Iran’s dust emission with system dynamics methodology. Technical Journal of Engineering and Applied Sciences, 3(24), 3515–3524. https://doi.org/10.1108/K-01-2017-0003
- Bastan, M., Khorshid-Doust, R. R., Sisi, S. D., & Ahmadvand, A. (2018). Sustainable development of agriculture: A system dynamics model. Kybernetes, 47(1), 142–162. https://doi.org/10.1108/K-01-2017-0003
- BPS. (2018a). Peternakan. https://jatim.bps.go.id/subject/24/Peternakan.html#subjekViewTab4%7Caccordion-daftar-subjek3
- BPS. (2018b). Rata-Rata Konsumsi per Kapita Seminggu Beberapa Macam Bahan Makanan Penting, 2007-2018. https://www.bps.go.id/statictable/2014/09/08/950/rata-rata-konsumsi-per-kapita-seminggu-beberapa-macam-bahan-makanan-penting-2007-2017.html
- BPS. (2019a). Laju Pertumbuhan Penduduk menurut Provinsi 1971-2019. https://www.bps.go.id/statictable/2009/02/20/1268/rata-rata-laju-pertumbuhan-penduduk-menurut-provinsi-1971—2019.html
- BPS. (2019b). Nilai Produksi dan Biaya Produksi per Musim Tanam per Hektar Budidaya Tanaman Padi Sawah, Padi Ladang, Jagung, dan Kedelai. https://www.bps.go.id/statictable/2019/04/10/2055/nilai-produksi-dan-biaya-produksi-per-musim-tanam-per-hektar-budidaya-tanaman-padi-sawah-padi-ladang-jagung-dan-kedelai-2017.html
- Chopra, S., Laux, C., Schmidt, E., & Rajan, P. (2017). Perception of performance indicators in an agri-food supply chain: A case study of India’s public distribution system. International Journal on Food System Dynamics, 8(2), 130–145. https://doi.org/10.18461/ijfsd.v8i2.824
- Chung, B. (2018). System dynamics modelling and simulation of the Malaysian rice value chain: Effects of the removal of price controls and an import monopoly on rice prices and self‐sufficiency levels in Malaysia. Systems Research and Behavioral Science, 35(3), 248–264. https://doi.org/10.1002/sres.2477
- Cobb-Vantress. (2018). Cobb 500 broiler performance & nutrition supplement. https://www.cobb-vantress.com/assets/5a88f2e793/Broiler-Performance-Nutrition-Supplement.pdf
- Das, P. K., & Nayak, N. C. (2017). Modelling supply chain of rice, uncertainty factors and strategic supply management. International Journal of Logistics Systems and Management, 27(3), 343–362. https://doi.org/10.1504/IJLSM.2017.084470
- FAO. (2015). The food insecurity experience scale. http://www.fao.org/economic/ess/ess-fs/voices/fiesscale/en/
- FAO. (2020). COVID-19 pandemic - impact on food and agriculture.
- Forrester, J.W. (1961) Industrial Dynamics. MIT Press, Cambridge, Massachusetts
- Godfray, H. C. J., Aveyard, P., Garnett, T., Hall, J. W., Key, T. J., Lorimer, J., Pierrehumbert, R. T., Scarborough, P., Springmann, M., & Jebb, S. A. (2018). Meat consumption, health, and the environment. Science, 361(6399). https://doi.org/10.1126/science.aam5324
- Guma, I. P., Rwashana, A. S., & Oyo, B. (2018). Food security policy analysis using system dynamics: The case of Uganda. International Journal of Information Technologies and Systems Approach (IJITSA), 11(1), 72–90. https://doi.org/10.4018/IJITSA.2018010104
- Gunawan, I., Vanany, I., & Widodo, E. (2019). Cost-benefit model in improving traceability system: Case study in Indonesian bulk-liquid industry. Supply Chain Forum: An International Journal, 20(2), 145–157. https://doi.org/10.1080/16258312.2019.1570671
- Saptana, Ilham, N. (2020). Pengembangan Rantai Pasok Daging Ayam secara Terpadu di Jawa Barat dan Jawa Timur. Analisis Kebijakan Pertanian, 18(1), 41–57. (2020): Analisis Kebijakan Pertanian http://ejurnal.litbang.pertanian.go.id/index.php/akp/article/view/11514/9174
- Investor Daily. (2015). 2016, RI Impor Jagung 2,4 Juta Ton. Kementerian Perindustrian. https://www.kemenperin.go.id/artikel/13892/2016,-RI-Impor-Jagung-2,4-Juta-Ton
- ISA. (2018). ISA brown commercial product guide: North American version. https://www.isa-poultry.com/documents/302/ISA_Brown_cs_product_guide_North_America_L8110-2-NA.pdf
- Balitbang Kemenkes(2019). Kemenkes Tingkatkan Status Gizi Masyarakat. https://www.kemkes.go.id/article/view/19081600004/kemenkes-tingkatkan-status-gizi-masyarakat.html
- Khodeir, M. H., & Abdelsalam, H. M. (2016, May). Simulating corn supply, demand and consumption in Egypt: A system dynamics approach. Proceedings of the 10th International Conference on Informatics and Systems, 14–20. https://doi.org/10.1145/2908446.2908484
- Laucereno, S. F. (2017). Penduduk kelas menengah RI diprediksi tembus 200 juta jid di tahun 2045. DetikFinance. https://finance.detik.com/berita-ekonomi-bisnis/d-3658580/penduduk-kelas-menengah-ri-diprediksi-tembus-200-juta-jiwa-di-2045
- Law, A. M., & Kelton, W. D. (2000). Simulation modeling and analysis (3rd ed.).McGraw-Hill New York.
- Makbul, Y., Faoziyah, U., Ratnaningtyas, S., & Kombaitan, B. (2019). Infrastructure development and food security in Indonesia: The impact of the trans-java toll road on rice paddy farmer’s desire to sell farmland. Journal of Regional and City Planning, 30(2), 140–156. https://doi.org/10.5614/jpwk.2019.30.2.4
- Marcó, A., Rubio, R., Compañó, R., & Casals, I. (2002). Comparison of the Kjeldahl method and a combustion method for total nitrogen determination in animal feed. Talanta, 57(5), 1019–1026. https://doi.org/10.1016/S0039-9140(02)00136-4
- Mardani, M., Nur, T. M., & Satriawan, H. (2017). Analisis usaha tani tanaman pangan jagung di Kecamatan Juli Kabupaten Bireuen. Jurnal Sains Pertanian, 1(3), 210883. https://media.neliti.com/media/publications/210883-analisis-usaha-tani-tanaman-pangan-jagun.pdf
- Moragues-Faus, A., Sonnino, R., & Marsden, T. (2017). Exploring European food system vulnerabilities: Towards integrated food security governance. Environmental Science & Policy, 75, 184–215. https://doi.org/10.1016/j.envsci.2017.05.015
- Muslim, A. (2015). Rice price volatility and its implication to food security in Indonesia. International Journal of Applied Business and Economic Research, 13(7), 4887–4905.
- Namany, S., Govindan, R., Alfagih, L., McKay, G., & Al-Ansari, T. (2020). Sustainable food security decision-making: An agent-based modelling approach. Journal of Cleaner Production, 255(May), 120296. https://doi.org/10.1016/j.jclepro.2020.120296
- Pertiwi, S. (2004). A system dynamics model for policy analysis in food security system in Indonesia. J. Agric. Rural Dev. Trop. Subtrop. Suppl., Conference Paper No. 80, 41–48. http://www.uni-kassel.de/upress/online/frei/978-3-89958-076-1.volltext.frei.pdf#page=63
- Popp, J., Oláh, J., Kiss, A., & Lakner, Z. (2019). Food security perspectives in sub-Saharan Africa. Amfiteatru Econ, 21(51), 361–376. https://www.ceeol.com/search/article-detail?id=763566
- Robinson, S. (1997). Simulation model verification and validation: Increasing the users’ confidence. Proceedings of the 29th Conference on Winter Simulation, 53–59. Aston University, United Kingdom.
- Robinson, S. (2004). Simulation: The practice of model development and use (Vol. 50). Wiley Chichester.
- Rusono, N., Sunari, A., Muharam, A., Avianto, N., Martino, I., Susilawati, T., & Hadi, P. U. (2015). Penyusunan RPJMN 2015-2019 Bidang Pangan dan Pertanian. https://www.bappenas.go.id/files/1914/4299/8417/Penyusunan_RPJMN_2015-2019_Bidang_Pangan_dan_Pertanian.pdf
- Sahle, M., Yeshitela, K., & Saito, O. (2018). Mapping the supply and demand of Enset crop to improve food security in Southern Ethiopia. Agronomy for Sustainable Development, 38(1), 1–9. https://doi.org/10.1007/s13593-017-0484-0
- Samsuddin, N. S., Sharaai, A. H., & Ismail, M. M. (2015). Sustainability of chicken meat production in achieving food security in Malaysia. Advances in Environmental Biology, 9(23), 1–6.
- Sarno, S., & Hastuti, D. (2007). Sistem Pengadaan Pakan Ayam Petelur Di Perusahaan “Populer Farm” Desa Kuncen Kec. Mijen Kab. Semarang. Mediagro, 3(1), 49-58. https://publikasiilmiah.unwahas.ac.id/index.php/Mediagro/article/view/540
- Senge, P. M., & Forrester, J. (1980). Tests for building confidence in system dynamics models. System Dynamics, TIMS Studies in Management Sciences, 14, 209–228. http://static.clexchange.org/ftp/documents/roadmaps/RM10/D-2926-7.pdf
- Shannon, R. E. (1998). Introduction to the art and science of simulation. 1998 Winter Simulation Conference. Proceedings (Cat. No. 98ch36274),Washington, DC, USA, 1, 7–14.
- Shreckengost, R. C. (1992). Dynamic Simulation Models: How Valid Are They (D-4463). System Dynamics in Education Project, System Dynamics Group, 1–11
- Sterman, J. D. (2000). Business dynamics: Systems thinking and modeling for a complex world. McGraw-Hill Inc.
- Suryani, E., Dewi, L. P., Junaedi, L., & Hendrawan, R. A. (2020). A model to improve corn productivity and production. Journal of Modelling in Management, 15(2), 589–621. https://doi.org/10.1108/JM2-11-2018-0181
- Sutoro, Y., & Soeleman, I. (1988). Budidaya Tanaman Jagung. Penyunting Subandi, M. Syam Dan A. Widjono. Puslitbang Tanaman Pangan, Bogor.
- Tangendjaja, B. (2019). Prof Budi Tangendjaja: Pengelolaan Ayam Modern Sebagai Pabrik Biologis. Trobos Livestock. http://troboslivestock.com/detail-berita/2019/07/01/50/11803/prof-budi-tangendjaja-pengelolaan-ayam-modern-sebagai-pabrik-biologis
- Tey, Y. S., Ibragimov, A., Abduraupov, R., Makhmudov, M., Brindal, M., & Sidique, S. F. (2019). Moving smallholders up rice value chain: A system dynamics approach. British Food Journal, 122(3), 852–869. https://doi.org/10.1108/BFJ-08-2019-0632
- Tong, H., & Qu, W. (2011). Energy consumption and CO 2 emissions of beijing heating system: Based on a system dynamics model. International Conference on Software Engineering and Formal Methods, 476–485. Montevideo, Uruguay.
- Tsolakis, N., & Srai, J. (2017). A system dynamics approach to food security through smallholder farming in the UK. Chemical Engineering Transactions, 57, 2023–2028. https://doi.org/10.3303/CET1757338
- van der Heijden, L. H., Graeve, M., Asmus, R., Rzeznik-Orignac, J., Niquil, N., Bernier, Q., Guillou, G., Asmus, H., & Lebreton, B. (2019). Trophic importance of microphytobenthos and bacteria to meiofauna in soft-bottom intertidal habitats: A combined trophic marker approach. Marine Environmental Research, 149(August), 50–66. https://doi.org/10.1016/j.marenvres.2019.05.014
- Vanany, I., Maftuhah, D. I., Jaelani, L. M., Hajar, G., & Utami, N. M. C. (2019). Modeling of chicken production for food security in Indonesia. 2019 IEEE International Conference on Industrial Engineering and Engineering Management (IEEM), 627–631.Macau, China, IEEE, https://doi.org/10.1109/IEEM44572.2019.8978877
- Vieira, L. C., Serrao-Neumann, S., Howes, M., & Mackey, B. (2018). Unpacking components of sustainable and resilient urban food systems. Journal of Cleaner Production, 200, 318–330. https://doi.org/10.1016/j.jclepro.2018.07.283
- Worldometer. (2019). World Population. http://www.worldometers.info/world-population/
- Xu, Y., & Szmerekovsky, J. (2017). System dynamic modeling of energy savings in the US food industry. Journal of Cleaner Production, 165, 13–26. https://doi.org/10.1016/j.jclepro.2017.07.093
- Zuprizal. (2019). Pakan Pegang Peranan Penting Dalam Peternakan Ayam. Fakultas Peternakan UGM. https://fapet.ugm.ac.id/id/pakan-pegang-peranan-penting-dalam-peternakan-ayam/