
 ?Mathematical formulae have been encoded as MathML and are displayed in this HTML version using MathJax in order to improve their display. Uncheck the box to turn MathJax off. This feature requires Javascript. Click on a formula to zoom.
Abstract
Regulators are commonly used to control and measure the flow in streams and irrigation canals. The number of opened gates and their arrangements significantly affected the flow characteristics downstream (DS) of multi-gate regulators. For the first time, an Artificial Neural Network (ANN) is utilized to forecast the relative energy loss of the submerged hydraulic jump (H.J) generated DS of multi-gate regulators under various arrangements of opened gates. The data used for training the network was collected from experimental work conducted at the Hydraulic Research Institute (HRI) on a model of a regulator with five vents. Different flow conditions and different expansions are used through the experimental program. Seventy percent of the data is used to train the network, while the rest of the data is used to validate and test the developed ANN model. A tanh activation function is used in the hidden layer of the ANN network, which consists of 8–11-1. The determination coefficients (R2) and MRAE of the ANN model were 0.9278 and 0.016, respectively. Also, an empirical prediction equation is developed using statistical multiple line regression (MLR). The results show that ANN is more accurate than MLR and the preceding theoretical model. The ANN model can be utilized to determine the optimal multi-gate operation scenario for multi-vent regulators.
Short summary
This study aims to incorporate the artificial intelligence methodology as a modern modeling method for predicting downstream flow characteristics under multi-gate management and operating types. In the current analysis, the Artificial Neural Network (ANN), in particular, is used in combination with experimental findings to predict the relative energy loss of the submerged hydraulic jump (H.J) occurring downstream (DS) of multi-gate hydraulic structures within the various gate operation cases. Results indicate that ANN is much more efficive in modeling the relative energy los than the multiple linear regression (MLR) and the previous theoretical model.
Public interest statement
Regulators with multi-gates are often used in Egypt. Gate method of operation affects the downstream flow characteristics of multi-gate regulators. This study aims to incorporate a modern modeling method for predicting downstream flow characteristics under multi-gate management and operating types.
1. Introduction
The DS flow characteristics of multi-gate hydraulic structures are specified by gates operation schemes. During maintenance, one or more vents in multi-vent structures, such as regulators, may be opened or closed. As a result, the type of gates operation can be symmetric or asymmetric, and the flow characteristics are affected accordingly. Fahmy (Citation2001) investigated the effect of the gates’ operational schemes on the flow conditions downstream of a three-sluice gate regulator model. The research was carried out under the condition of a free hydraulic jump. Abdel-Aal et al. (Citation2004) investigated the properties of free H.J generated in the radial stilling basins of hydraulic multi-gate structures. Theoretical models were developed for various types of multi-gate operations. The submerged hydraulic jump DS of hydraulic multi-gate structures was investigated by Sauida (Citation2009). Theoretical models were developed to estimate the relative depth ratio and relative energy loss for various multi-gate operation schemes. Daneshfaraz et al. (Citation2016) simulated different gates, such as sharp-edged downstream, sharp-edged upstream, rounded-edged, simple-edged, and jagged-edged using fluid dynamics software. Because one of the important gate applications is to measure downstream flow, the present study provides a more accurate measurement of flow under various conditions. One of the essential parameters in the characterization of flow under a gate is the Cd. The present study shows that the change in the gate edge affects the Cc and, consequently, the discharge of flow. Sauida (Citation2016a) investigated the flow separation phenomenon DS of regulators with multiple gates. He proposed an empirical model for calculating the dimensionless length of separation for different side gate operation schemes. Shayan et al. (Citation2017) investigated the different methods for modeling the flow rate of the radial gates spillway. An empirical equation was proposed for modeling the discharge of multi-gate spillways. Chen et al. (Citation2020) carried out experiments for various enlargement ratios in the cross-section downstream of the hydraulic multi-gates structure and gates Froude numbers. It is concluded that the degree of deflection increases significantly along the longitudinal direction for all the enlargement ratios except the smallest.
For multi-gate operation decision-makers, accurate simulation and prediction of flow characteristics DS multi-gate hydraulic structures are essential. Previous research has revealed that only a few studies have been conducted to simulate the submerged flow behavior of DS multi-gate regulators. As a result of the importance of this work, the relative energy loss of submerged H.J DS of regulators with multi-gates in the presence of a sharp radial current deflector is modeled using ANN.
1.1. ANN applications
Artificial neural networks are applied in many branches of hydraulics and water engineering. Negm et al. (Citation2002) investigated an artificial neural network model to predict the characteristics of spatial hydraulic jumps formed during sudden asymmetric expansion and in symmetric diverging channels. It was found that the neural network model is much better than the other developed models.
Omid M.H. & Esmaeili Varaki, M. (Citation2005) adapted an ANN to model the conjugate depth and the jump length in gradually expanding stilling basins. The results show the proposed ANN models could provide the desired accuracy in predicting the conjugate depth and jump length. Güven et al. (Citation2006) utilized ANN to forecast the mean pressure fluctuations under the hydraulic jump (B-jump) in sloping stilling basins. The results of the developed ANN model proved that this technique is reliable in such a field compared with previously developed methods. Salmasi (Citation2010) developed a procedure using an artificial neural network (ANN) for modeling the energy dissipation of flow over a stepped spillway chute. The results indicate that the ANN is a powerful tool for estimating hydraulic characteristics of flow over stepped spillways with a skimming regime. Bonakdari et al. (Citation2011) presented a numerical analysis and prediction of the flow field in a 90o bend using ANN. The results of ANN indicated that the velocity field was predicted with good approximation.
Salazar et al. (Citation2013) analyzed the flow rates from the radial-gated spillway of the Oliana Dam. They used ANN to allow for real-time discharge predictions within the reservoir’s operating range in any situation of energy head and gate opening. Hidayat et al. (Citation2014) used ANN to model water level details that will be discharged from river gage stations. The optimized hindcast model based on ANN gives a good prediction of the discharge, as demonstrated by consistent training and validation periods. Al.Suhili et al. (Citation2014) used ANN to model the discharge coefficient for a weir with three rectangular bottom openings as a function of various geometric and flow variables. The results of the ANN model accurately predict the discharge coefficient with a correlation coefficient range of (0.999–0.941). Abdeen et al. (Citation2015) utilized artificial neural networks (ANN) in conjunction with experimental data to predict the length of the hydraulic jumps that occurred in spillways, and consequently, the stilling basin dimensions can be designed for adequate energy dissipation. In a detailed fashion, the study showed the development process of different ANN models to accurately predict the hydraulic jump lengths acquired from other experimental studies. Sauida (Citation2016b) used ANN to develop a prediction model to predict the relative length of submerged hydraulic jump DS of regulators with multi-gates under various open gates arrangements. The ANN model efficiently predicts the relative length of submerged HJ DS of regulators with multi-gates better than the MLR model. Ayaz and Mansoor (Citation2018) developed two different ANN models to estimate the discharge coefficient of an oblique sharp-crested weir for free and submerged flow. The proposed ANN model is an effective and robust tool for predicting discharge coefficients of oblique sharp-crested weirs. Roushangar and Homayounfar (Citation2019) investigated using a new data mining approach, a support vector machine, for predicting the length and the sequent depth ratio of different types of hydraulic jumps in rectangular channels. The used meteorological data sets to develop the models are obtained from previous credible research. The outputs from the proposed SVM method were compared with the achieved values by the other analytical and semi-empirical equations. The results demonstrate that the SVM-based models surpass the mentioned empirical and semi-empirical equations in predicting the jump’s length and sequent depth ratios in the free and submerged jumps. Baharvand et al. (Citation2020) developed a non-linear regression algorithm to predict the sequent depth ratio of hydraulic jumps over a smooth and rough bed surface using experimental hydraulic data extracted from previous studies. The results show that the proposed model increases the correlation between observed and predicted values up to 0.987 and decreases the RMSE to 0.324. Nasrabadi et al. (Citation2021) An experimental study was conducted in a rectangular flume with a length of 9 m, a width of 0.5 m, and a depth of 0.45 m in a wide range of Froude numbers and submergence ratios. The data was then normalized and divided into two parts: training and testing. A new technique was used to predict the submerged hydraulic jump characteristics. The results showed that the model estimated the relative submergence depth, jump length, and relative energy loss with an accuracy of R2 = 0.9944 and MAPE = 0.038, R2 = 0.9779 and MAPE = 0.0387, and R2 = 0.9932 and MAPE = 0.0192, respectively. Daneshfaraz et al. (Citation2021) investigated the application of support vector machine algorithms for predicting hydraulic parameters of a vertical drop equipped with horizontal screens. The study incorporated varying sizes of a rectangular channel. In addition to being able to dissipate the destructive energy of the flow, horizontal screens cause turbulence.
This paper presents the results of using the ANN technique to build a prediction model of the relative energy loss of submerged H.J DS of regulators with multi-gates in the presence of a sharp radial current deflector and for the expansion ratio (e) range of (1.25–7.00). These results of the ANN model were compared with the statistical one and the theoretical one of Sauida (Citation2009).
2. Theoretical analysis
The basic variables are shown in in a definition sketch for the experimental model. The relevant parameters are as follows:
Figure 1. Definition sketch for submerged flow DS of multi-gate regulators.
Where: V is the mean velocity at the vena contracta, is the water density, B is the total width of the channel, is the sum of the widths of the deflectors from the side view projection, bt is the width of the opened vents, Y1 is the depth of water at the vena contracta, Y3 is the backup water depth, Yt is the tailwater depth, E1 is the energy loss at the vena contracta, E2 is the energy loss at the tailwater depth, is the dynamic viscosity of water, η is a factor related to flow conditions (symmetric or asymmetric flow), ή is a factor associated with the operating system of gates, Zd is the height of the deflector, Ψ is the central angle of the deflector, Lb is the basin length, and Ld is the distance between the current deflector and the beginning of the basin.
Using Π- theorem and considering ( and Y1) as the independent variables, and by neglecting the effect of Rn and (constant value = 4), EquationEq. (1
(1)
(1) ) takes the following form:
Where: e is the expansion ratio (e = B/bt), bt is the width of the working vent, EL = E1-E2, and F1 is the Froude number at vena contracta.
3. Experimental collection of training data
This work was carried out in the Hydraulic Laboratory of the Hydraulics Research Institute (HRI), Delta Barrage, Egypt. The experiments were carried out using a 1.75 m wide, 15.0 m long, and 0.468 m deep flume that simulated new Assuit Barrages. An ultrasonic flowmeter was mounted on the model feeding pipeline to measure the passing discharge into the model. Point gauges were installed within the model to monitor water surface levels along with the model. The tailwater depth is measured by a tailgate located at the downstream end of the flume. The middle portion consists of five adjacent vents, each 25 cm wide, 36 cm deep, and 85 cm long. The pier width was 10 cm, and the wing wall was 5 cm wide. Pezaform sluice gates were used to control the depth of the upstream water and the opening of the gates. A total of 1166 tests are available. Different gate operational schemes under several hydraulic conditions were tested. The flow rate is ranged between (Q = 10–40) L/sec, the initial Froude number is ranged between (F1 = 2.0–5.5), and the submergence ratio (S = 4). The pump was turned on, and the control valve adjusted the flow to the required value, which was then measured by the ultrasonic flow meter. The openings of the gates and the depth of the backup water were adjusted to meet the required test conditions. After reaching stability, the tailwater depth was measured. The deflector models have been changed and examined as follows: The deflector positions were examined as (Ld/Lb) = 0.10, 0.20, 0.40, 0.60, and 0.80. Moreover, five deflection-angles of the deflector (Ψ) of 5°, 20°, 45°, 70°, and 90° and three deflector relative heights (Zd/Y1) of 1.43, 1.90, and 2.38 were tested. Finally, five relative deflector-width (/B) of: 0.20, 0.40, 0.50, 0.80, 1.00 were tested.
4. Relative energy ratio modelling using (MLR)
In the current study, multiple linear regression (MLR) was used to predict the relative energy loss of the submerged multi-gate regulators for all operational cases. The statistical equation used 70% of all experimental data at random to form the regression coefficients, and the remaining 30% of the experimental data was used for validating and testing the developed model. The statistical equation of EL/E1 was created as: (3)
The values of (ŋ, ή) are shown in . Eq. 3 has a square correlation coefficient (R2) of 73.9% and (MRAE) = 0.0382.
Table 1. Values of (ŋ, ή) of EquationEq. (2)(2)
(2)
5. Prediction of relative energy loss using (ANN)
5.1. Brief Review of (ANN) Basics
ANN has a remarkable ability to learn complex data patterns that simulate the human ability to solve complex issues. So, neural computation is based on how biological systems work, such as the human brain. The human brain consists of many neurons. Each brain cell is linked to many others within a network that adopts as the brain learns. In neural computing, neurons are replaced by processing elements (PE), and these PEs are linked together to form neural networks. Each PE carries out a simple task. The links between PEs allow neural networks to learn patterns through the weights associated with PEs.
The ANN tool used throughout this study is multi-layer perceptrons (MLP), a neural network modeling tool designed for prediction and forecasting applications, according to Neural Connections (Citation1998). The fundamental MLP sequence can be summarized in the steps below:
Learn from examples by supplying the data to the neural network through an input layer consisting of many neurons equals the number of input variables, so each PE represents a single variable,
These data are processed in a second layer called the hidden layer, in which all the processing through this layer is hidden, and
The processed data is sent to the output layer, which consists of a number of PEs equal to the number of targets.
5.2. Training of ANN
ANN consists of several layers, each composed of one or more units (neurons). Each of the units of the first layer (input layer) receives input data from an independent variable. Each input is multiplied by the weight of the link, and the result is transmitted to the corresponding hidden layer unit where the activation function is applied. The results from the hidden layer are passed to the output layer by multiplying the output of each hidden layer neuron by the corresponding weight of the connection between hidden and output neurons. The output layer produces the network output for further processing of data. At this point, to calculate the error, the network output is compared to the target output. If the error is not acceptable, the connection weights are adjusted starting from the output layer and propagating backward. Once the weights are updated, new iterations begin until training is completed. The training is stopped when the error level is reached or when the permitted iterations are exceeded. But training should stop when the validation-system error reaches a minimum and increases (to avoid network over-training). If the training is stopped before this point, the network may be under-trained.
In the present research, a typical network of size 8–11-1 is built. There are three layers in this network. Input layers of 8 neurons and 8 PEs to represent the variables. An output layer for the output variable (EL/E1). The hidden layer receives the input, carries out the calculations, and sends the outputs to the output layer. The tanh activation function in the hidden layer is used to modify the input to the neuron.
5.3. ANN model developments
All measurement data is utilized for modeling the target (EL/E1). (8 input fields, one target field, and 1166 observations). The ANN model size of 8–11-1 was found to be appropriate for the precise generalization of the relative energy loss values of DS multi-gate hydraulic structures in this study. The developed network to model the current application is shown in . An input layer with eight neurons was used in the ANN network, with one corresponding to each of the input parameters and an output layer consisted of one neuron representing the output parameter (EL/E1). A transfer function of the hyperbolic-tangent type was used in all cases. The data were divided into three groups: i) Training data for network training, 816 data vectors. ii) Validation data set for measuring network performance, 175 data vectors. iii) Test data for testing the network by generating outputs (EL/E1) from only known inputs, 175 data vectors. Many computer experiments have tried to obtain the best range of initial weight, the best activation function, the best number of neurons in the hidden layer, and the best number of iterations. After many computer experiments, the initial weights for the links between neurons for network training were obtained in the range of (±) 0.4, as shown in . As shown in , trials were used to determine the activation function. The tanh function was discovered to be the most significant function. In addition, as indicated in , the number of neurons in the hidden layer (n = 11) was selected by solving the application multiple times. Finally, as shown in , the maximum iteration number (i = 400) was determined through trial and error.
Table 2. The statistical parameters of weights for all data cases
Table 3. The statistical parameters of activation functions for all data cases
Table 4. The statistical parameters of topology for all data cases
Table 5. The statistical parameters of no. of iterations for all data cases
Figure 2. The developed ANN model of size 8–11-1 to estimate the relative energy loss of multi-gate regulators.
The best network is allowed to train several times (6 times in this paper) with a different starting point until a global solution is obtained. The results are presented in . The values of R2 are mostly very close, as well as the values of MRAE for all conducted experiments, indicating the high stability of the network.
Table 6. The statistical parameters of seeds for all data cases
A sensitivity analysis was also conducted by performing several computer experiments by removing one different variable in each run and keeping the other seven variables as inputs to the network, i.e., the new network was 7–11-1 in each case. The results of these experiments were compared to the results of the best network, 8–11-1. It was found that the effect of the variables on (EL/E1) decreases according to the following order: . This means that the most significant effect was due to F1, while the lowest effect was due to Ψ. Compared to the best network, 8–11-1, and considering the test data set, removing F1 reduces the R2 to 62.19% instead of 92.37% and increases MRAE by 0.036 for the best network while removing Ψ reduces R2 by only 0.6% and rises MRAE by 0.0005.
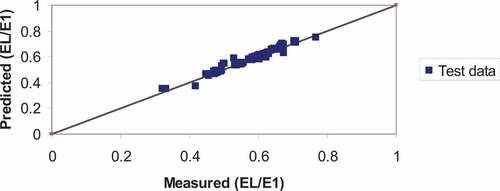
The outputs of the best network are compared to the measured data. The values of the correlation coefficient and mean relative error for training, validation, and test data were (0.9490, 0.0137), (0.9055, 0.0171), and (0.9278, 0.0159) respectively. shows the comparison between the prediction of the best network (8–11-1) and the experimental data for the test data set. The figure indicated that fair agreement was obtained and the outputs of the developed network are well compared to the measured data.
Figure 3. Experimental data versus the ANN model estimation of (EL /E1) for the test data set.
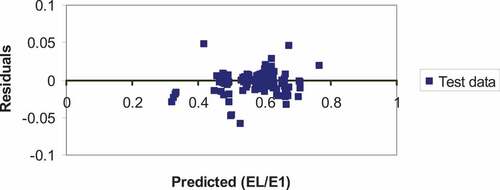
The variation of the residuals of the test data is presented in versus the predicted values using the developed network. The figure shows the asymmetrical distribution of the residuals around the zero error line, indicating the residuals’ randomness nature. The high scatter of these residuals demonstrates that they are uncorrelated to the network output (correlation = 0.0424), proving the validity of using the developed ANN model to predict the relative energy loss downstream of the multi-gate regulators.
Figure 4. Variation of the residuals with the predicted (EL/E1) values of ANN for the test data set.
6. Comparisons
The prediction efficiency of the developed ANN model (EL/E1) was compared to that of the MLR model and the previously developed theoretical model Sauida (Citation2009). The experimental and residual data were compared to ANN, MLR, and theoretical models for (EL/E1) as shown in . A precise inspection of these figures shows that the results of the ANN model are better than those of the statistical and theoretical models. High R2 values were obtained by 19% and 26%, respectively, compared to the MLR model and theoretical model, while low MARE values were obtained by 0.022 and 0.027.
Figure 5. Comparing the prediction values of ANN model, MLR model, and theoretical model with the experimental data for the test data set.
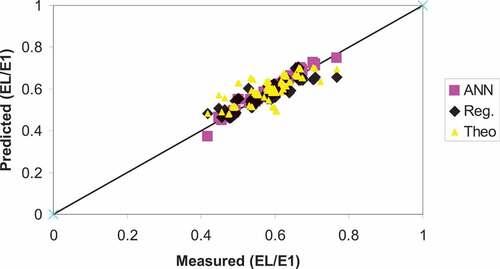
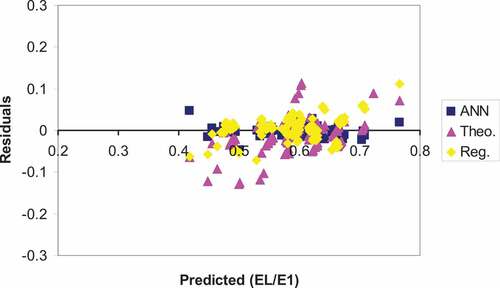
Figure 6. Variation of the residuals with the predicted (EL/E1) values of ANN model, MLR model, and Theoretical model for the test data set.
7. Conclusions
Multi-gate regulators are widely used in Egypt. Prediction of flow characteristics is essential for multi-gate operation decision-makers. The Artificial Neural Network (ANN) is used to predict the relative energy loss of submerged H.J DS regulators of multi-gates and for expansion ratio (e) range (1.25–7.00). The work was based upon an experimental study carried out on a regulator model with five vents. The measured data was used to train, verify and test the ANN model. The determination coefficient (R2) and mean relative absolute error (MRAE) of predicted outputs were 0.9278 and 0.016 for the optimum configuration of the ANN model. The ANN model proved a powerful prediction tool in predicting the relative energy loss downstream of multi-gate regulators compared to MLR and previous theoretical models. ANN model can be used to determine the optimal multi-gate operation scenario for multi-gate regulators. It is suggested that more research be done on multi-gate hydraulic structures with varying vents and expansion ratios. Carry out the same experiment for the free hydraulic jump.
Abbreviations
ANNArtificial Neural Network.DSDownstream.H.JHydraulic Jump.MARE Mean Absolute Relative ErrorMAPE Mean Absolute percentage ErrorMLP Multi-Layer Preceptions.MLRMultiple Linear Regression.RMSE Relative Mean square errorPEProcessing Element.
Notations
B: Width of channel [L];
bt: Total width of the opened vents [L];
: Sum of the widths of the deflectors from Side view projection [L];
e: Expansion ratio, B/bt [-];
E1: Energy loss at vena contracta [L];
E2: Energy loss at tail water depth [L];
F1: Inflow Froude number [-];
Lb: Basin length [L];
Ld: Distance between the current deflector and the beginning of the basin [L];
n: No. of the working vents [-];
Q: Discharge [L3.T−1];
S: Degree of submergence, Y3/Y1 [-];
Y1: Initial depth of the jump [L];
Y3: Back up water depth just downstream the gate [L];
Yt: Tailwater depth at the end of the jump [L];
Zd: Height of deflector [L];
γ: Specific weight [M.L−2.T−2];
η: Factor related to flow condition [-];
ή: Factor related to the operating system of gates [-];
Ψ: Central angle of deflector [-];
Disclosure statement
No potential conflict of interest was reported by the author(s).
Additional information
Funding
References
- Abdeen, M., Abdin, A., Abaas, W., & Shukla, S. (2015). Simulation and prediction of energy dissipaters and stilling basins design using artificial intelligence technique. Journal of Cogent Engineering, 2(1), 1018705. https://doi.org/10.1080/23311916.2015.1018705
- Abdel-Aal, G. M., Elfiky, M. M., & Negm, A. M. (2004), “Analysis of free hydraulic jump characteristics ds multi-vent regulators”, scientific bulletin, faculty of engineering, Ain Shams University, Cairo, Egypt, Vol. 39, 3. 475–12, September 30.
- Al.Suhili, R. H., Al.Bidhani, J. H., & Al.Mansori, N. J. (2014). Hydraulic characteristics of flow over rectangular weir with three rectagular openings using ANN. Journal of Babylon University, 4(22), 959–970.
- Ayaz, M., & Mansoor, T. (2018). Discharge coefficient of oblique sharp crested weir for (322) free and submerged flow using trained ANN model. Water Science Journal, 32(2), 192–212. https://doi.org/10.1016/j.wsj.2018.10.002
- Baharvand, S., Jozaghi, A., Fatahi-Alkouhi, R., Karimzadeh, S., Nasiri, R., & Lashkar-Ara, B. (2020). Comparative study on the machine learning and regression-based approaches to predict the hydraulic jump sequent depth ratio. Iranian Journal of Science and Technology, Transactions of Civil Engineering, 1–14. https://doi.org/10.1007/s40996-020-00526-2
- Bonakdari, H., Baghalian, S., Nazari, F., & Fazli, M. (2011). Numerical analysis and predicion of the velocity field in curved open channel usin artificial neural network and genetic alogrithm. Journal of Engineering Applications of Computational Fluid Mechanics, 5(3), 384–396. https://doi.org/10.1080/19942060.2011.11015380
- Chen, Y., Yang, J., Yu, J., Fu, Z., & Chen, Q. (2020). Flow expansion and deflection downstream of a symmetric multi-gate sluice structure. KSCE Journal of Civil Engineering, 24(2), 471–482. https://doi.org/10.1007/s12205-019-1080-4
- Daneshfaraz, R., Aminvash, E., Ghaderi, A., Abraham, J., & Bagherzadeh, M. (2021). SVM performance for predicting the effect of horizontal screen diameters on the hydraulic parameters of a vertical drop. Applied Sciences, 11(9), 4238. https://doi.org/10.3390/app11094238.
- Daneshfaraz, R., Ghahramanzadeh, A., Ghaderi, A., Joudi, A. R., & Abraham, J. (2016). Investigation of the effect of edge shape on characteristics of flow under vertical gates. Journal-American Water Works Association, 108(8), E425–E432. https://doi.org/10.5942/jawwa.2016.108.0102
- Fahmy, M. R. (2001). Design of stilling basins downstream of multi-vents regulators. Unpublished Ph. D., Faculty of Engineering, Zagazig University.
- Güven, A., Günal, M., & Çevik, A. (2006, November). Prediction of pressure fluctuations on sloping stilling basins. Canadian Journal of Civil Engineering, 33(11), 1379–1388. https://doi.org/10.1139/l06-101
- Hidayat, H., Hoitink, A., Sassi, M., & Torfs, P. (2014). Prediction of discharge in a tidal river using artificial neural networks. Journal of Hydrologic Engineering, 19(8), 4014006. https://doi.org/10.1061/(ASCE)HE.1943-5584.0000970
- Nasrabadi, M., Mehri, Y., Ghassemi, A., & Omid, M. H. (2021). Predicting submerged hydraulic jump characteristics using machine learning methods. Water Supply, 13(5), 674. https://doi.org/10.2166/ws.2021.168
- Negm, A. M., Ibrahim, A. A., Abdel-Aal, G. M., & El-Saiad, A. A. (2002). Modeling of characteristics of hydraulic jumps at asymmetric sudden expansions and symmetric divergence using neural networks. Scientific Bulletin, Faculty of Engineering, Ain Shams University, Faculty of Engineering, Cairo, Egypt, 37(4), 195–219.
- Neural Connections. (1998). Artificial neural networks software and user manuals. SPSS Inc./Recognition Systems Inc.
- Omid, M. H, & Esmaeili Varaki, M. (2005). A neural network model to predict characteristics of gradually expanding hydraulic jumps. Journal of Agricultural Sciences and Natural Resources, August-September, 12(3), 21–32. https://doi.org/10.1680/wama.2005.158.2.65
- Roushangar, K., & Homayounfar, F. (2019). Prediction characteristics of free and submerged hydraulic jumps on horizontal and sloping beds using SVM method. KSCE Journal of Civil Engineering, 23(11), 4696–4709. https://doi.org/10.1007/s12205-019-1070-6
- Salazar, F., Morán, R., Rossi, R., & Oñate, E. (2013). Analysis of the discharge capacity of radial-gated spillways using CFD and ANN – Oliana Dam case study. Journal of Hydraulic Research, 51(3), 244–252. https://doi.org/10.1080/00221686.2012.755714
- Salmasi, F. (2010). An Artificial Neural Network (ANN) for hydraulics of flows on stepped chutes. European Journal of Scientific Research, 45(3), 450–457.
- Sauida, M. F. (2009)., “Characteristics of flow in diverging stilling basin downstream of regulators under vertical deformation conditions”, Unpublished Ph. D., Faculty of Engineering, Zagazig University.
- Sauida, M. F. (2016a), Length of flow separation. Proc. Of the international conference on Advances in Civil, Structural, and Construction Engineering- CSCE 2016, 18-19 August, 2016, Italy.
- Sauida, M. F. (2016b). Prediction of hydraulic jump length downstream of multi-vent regulators using Artificial Neural Networks. Ain Shams Engineering Journal, 7(2), 819–826. https://doi.org/10.1016/j.asej.2015.12.005
- Shayan, H. K., Farhoudi, J., Aminpoor, Y., & Seyedzadeh, A. (2017), “Eeffctive parameters for calculating the discharge of spillway with radial gates at large dams. Long- Term Behaviour and Environmentally Friendly Rehabilitation Technologies of Dams (LTBD 2017), https://doi.org/10.3217/978-3-85125-564-5-042.