
 ?Mathematical formulae have been encoded as MathML and are displayed in this HTML version using MathJax in order to improve their display. Uncheck the box to turn MathJax off. This feature requires Javascript. Click on a formula to zoom.
Abstract
Electric grids are constantly expanding, and supervisory control and management methods must also be improved and changed in order to maintain reliable and safe power supply to consumers. This article proposes a methodology for supporting the adoption of dispatch decisions on the base electrical load forecasting. The energy consumption forecast is based on a deep neural network, and depending on the value obtained, a recommendation for optimising the operation of the energy system is proposed. Thus, dispatch service employees will be able to make decisions on managing the energy system based on the recommendations received, which will increase the speed of decision-making and improve the efficiency of the entire dispatch centre. Also, intelligent data processing and the proposed decisions allow us to consider and compare the factors that may be missed because of the human factor when the information is processed directly by the dispatcher. The use of retrospective data about the consumed power, the ambient temperature, and the type of day of the week is proposed as a knowledge base for forecasting energy consumption and training a neural network. The proposed neural network made it possible to achieve a value of the average absolute error of MAPE prediction of 1.922%. The obtained accuracy allows the use of forecasting results for dispatch control.
PUBLIC INTEREST STATEMENT
Electricity grids are complex, versatile system that require constant monitoring and control for reliable and stable operating. This article proposes a method with which it is possible to calculate the consumption of electrical energy in advance, that is, to predict consumption for the next day. Then, based on the prediction, create a scheme of the electricity supply to consumers, which allows production at the right time and distribute a sufficient amount of energy at the required quality. In this research, predicting was carried out using artificial intelligence, namely artificial neural networks. The advantage of neural networks over other predicting methods is the ability to work with incomplete raw data and without the need to create a complex mathematical model.
1. Introduction
One of the most important tasks in the field of electric power industry is to provide consumers with the electric energy on the reliable and stable base. Due to the rapid economic development, the structure and scale of power grids are becoming increasingly complex and the operation and management of large power grids are facing more serious problems. The human factor, equipment failures, natural disasters, and other internal and external factors can pose a great threat to safe and stable operation of the power system. The traditional protection strategy based on local information can no longer satisfy the needs of safe and stable operation of complex power systems (Jiao & Fushuan, Citation2008).
All power system equipment necessary for the production and further distribution of electricity is controlled by the dispatching services of the power system entities or directly by operational personnel. The control objective of the power control centre is to maintain nominal frequency and be sure that all facilities are operated under a normal situation. If there is a fault event, quick actions are needed to release the fault as well as minimise the number of customers affected/blackout area (Liu et al., Citation2013). Almost all power supply control centres in the world use the supervisory control and data acquisition systems (SCADA), power failure analysis and processing systems (PFAP), error registration systems, etc. in order to monitor, analyse, and manage power systems. SCADA/EMS main concepts and structures were laid down in the 1970–1980s, and the amount of data collected by the system and available to the operator was limited (Kropp, Citation2006; Luo, Citation2004; Wu et al., Citation2016). With the latest generations of SCADA/EMS, the data available to the system operator have increased exponentially (Liu et al., Citation2013).
In emergency situations and malfunctions, due to the lack of unified comprehensive tools for processing and analysing data about malfunctions, the influx of information makes it difficult for operators to filter information accurately and identify malfunctions, and the dispatcher is unable to accurately judge a malfunction, find useful information, analyse the distribution of power flow, redistribute the flow power, and change the network topology, that is, perform the analysis in accordance with a large amount of data, which leads to the fact that he loses time to deal with failures and causes of an accident (Wu et al., Citation2016), (Liu et al., Citation2013), (Chen et al., Citation2018). So, the inefficiency of the analysis depends on the experience of the person (Luo, Citation2004).
On the other hand, the use of various information and automated systems in the energy sector has accumulated a significant amount of statistical data that characterise various aspects of equipment operation: the values of various technological parameters, information about registered defects and malfunctions, and additional heterogeneous information. These data can be used to obtain new knowledge about energy facilities, create management systems, and support decision-making (Andryushin et al., Citation2019), (Lu, Citation2017). The latest developed information and communication technologies provide a platform for improving the functions and performance of power management centres (Kropp, Citation2006).
The issue of improving the quality of the energy system functioning becomes a need for accurate decision-making, which is increasing (Hemmati et al., Citation2020).
In order to operate a complex system safely, such as a large-scale power system, it is necessary to consider the human factor and visualisation methods when designing a control centre in order to improve the performance and decision-making of the system operator in emergency situations (Liu et al., Citation2013). Contemporary problems with the electrical grid require innovative solutions that include various methods of machine learning and network sciences (Giannakis et al., Citation2013).
Also, in the traditional grid management, the grid operator must always maintain the balance between supply and demand to avoid security grid problems and economic losses. The grid operator uses a planning to ensure that power plants produce the right amount of electricity at the right time to meet consistent and reliable electric demands (Fentis et al., Citation2019).
Load is fundamental and vital information for power generation facilities and traders, especially in production planning, day-to-day operations, unit commitment and economic dispatch (Hahn et al., Citation2009).
In this article, compared to existing dispatch control systems, a new system is presented that uses the results of forecasting energy consumption by a neural network in dispatch control. An approach is proposed in which an accurate and fast assessment of the energy load in the period of one hour ahead will be used in making dispatch decisions. Also, compared to the most common method of forecasting the load, where the forecast is based on historical data, the authors added the hourly temperature and day off parameter, which improved the accuracy and productivity of the forecasting system. Thus, a new intelligent method for forecasting the load and further analysis of the forecast are presented, which implements the exchange of information with the dispatch service and offers an auxiliary solution or warning, that is to say, it provides technical support to the decision-making personnel in managing and planning the operation of the power system.
2. Related work
Decision support systems are developed and widely used in various fields of human activity, in medicine (Dyczkowski, Citation2018; Urushibata et al., Citation2019; Wagholikar et al., Citation2011), transport (Mustapha et al., Citation2019) (Wayne et al), and economics (Asemi et al., Citation2011; Barton et al., Citation2004; Reddy et al., Citation2009). In the energy sector, most of the research is aimed at building decision support systems using data received from SCADA and EMS platforms (Chen et al., Citation2018; Chandler et al., Citation2014; Thu Zar Win & Myo Tun, Citation2014; Qin & Xiao, ; Celik et al., Citation2013).
In Chen et al., Citation2018, the intelligent auxiliary decision-making system of power grid accident management is located in the EMS platform, which shows the characteristics of the accident treatment of the regional power grid and provides intelligent technical support for fault diagnosis and method of power grid operation conditions. In the event of an accident abnormality, the simple and complex faults in the power grid can be analysed by capturing the real-time switching variable tidal current data and protecting the security information of the self-assembly device, so that the fault diagnosis and disposal scheme can be realised quickly and accurately, reduce the risk of misplaced and misuse, and improve the efficiency and accuracy of accident handling.
The research in Chandler et al., Citation2014 develops a controller for transactive resources, which functions to integrate real-time data from a SCADA system or other sources, as well as the dispatch optimising software for each independent smart grid system control layer, at a minimum. Each simulator in the system may choose independent operating strategies based on their own unique instance of the controllable resource portfolio through time, which a contextual controller may choose from, or mix, based on real-time requirements concerning timing or least cost. Here, we develop a centralised control platform to manage such a combination of dispatch simulators using a database (with embedded logic). This has several advantages. First, the variable data have little system infrastructure to traverse by way of web services, reducing the time required to compute the data. Second, containing the control layer within the database, the system mimics a PLC resource, allowing the controller to integrate seamlessly with a SCADA system. The controller has the following structural elements for passing data to simulators and managing their output.
Based on the status analysis of IPDG incremental power distribution grid projects and operation goals of PGE, sitting in the opening of IPDG business, Dong et al., Citation2019 puts forward a decision-making scheme for investing in IPDG projects and explains every specific implementation method and technical roadmap in different phases. The decision scheme takes into account the electrical load demand forecast that is affected by many factors, such as the introduction of distributed generation, reform of electricity price-setting mechanisms, and user interactive services.
One of the concepts in Liu et al., Citation2013 introduced to the power dispatch cockpit is the functions required by different management levels. For example, the system operators need all monitoring and control functions in the control centre. The upper-level managers could have smaller cockpits in their offices. Only information related to their management jobs is displayed in their office cockpits. Different departments have different access rights to operation information and different authorisations on controlling the system.
Celik et al., Citation2013 investigated a novel dynamic data-driven adaptive simulation (DDDAMS) framework that is designed for the efficient and reliable real-time dispatching of electricity under uncertainty. The proposed framework includes 1) a database receiving data from electrical and environmental sensors of a power grid, 2) an algorithm for online state estimation of the demand nodes in the considered electrical grid using particle filtering, 3) an algorithm for effective culling and fidelity selection in simulation considering the trade-off between the computational requirements of simulations and accuracy of anticipated dispatch results in terms of environmental and economic costs, and 4) data-driven simulation for mimicking the system response behaviour and generating a dispatch configuration, which minimises the total operational cost and power loss of the system, without posing security risks to the energy network.
In Cheung et al., Citation2010), the creation of the Smart Dispatch system is proposed. One core function of Smart Dispatch is the Generation Control Application (GCA), which aims at enhancing operators’ decision-making process under changing system conditions (load, generation, interchanges, transmission constraints, etc.) in near real time.
3. Proposed decision-making support system
In structural relationship, the methodology for decision-making support is described by the system represented in and includes the data input unit (DIU), unit of energy consumption forecast (UECF), database (DB) unit for neural network training, unit of support of dispatching decisions taking (USDDT).
Figure 1. Structure of methods for decision-making support.
The energy consumption is a multiple-factor process. In the research, the energy consumption model is accepted as a non-linear function as follows (P.V. Belyaev Koshekov et al., Citation2019):
where is the energy consumption,
is the energy consumption for the past day,
is the energy consumption on a similar day in the past year, T is the ambient temperature on the date of actual energy consumption, Q is the type of weekday (working, weekend, or holiday), and t is the hour of the day.
The energy consumption has sustainable systematic variations over time, and the amount of energy consumed on a similar date in the past year provides a basis for forecasting, a trend component of forecast. The medium air temperature with 3 hours gradation on the considered date is taken as ambient temperature. The type of weekday is also a significant parameter. The Q parameter is entered for classification of weekdays,
The main point of methods () is as follows: DIU generates data transferred to UECF. This information is necessary for build-up of energy consumption forecast one day in advance. The list of data, the effect of which to forecast precision is established experimentally, is transferred, specifically external temperature forecast for projected days, energy consumption at one-hour intervals one day preceding the forecasted day, energy consumption with one-hour intervals on a similar date in the past year, type of forecasted day, and whether it is a weekend or working day. The information is required for database seeding and overtraining of the neural network. For the actual energy consumption on the day before and actual temperature on the day before, refer to this information. The forecasting unit builds up the energy consumption forecast using the deep neural network. DIU and UECF are connected by data bus for information loading. The controlling action is provided as well, and the dispatcher may issue a command for forecast management or retrain the network. UECF is connected with DB, which keeps the retrospective information on energy consumption over the past few years, information entered by the dispatcher for forecasting of load and retraining of the neural network also comes and gets stored there. The connections between the UECF and DB are performed along the data bus. The forecasted energy consumption is the outcome variable of the forecasting unit. This value is transferred to UECF for further evaluation of forecast accuracy and to USDDT. This unit analyses the incoming information and issues recommendations for execution of dispatch control.
The special feature of proposed engineering solution is the availability of unit for decision-making support. The unit is intelligent and depending on forecasted energy consumption, according to the algorithm in , issues recommendations for execution of dispatch control. This unit is open and subject to replenishment and expansion, input of new recommendations, and conditions of its application. The replenishment is performed by the expert.
Figure 2. Algorithm of decision-making support unit functioning.
The forecast-based load value may be above the level of consumption or inversely, consumption of less than the statistical average value. The deviation on either side may adversely affect the operation of the electric power system. Having a forecast for such an event in advance, there is an opportunity to perform various dispatching changeovers, ensuring reliable electric power supply to consumers, allowing reduction in the overload, and thus the wearing of equipment and elements of the electric power system. For example, a USDDT will issue the following recommendations: put into operation the standby transformer in a certain transformer plant, re-energise the transformer plant from other distribution stations, or by any other cable line, which carrying capacity does not conform to the forecasting load, and alarm on possible emergency situations and overloading and need for equipment placement to energy-saving mode. The suggested recommendations may be informative directly for dispatching department and for operation, maintenance, and repair personnel, chief engineer of the plant, and Economy Department.
Also, USDDT is equipped with the training unit, and management of this unit is performed by the expert. The expert estimates the efficiency of one or other recommendations, introduces new recommendations, and specifies numerical values of forecasted load under which the specific recommendation is applied.
The system functional architecture of the decision-making system is shown in .
Figure 3. Schematic diagram of the functional architecture of the decision-making system.
The enlarged suggested methods of decision-making support consist of the following stages: forecasting of energy consumption, which is performed using the artificial neural network, and use of the resultant value for selection of controlling action, providing means for power distribution in the electric power system in an optimal manner.
3.1. Electrical load forecasting
UECF is built based on the application of fundamental provisions of artificial intelligence technology. The mean absolute percentage error (MAPE) is used for appraisal of forecast accuracy,
where is the actual energy consumption,
is the energy consumption forecasted by UECF, and N is the number of examples in the learning sample.
The forecasting based on autorecourse models gives a forecast error of about 4%. (Cui & Peng, Citation2015; Huang & Shih, Citation2003; Pradhan & Kumar, Citation2010) The forecasting using the fuzzy logic method produces an error of 2–3%. (Swati Takiyar et al., Citation2016), (Ganguly et al., Citation2017) The mean absolute error of the method based on the application of the artificial neural network makes up about 2% (Khaikin, Citation2006; Mazengia, Citation2008; Osman et al., Citation2009; Taylor & Buizza, Citation2002; Zhang & Gong, Citation2016).
The specific nature of energy consumption is difficulty in establishment of the functional relationship between factors affecting the energy consumption and actual load, and the degree of each factor impacts it individually and its combinations.
The most adequate method of forecasting enabling us to take into account the special features of energy consumption process is the artificial neural network since it makes it possible to perform a deep data analysis, establishes dependencies between the values not related clearly, and demonstrates a speed work while processing data bulks. Thus, database for energy consumption over 2 years will contain on the order of 16 thousand lines and 100 thousand variables, and the energy consumption process is continuous, considering that this constant data increment and increase of databases will take place. For correct operation of the neural network, the need for constant adding of new data to the learning sample appears.
Scientific research for forecasting of the electricity market of Kazakhstan has not been conducted practically. Also, there is still a certain technology gap between engineering development, software tools of artificial intelligence, and opportunities of its practical application (К. Т. Koshekov et al., Citation2018). The target of research in this paper is the power supply system of Northern region of Kazakhstan.
The method of deep computer-aided learning, specifically the use of the deep neural network, underlies the UECF operation. The advantage over other forecasting methods consists of high efficiency in the deep neural network, effective work at large data volumes, growth of data quantity, and adaptability to different objects and processes.
UECF is an architecture analysing input information across several hidden layers of the deep network. The operation principle of UECF in forecasting involves data submission to the input layer, further deep learning of the neural network takes place, and the outcome parameter is the predicted variable. Thus, UECF contains one input and one output layer and five hidden layers.
In such a manner, constructed UECF allows processing a large amount of input information for a short time, has opportunities to build up dependencies at undescriptive input information, and allows discovering the hidden dependencies between inputs and outputs.
The listed parameters in formula (1) affecting the energy consumption are input data of UECF. The outcome parameter is the projected energy consumption at a specified hour/day.
The mathematical description of UECF operation consists in finding of such weight coefficients enabling us to minimise a mismatch error between the list of input data and output variable (New information technology in the tasks of operating control of electric systems/N. А. Manov et al., Citation2002),
where yij and dij are the actual and desired response of the j-output layer neurone to the i-input vector; accordingly, p is the number of examples in the learning sample, and m is the number of neurones in the output layer.
The generated system characterising the suggested methods was implemented using extension package of environment—MATLAB Deep Learning Toolbox. MATLAB is a software environment for solution of engineering problems, main advantages of which include openness of the system, enabling user to adjust and modify the built-in functions of this environment independently.
3.1.1. Neural network training algorithm
The deep neural network was trained using the Levenberg–Marquardt algorithm. The Levenberg–Marquardt algorithm was independently developed by Kenneth Levenberg and Donald Marquardt (Levenberg, Citation1944), (Marquardt, Citation1963) The Levenberg-Marquardt (LM) algorithm can be regarded as a linear combination of the Gauss-Newton (GN) method and the Gradient Descent (GD) method. The alternation between these two methods is called a damping strategy and is controlled by a damping factor. If the damping parameter is large, the LM adjusts parameters like the GD method. If the damping parameter is small, the LM updates parameters like the GN. GD, GN, and LM methods are the optimisation algorithms for the basic Least-Squares (LS) problem, i.e., they use LS to fit data. Fitting requires a parametric model that releases the response data to the predictor data with coefficients. The LS method minimises the summed square of the residuals, with a residual being the difference between an observed value and the fitted value provided by a model (Protić, Citation2015).
The main expression of Newton’s methods is the expression (Osovsky, Citation2002)
where
is a direction that guarantees the achievement of minimum value of the objective function for a given step,
is a gradient value at the last decision point
, and
is a Hessian value at the last decision point
.
Using the Levenberg-Marquardt algorithm, the exact Hessian value h (w) (3) is replaced by the approximated value g (w), which is calculated based on information contained in the gradient, considering some regularisation factor.
In order to describe this method, let us suppose the objective function in a form, corresponding to the existence of a single training set,
where .
Using the values
a gradient vector and the approximated Hessian matrix, corresponding to the objective function (4), are defined as
where is the Hessian components
, containing higher derivatives compared with
.
The essence of the Levenberg–Marquardt approach is approximating R (w) using the regularisation factor vl, where the variable v, called a Levenberg–Marquardt parameter, is a scalar quantity that changes during the optimisation process. Thus, the approximated Hessian matrix at the k-th step of the algorithm becomes (Osovsky, Citation2002)
At the beginning of the learning process, when the actual value of is still far from the desired solution (the value of the error vector e is high), the value of the parameter
is used, which much greater exceeds its own matrix value
]. In this case, the Hessian is replaced by the regularisation factor,
and the direction of minimisation is chosen by the method of steepest descent,
As the error decreases and the desired solution becomes closer, the parameter goes down and the first term in formula (7) begins to play an increasingly important role.
The efficiency of the algorithm depends on a proper selection of the value. A too large initial value of
, as optimisation progresses, must decrease to zero when an actual solution that is close to desired is obtained. There are different ways to select this value, but we will describe the only one original technique proposed by D. Marquardt (Marquardt, Citation1963). Let the values of the objective function at the
and (
–1) steps of the iteration are designated as
and
, and the values of the parameter
at the same steps are denoted as
and
. The reduction coefficient of the value will be designated as
, where
> 1. In accordance with the classical Levenberg–Marquardt algorithm, the value of
changes according to the following scheme expression (Osovsky, Citation2002):
If , accept
.
If and
accept
.
If and
, increase steadily
times the
value until reach
is reached, at the same time assuming
.
Such a procedure of value modification is performed till the moment when so-called display fidelity coefficient
, calculated by the formula
reaches the value close to one.
Herewith, the quadratic approximation of the objective function has a high degree of coincidence with the true values, which indicates that the best solution is close. In such a situation, the regularisation factor in formula (8) can be omitted (
), the process of the Hessian determination leads to a direct approximation of the first order, and the Levenberg-Marquardt algorithm turns into a Gauss-Newton algorithm, characterised by quadratic convergence to the optimal solution (Osovsky, Citation2002).
3.1.2. The procedure of data input and neural network training
The algorithm shown in shows a procedure of data input and neural network training on its basis.
Figure 4. Algorithm of data input and neural network training.
The operation of the algorithm begins with the initial data input, information about the weather forecast on the predicted day, as well as retrospective data on energy consumption for the last day and the same day last year, which are entered. In this regard, in order to carry out the forecast, it is necessary to have a retrospective database for at least one calendar year. When entering the type of the day of the week, a check is made on whether the day belongs to a weekend or a working day and the necessary value will be further processed (Kalantaevskaya et al., Citation2019).
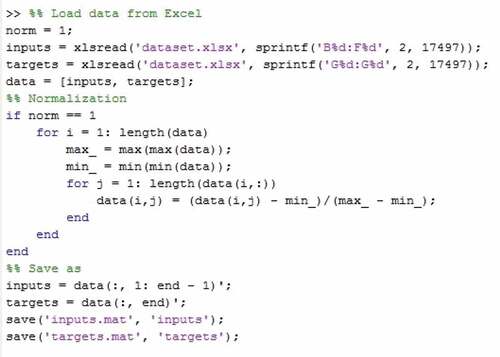
Furthermore, the entered initial data are subject to normalisation within [0,1]. The normalisation procedure includes bringing different types of data to one form. This form of recording is necessary for training a neural network.
Data normalisation is performed according to the following formula:
where is the normalised variable value,
is the actual, non-normalised variable value,
is the minimum variable value in data basis, and
is the maximum variable value in data basis.
The normalisation of data was performed using the MATLAB function ().
Figure 5. Normalisation of data.
Normalised data enter the neural network entrance, where its training takes place as follows. The initial weighting factors are randomly generated, and the network error
is estimated. The next weighting factor
is selected, and the total error
is estimated.
If the current total error increases as a result of updating the weighting factor, the weighting factor is dropped to its previous value and the coefficient μ increases by 10 times. If the current total error decreases as a result of the update, then the new weighting factor is saved as a current one and the coefficient μ decreases by 10 times. The procedure is repeated until the current general error is less than the required value (Hao & Wilamowski, Citation2011).
At the last stage, the neural network gives a forecast of energy consumption.
4. Experimental results and discussion
The data on load consumed by Petropavlovsk, North Kazakhstan region, Republic of Kazakhstan, for the period of 01/05/2016 to 30/04/2018 have been collected for UECF learning. The main generating company in the North Kazakhstan region is Petropavlovsk CHP-2 “SEVKAZENERO” JSC. The installed electric capacity of this station as of 1 January 2019 is 541 MW. For the 1st quarter of 2018, the total generated electric energy amounted to 872.1 million kW per hour. The power plant has a connection with the power system of Kazakhstan via overhead high-voltage power lines OPL-220 kW ’2711’, OPL-220 kW ’2721’, OPL-110 kW ’Siberia’. The total share of energy produced in the energy system of Kazakhstan is 3% (Report on the functioning of the electric energy and capacity market for the 1st quarter of, Citation2018).
The volume of consumer power is accepted at one-hour intervals, and therefore, a learning sample for two calendar years equals to 17,746 lines. The data affecting the consumption—ambient temperature and type of weekday—have been added to the teaching problem book aside from data on consumed power. The extracts from the teaching problem book are presented in .
Figure 6. Form of Data Recording In DB.
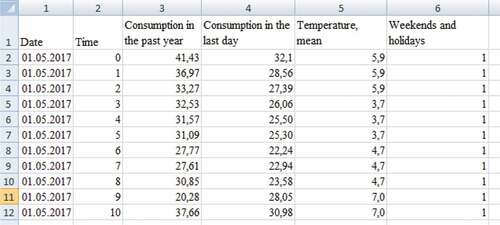
The database was generated in Microsoft Office Excel program since the MATLAB environment interacts with this program and allows for downloading data in.xlsx format.
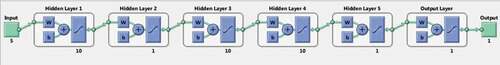
The parameters shown in are the examples of input data supplied to UECF input. A number of first layer neurones are determined by the scope of learning sample. A number of hidden layers are determined by experiment in the process of learning, and suggested deep neural network has amounted to 5 layers. A neural network, having identified the weight characteristics of connections between neurones, detects the consumed load within the considered day. The actual consumption of electric energy is an outcome parameter of the network.
Figure 7. MATLAB network configuration.
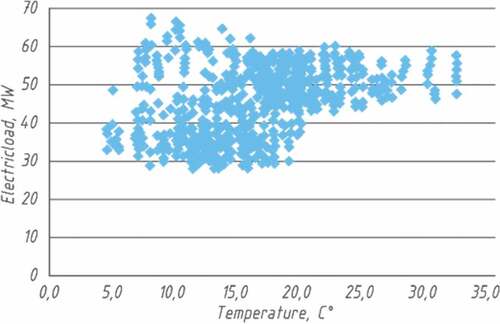
The weather forecast is one of the overriding factors in forecasting of energy consumption (Chen et al., Citation2018). The correlation factor between the ambient temperature and consumed load in the considered learning sample amounts to 0,302,022. The correlation between the mentioned variables for 1 month—July 2018—is shown in .
Figure 8. Correlation between the ambient temperature and the consumed load.
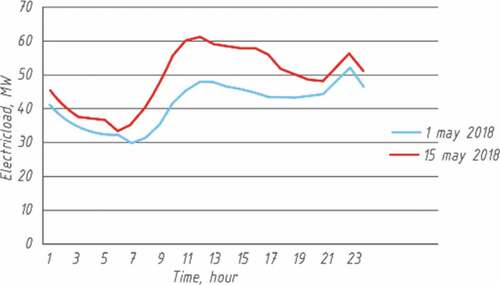
The type of load is different in various weekdays. By comparison of loads on holiday 1 May 2018 and working day 15 May 2018, it was found that the consumed load on holiday was less than that on a working day by a mean of 16.5%. (). In such a way, in the learning sample, the weekdays are classified by the following attribute, if the current day is a working day, or referred to weekends and holidays.
Figure 9. Energy consumption in various weekdays.
All data of the learning sample have been normalised to the values within the range of 0 to 1 so that all data values are in the same range and have the similar impact on network training.
The neural network training was performed in 3 stages. For that end, a learning sample is divided into 3 segments, training, control, and test, enabling us to train the neural network and verify its working capacity. By an experimental approach, it was established that the best result was achieved under the following percentage ratio: training segment—50%, control segment—25%, and test—25%.
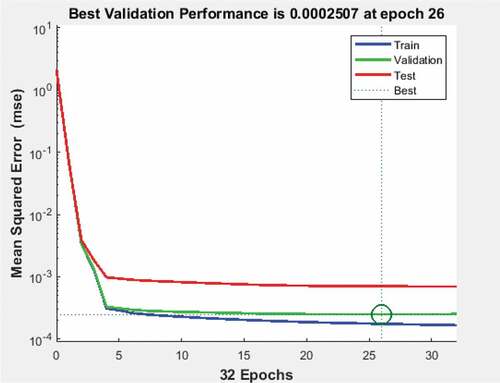
The neural network learning process takes place in several epochs; the graph of the error change with each next epoch is presented in , and the greatest accuracy is achieved at epoch 26.
Figure 10. Neural Network Learning Process.
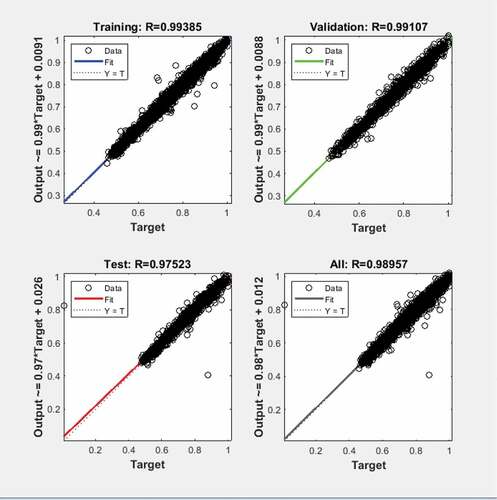
Based on the chart in , it can be seen that training on the network has a correlation coefficient (R) equal to 0.99. This correlation coefficient is obtained based on the linear regression plot mechanism. After the training process, curve matching is done to compare the suitability between the network outputs with the training target (Syahputra & Dhimas Syahfitra, Citation2018).
Figure 11. Neural network training regression.
As a result of modelling, the example of actual and projected energy consumption for 01/07/2018 is shown in .
Figure 12. Forecast and actual loading as of 01/07/2018.
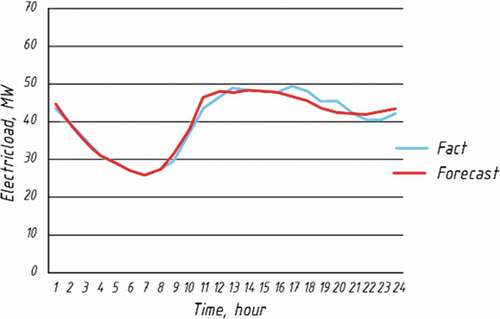
A complex of characteristics was obtained, and its analysis has allowed us to draw the following conclusion: when using the suggested deep neural network for short-term forecasting one day in advance, the value of a forecast mean absolute error (MAPE) is 1.922%. The calculation of the forecast mean absolute error (MAPE) value was performed according to formula (2).
Additionally, it was found that it is necessary to take into account the environment temperature since the Kazakhstan climate assumes the dynamic temperature variations within the limits of [] degrees in one day. The entry of the temperature parameter to the learning sample has allowed improving the forecasting results by 1%. The entry to the learning sample of the Q parameter indicative of identity of a day as a weekend or working day has allowed us to decrease the value of mean absolute error by 0.2%.
For practical approval of the decision support method, the developed system was tested under conditions of the North Kazakhstan Regional Electric Distribution Company JSC. A transformer plant being on the balance sheet of the North Kazakhstan Regional Electric Distribution Company JSC, specifically TS 10/0,4 kV No. 304, was selected.
This transformer plant has the capacity of 2х400 kVA: one transformer is working, and the other is a standby transformer. The transformer plant is powered from two mutually redundant sources DS 110/10 kV No. 7 and No. 11. The permanent supply is obtained from DS 110/10 kV No. 7. The energy consumption analysis for TS 10/0,4 кW №304 has demonstrated that the power output within [260 370] kW is optimal energy consumption during the summer period. According to the suggested algorithm with forecasted energy consumption above 380 kW, there is a need for putting into operation of the standby transformer. For the period when the power is more than 450 kW, it is necessary to put into operation the stand-by cable line and make a supply from DS 110/10 kV No. 11 since the carrying capacity of cable line from DS 110/10 kV No. 7 does not provide the requirement for the desired value of voltage drop, under that power. The increment in voltage drop results in the increase in electric loss in the system.
The operation of the decision support system for TS 10/0,4 kV No. 304 in general form is presented in .
Figure 13. Operation of decision support tool for TP 10/0,4 kV No. 304.
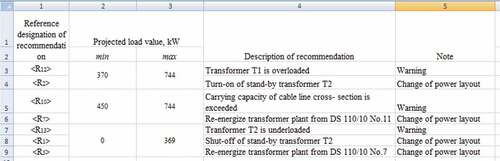
The recommendations for dispatch control provided by the decision support tool make it possible to enhance reliability of power supply and reduce the loss of network voltage, which will enhance the quality of electric energy and beside that have an economic effect allowing for reducing the cost value of electric power transmission.
5. Conclusion
Information about the current state of the power system is often insufficient to make effective decisions on power system management, planning, and implementation of measures to maintain power equipment in its most efficient condition. This article proposes a combined system for forecasting electrical energy and support for making dispatch decisions. The prediction of energy consumption by a neural network was used in this system as a tool for dispatch control, and thus, a new possibility of using the data obtained as a result of prediction is presented. The following algorithms were also developed: the algorithm for the functioning of the decision support unit and the algorithm for the process of setting the initial data and training the neural network. The results show that by simulating the load one hour ahead, in many cases, the control room operator can make more effective decisions. Information about future energy consumption facilitates decision-making and effective implementation of planning, monitoring, and management functions.
Disclosure statement
No potential conflict of interest was reported by the author(s).
Additional information
Funding
Notes on contributors

Natalya Kalantayevskaya
The research group consists of employees of M. Kozybayev North Kazakhstan University in Petropavlovsk Kazakhstan, Civil Aviation Academy in Almaty Kazakhstan, and Institute of Information and Computational Technology MES RK in Almaty Kazakhstan. The main research activities of the group include decision support systems, signal processing, machine learning, and prediction of electricity consumption. These days, the introduction of digital technologies is taking place in almost all areas of life. This research proposes an intelligent system of dispatch decision support in process control in the electric power industry, which will automate and improve the efficiency of dispatch control of electrical systems.
References
- Andryushin, A. V., Arakelyan, E. K., Shcherbatov, I. A., Kosoy, A. A., & Dolbikova, N. S. (2019). Application of neural network technologies in power engineering. Journal of Physics: Conference Series 1370 Bristol (: IOP Publishing).
- Asemi, A., Safari, A., & Asemi Zavareh, A. (2011, July). The role of management information system (MIS) and decision support system (DSS) for manager’s decision-making process. International Journal of Business and Management, 6(7), 164–20. https://doi.org/10.5539/ijbm.v6n7p164
- Barton, J., Parolin, B., & Weiley, V. (2004). A Spatial decision support system for the management of public housing. In recent advances in design and decision support systems in architecture and urban planning 1 , 69–84 doi:10.1007/1-4020-2409-6_5.
- Celik, N., Thanos, A. E., & Saenz, J. P. (2013). DDDAMS-based dispatch controlin power networks. Procedia Computer Science, 18 3 , 1899–1908. https://doi.org/10.1016/j.procs.2013.05.359
- Chandler, S. A., Rinaldi, J. H., Bass, R. B., & Beckett, L. (2014). Smart grid dispatch optimisation control techniques for transactive energy systems. IEEE Conference on Technologies for Sustainability (SusTech), Portland (IEEE), 51–54
- Chen, H., Jiang, X., Hu, D., Wang, T., & Zhou, F. (2018). Design of auxiliary decision-making system for power grid fault disposal. International Conference on Electrical Engineering, Control and Robotics (EECR 2018) MATEC Web of Conferences 12-14 January 2018 Chengdu, China, 160 (EDP Sciences), 1–5
- Cheung, K., Wang, X., Chiu, B.-C., Xiao, Y., & Rios-Zalapa, R. (2010). Generation dispatch in a smart grid environment Gothenburg (IEEE). , 1–6 doi:10.1109/ISGT.2010.5434781.
- Cui, H., & Peng, X. (2015). Short-Term city electric load forecasting with considering temperature effects: An improved ARIMAX model. Mathematical Problems in Engineering 2015 , 1–10 https://doi.org/10.1155/2015/589374.
- Dong, Z., Xiao Yan, S., Yu, X., & Qiong, L. (2019). Research on investment decision-making scheme of power grid enterprises considering the expansion of incremental power distribution service. IOP Conference Series: Earth and Environmental Science, 295 82 , 1–8 doi:10.1088/1755-1315/295/5/052011.
- Dyczkowski, K. (2018). . Intelligent medical decision support system based on imperfect information. Studies in Computational Intelligence, (Springer International Publishing AG), 123 doi:10.1007/978-3-319-67005-8.
- Fentis, A., Bahatti, L., Tabaa, M., & Mestari, M. (2019). Short‑term nonlinear autoregressive photovoltaic power forecasting using statistical learning approaches and in‑situ observations. International Journal of Energy and Environmental Engineering, 10(2), 189–206. https://doi.org/10.1007/s40095-018-0293-5
- Ganguly, P., Kalam, A., & Zayegh, A. (2017, May 18 −21). Short term load forecasting using fuzzy logic. International Conference on Research in Education and Science (ICRES) Ephesus-Kusadasi (Professional science), 355–361
- Giannakis, G., Kekatos, V., Gatsis, N., Kim, S.-J., Zhu, H., & Wollenberg, B. (2013). Monitoring and optimisation for power grids: A signal processing perspective. IEEE Signal Processing Magazine, 30(5), 107–128. https://doi.org/10.1109/MSP.2013.2245726
- Hahn, H., Meyer-Nieberg, S., & Pickl, S. (2009). Electric load forecasting methods: Tools for decision-making. The European Journal of Operational Research, 199(3), 902–907. https://doi.org/10.1016/j.ejor.2009.01.062
- Hao, Y., & Wilamowski, B. M. (2011). Levenberg–Marquardt training. In Industrial electronics handbook, vol. 5 – Intelligent systems (2nd (CRC Press), pp. 12–1 to 12–15). chapter 12.
- Hemmati, M., Mohammadi-Ivatloo, B., & Soroudi, A. (2020). Uncertainty management in decision-making in power system operation Readings, Lisa. In Decision making applications in modern power systems (pp. 41–62). Academic Press.
- Huang, S. J., & Shih, K. R. (2003). Short-term load forecasting via ARMA model identification including non-Gaussian process considerations. IEEE Transactions on Power Systems, 18(2), 673–679. https://doi.org/10.1109/TPWRS.2003.811010
- Jiao, X., & Fushuan, W. (2008). Wide-area protection and its applications. Proceeding of the CSU-EPSA, 20(2), 22–35.
- Kalantaevskaya, N. I., Latypov, S. I., & Koshekov, K. T. (2019). Model of organisation of data and the process of training a neural network when plotting load schedules for the day ahead. Vestnik AUEiS, 3(46), 11–16 https://vestnik.aues.kz/index.php/none/issue/view/57/59. (in Russian)
- Khaikin, S. (2006). Neural networks: complete course (М.: ООО I.D.Williams), 1104.
- Koshekov, К. Т., Kashevkin, А. А., Latypov, S. I., Savostina, G. V., Koshekov, А. К., Savostina, G. V., & Koshekov, A. K. (2018). An intelligent system for vibrodiagnostics of oil and gas equipment. Russian Journal Nondestructive Testing, 54(4), 249–259. https://doi.org/10.1134/S1061830918040071
- Koshekov, P. V. B., Kalantayevskaya, N. I., Latypov, S. I., & Savostin, A. A. (2019). Forecasting energy consumption of north Kazakhstan based on deep learning technology. Problems of mechanical engineering. Materials of the III International scientific and technical conference Omsk (Publishing house OmSTU), 246–252 (in Russian)
- Kropp, T. (2006, March/April). System threats and vulnerabilities: An EMS and SCADA security system overview. Power & Energy Magazine IEEE , 46–50
- Levenberg, K. (1944). A method for the solution of certain problems in least squares. Quarterly of Applied Mathematics, 5(2), 164–168. https://doi.org/10.1090/qam/10666
- Liu, J., Li, P., Zhong, J., & Liang, L. (2013). Operation indices for smart power dispatch centre. Design Engineering Vol. 5 No. 1B , 174–179 doi:10.4236/eng.2013.51B032.
- Lu, Y. (2017, June). Industry 4.0: A survey on technologies, applications and open research issues. Journal of Industrial Information Integration, 6 2017 , 1–10. https://doi.org/10.1016/j.jii.2017.04.005
- Luo, H. (2004). Development of dispatching automation technology in China -from SCADA to EMS. Power System Technology, 28(4), 43–46.
- Manov , N. , Chukreev, Y. , Uspensky, M. , Shumilova, G. , Khokhlov, M. , Gotman, N. , Kyzrodev, I. , Startseva, T. New information technology in the tasks of operating control of electric systems/, et al. (2002). Institute of Social and Economic and energy problems of the North. Ural Branch RAN (UB RAN). (in Russian).
- Marquardt, D. (1963). An algorithm for least-squares estimation of nonlinear parameters. SIAM Journal on Applied Mathematics, 11(2), 431–441. https://doi.org/10.1137/0111030
- Mazengia, D. H. (2008). Forecasting spot electricity market prices using time series models: Thesis for the degree of master of science in electric power engineering. 89. http://webfiles.portal.chalmers.se/et/MSc/DawitHailuMazengia.pdf
- Mustapha, R., Yusof, Y., & Ab Aziz, A. (2019, July 15). Computational-rabi’s driver training model for prime decision-making in driving. Journal of Theoretical and Applied Information Technology, 97(13), 3540–3558 https://www.researchgate.net/publication/335391945_COMPUTATIONAL-RABI'S_DRIVER_TRAINING_MODEL_FOR_PRIME_DECISION-MAKING_IN_DRIVING.
- Osman, Z. H., Awad, M. L., & Mahmoud, T. K. (2009, March 15-18). Neural network based approach for short-term load forecasting. Power Systems Conference and Exposition Seattle, WA (IEEE) 1–8
- Osovsky, S. (2002). Neural networks for information processing/ Osovsky S.: Per. from Polish I.D. Rudinsky. (M.: Finance and Statistics). 344
- Pradhan, R. P., & Kumar, R. (2010). Forecasting exchange rate in India: An application of artificial neural network model. Journal of Mathematics Research, 2(4), 111–117. https://doi.org/10.5539/jmr.v2n4p111
- Protić, D. (2015). Feedforward neural networks: The Levenberg-Marquardt optimisation and optimal brain surgeon pruning. Vojnotehnicki Glasnik/military Technical Courier, LXIII(3), 11–28. https://doi.org/10.5937/vojtehg63-7529
- Reddy, G. S., Srinivasu, R., Reddy Rikkula, S., & Sreenivasa Rao, V. (2009). Management information system to help managers for providing decision making in an Organisation. International Journal of Reviews in Computing 5 , 1–5 http://www.ijric.org/volumes/Vol5/1Vol5.pdf.
- Report on the functioning of the electric energy and capacity market for the 1st quarter of (2018). Retrieved March 3, 2020, from http://www.kea.kz/texts/sovet/2018_3.pdf
- Swati Takiyar, K. G. U., Singh, V., & Singh, V. (2016). Fuzzy ARTMAP and GARCH-based hybrid model aided with wavelet transform for short-term electricity load forecasting. Energy Science and Engineering, 4(1), 14–22. https://doi.org/10.1002/ese3.105
- Syahputra, R., Dhimas Syahfitra, F, & Soesanti, I. (2018). Application of artificial neural network for power transformer peak load prediction. Journal of Theoretical and Applied Information Technology, 96(22), 7643–7653 https://www.researchgate.net/publication/329573634_Application_of_artificial_neural_network_for_power_transformer_peak_load_prediction.
- Taylor, J. W., & Buizza, R. (2002). Neural network load forecasting with weather ensemble predictions. IEEE Transactions on Power Systems, 17(3), 626–632. https://doi.org/10.1109/TPWRS.2002.800906
- Thu Zar Win, K., & Myo Tun, H. (2014). Design and Implementation of SCADA system based power distribution for primary substation. International Journal of Electronics and Computer Science Engineering, 3(3), 254–261 doi: 10.1.1.636.6872.
- Urushibata, N., Murata, K., & Otomo, Y. (2019). Decision-making criteria for damage control surgery in Japan. Scientific Reports, 9(1), 1–7. https://doi.org/10.1038/s41598-019-51436-x
- Wagholikar, K., Sundararajan, V., & Deshpande, A. (2011). Modeling paradigms for medical diagnostic decision support: A survey and future directions. Journal of Medical Systems, 36(5), 3029–3049. https://doi.org/10.1007/s10916-011-9780-4
- Wu, Q., Le, H., & Deng, H. (2016). Research of power grid fault diagnosis and intelligent analysis method based on multi-source information. 6th International Conference on Mechatronics, Computer and Education Informationisation (MCEI 2016) Guangzhou (: Atlantis Press), 303–309
- Zhang, Z., & Gong, W. (2016). Short-Term load forecasting model based on quantum elman neural networks. Mathematical Problems in Engineering, 3, 1–8 doi:10.1155/2016/7910971.