
 ?Mathematical formulae have been encoded as MathML and are displayed in this HTML version using MathJax in order to improve their display. Uncheck the box to turn MathJax off. This feature requires Javascript. Click on a formula to zoom.
Abstract
Fruit ripeness detection (FRD) has been a very important research area. FRD has focused more on colour segmentation, image processing, odor of fruits and its size. However, fruit stiffness can be an evidence of its ripening. Developing a sensor that focuses on the stiffness of fruit becomes very important. This work presents an approach of mango ripeness detection based on its stiffness using a tactile sensor. A resistance change-based micro tactile sensor is designed for FRD in which it utilizes two cantilevers with different stiffness to estimate mangoes ripeness levels based on their stiffness. The tactile sensor parameters were analyzed and selected to ensure high sensitivity and linearity of the sensor output (Force ratio). The sensor was developed and experimentally tested with five test pieces of known stiffness for proof-of-concept. A finite element analysis was carried out to test the sensor with the same stiffness values of test pieces to compare the results with the analytical results. The error between the analytical and experimental results of the test pieces did not exceed 7%, while the error between the analytical and simulation results of the stiffness of the test pieces did not exceed 2.7%. Finally, the sensor was tested with five mangoes at different ripeness levels, and the sensor clearly differentiated among the mangoes and obtained stiffness values of 1792.95 N/m, 1395.70 N/m, 1078.86 N/m, 317.15 N/m and 67.81 N/m from the stiffest to the softest mango (Mango A—Mango E), respectively. This tactile sensor can be used in fruit sorting industries to complement the existing fruit sorting approaches.
PUBLIC INTEREST STATEMENT
Recent fruit ripeness detection research has centered on image processing, color segmentation and fruit size to predict the ripeness level of fruits without taking their stiffness into account. Fruits like mangoes, where many species retain their original color even when ripe, may not completely fit into the category of color segmentation and image recognition. In most cases, ripeness is determined by pressing the mangoes to check their softness, which is inefficient because the process of pressing exposes the mangoes to non-uniform ripeness, which affects the taste and quality of the mangoes, resulting in wastage of these valuable resources. This necessitates the development of a tactile sensor that will supplement existing studies by measuring mango ripeness based on stiffness.
1. Introduction
Recent researches on fruit ripeness detection has focused more on image processing, colour segmentation and size of fruits to predict the ripeness level of fruits without considering their stiffness. Fruits like mangoes where a lot of species maintains original colour even when ripe might not completely fit into the category of colour segmentation and image recognition; in most cases, ripeness is determined by pressing the mangoes to check its softness, and this technique is not optimal because, in the process of pressing, it expose the mangoes to non-uniform ripeness, which eventually affects the taste and quality of the mangoes, thereby leading to wastage of these mangoes. This is why the need for a tactile sensor that will complement the existing research by detecting ripeness of mangoes based on the stiffness becomes important. The act of touching may be the most unique detecting methodology as compared with seeing, hearing, smelling and tasting.
Several works in fruit sorting and ripeness detection based on imaging system have carried out by a lot of researchers (Dadwal & Banga, Citation2012; Fitmawati et al., Citation2017; Sa et al., Citation2016; Yossy et al., Citation2017), based on gas sensors and electronic nose (Gomez et al., Citation2006; Praveena, Citation2017) and based on the parameters affecting fruit quality (Cárdenas-Pérez et al., Citation2018; Grotte et al., Citation2007; Jarimopas & Kitthawee, Citation2007; Verzhuk et al., Citation2012). However, little work has been recorded so far in fruit sorting based on its stiffness as a function of its modulus of elasticity. Alan et al. (Citation2017) carried out a mechanical characterization of mango fruit using compression tests to determine the elastic modulus of the two varieties of mangoes they worked with. Their results showed that the range of elastic modulus on radial loading of the mangoes varies from 1 MPa to 2.5 MPa. Nnodim et al. (Citation2019a) experimentally estimated the modulus of elasticity of mango using two varieties of mangoes having different levels of ripeness. Authors estimated the modulus of elasticity of mangoes utilizing a compression test on five samples of two types of mangoes have different ripeness levels. Results showed that modulus of elasticity to be within the range of 1 MPa for the ripest mango and 3.3MPa for the rawest mango. Their results prove that the modulus of elasticity of mangoes reduces as the ripeness levels increases and vice versa. Same authors in (Nnodim, Fath El-Bab, Ikua, Sila et al., Citation2019b) also carried out a simulation on the tactile sensor for fruit ripeness detection using Ansys software simulating the fruit with different values of elastic modulus and carrying out a finite element analysis (FEA) and found that the sensor can distinguish between all the stiffness simulated.
Thus, little work has been recorded in the application of tactile sensor on fruit sorting and ripeness detection based on the fruit stiffness as a function of its elastic modulus. Sensors that have been employed by many researchers in stiffness sensing of objects are tactile sensors. Tactile sensors have a variety of industrial applications, including robotics (Suwanratchatamanee et al., Citation2010, Citation2011), haptic devices (Peterlík & Filipovic, Citation2011), biomedical sensing (Aoyagi & Yoshida, Citation2004) and polymer characterization (Sanchez et al., Citation2008). According to Lee and Nicholls (Citation1999), a tactile sensor is a device or system that can characterize mechanical properties of the targeted object or of the contact between the sensor and the object. Tactile sensors for contact force measurement have been well documented, and a number of prototype sensors have been developed (Cecchi et al., Citation2015; Tsuji et al., Citation2009).
Different concepts have been applied in tactile sensor development for stiffness measurement; however, the 2-tip configuration concept employed by Fath El-Bab et al. (Citation2008) has an advantage of being independent of the applied displacement and applied force on the sensor. Fath El Bab et al. (Citation2007, Citation2008) worked on softness of tissue compliance detection applying the two springs concept to differentiate soft tissues with different stiffness; they also showed that springs with cubic tip gives more stable output than springs with spherical tip. Fouly et al. (Fouly, Fath El-Bab, Nasr, Abouelsoud et al., Citation2017a; Fouly et al., Citation2015) modified the two springs concept to a three tip concept based on the fact that most applications have irregular surfaces and developed a new tactile sensor that compensates for surface irregularities, and they could differentiate between tissues with different stiffness.
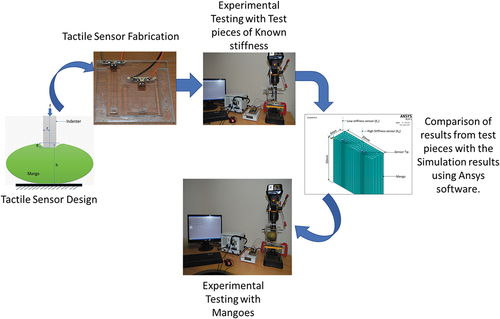
In this work, the design, development and experimental testing of a dual tip resistance change-based tactile sensor on test pieces and mangoes was carried out. The parameters of the sensor were designed to increase the sensitivity and linearity of the sensor output (force ratio). This tactile sensor assesses the stiffness of mangoes and classify them based on their ripeness level. The developed sensor will complement existing fruit sorting techniques.
2. Sensor design
2.1. Mathematical model
The sensor design consists of two springs with different stiffnesses () and (
) on the left and right hands, respectively, as shown in . The mango stiffness (
) is modeled as an elastic spring (Engel et al., Citation2005). (
) is the relative low stiffness spring, while (
) is the relative high stiffness spring. As the sensor is pushed at a distance (
) to contact the mango, forces are generated on the low and high stiffness springs. These forces are (
) and (
), respectively. It can be seen in () that (
) and (
) are in series with the mango spring (
); therefore, their equivalent stiffnesses (
) and (
) as shown in is mathematically shown in EquationEquation (1)
(1)
(1) and EquationEquation (2)
(2)
(2) .
Figure 1. Sensor model.
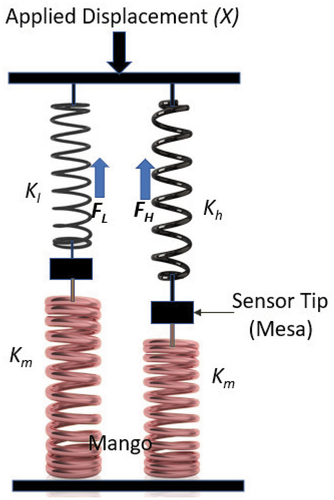
Figure 2. Equivalent model of the sensor.
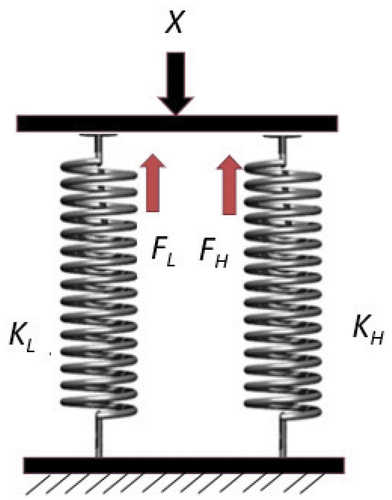
Furthermore, by measuring the ratio of the forces () i.e. the sensor output in EquationEquation (3)
(3)
(3) generated in the springs when pushed to the mango, the stiffness of the mango can be measured, as shown in EquationEquation (4)
(4)
(4) .
Where is a dimensionless parameter.
2.2. Mango fruit stiffness range
Hayes et al. (Citation1972) provided a mathematical model based on indentation principle as shown in to calculate the stiffness of a soft object as a function of its elastic modulus, as shown in EquationEquation (5)(5)
(5) .
Figure 3. Indentation principle.
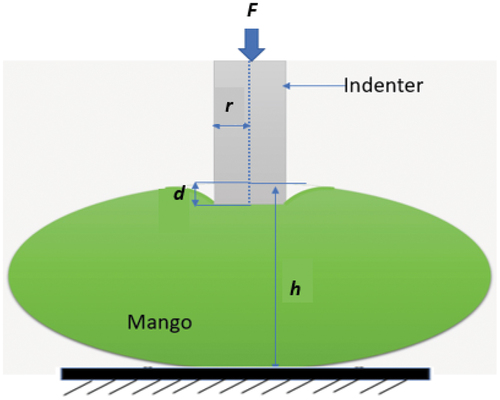
Where: ,
,
,
,
,
and
are the applied force, Poisson’s ratio of mango, the indentation depth, the indenter radius, the Elastic modulus of mango, the scaling factor and the radial height of the mango, respectively.
In this work, mango is assumed to be isotropic and linear elastic especially when deformed slightly, its Poisson’s ratio is assumed to be 0.3 (Jarimopas & Kitthawee, Citation2007), and the maximum range of elastic modulus is 3 MPa (Nnodim, Fath El-Bab, Ikua, Sila et al., Citation2019a), which is equal to a stiffness value of 3300 N/m according to EquationEquation (6)(6)
(6) . Also, the indenter is designed to be a cube with side length of 1 mm and the radial height of the mango is 70 mm. However, the scaling factor
depends on
,
and
; Zhang et al. (Citation1997) developed tables from a finite element analysis to estimate
, and obtained
= 1. Finally, from the experiment carried out in this work, the stiffness values will range from 0 N/m to 3300 N/m based on EquationEquation (6)
(6)
(6) .
2.3. Sensor parameters
The sensor parameters are the low stiffness sensor (), the high stiffness sensor (
) and maximum force ratio (
). The maximum force ratio (
) can be calculated by defining (
) and (
) at maximum (
) in EquationEquation (3)
(3)
(3) . However, doing that will increase the error in
due to crosstalk (interference) effect and cause a very large difference between (
) and (
). Fath El Bab et al. (Citation2008) carried out a crosstalk effect analysis and found the
to be 5; thus, the selected
value in this work based on EquationEquation (3)
(3)
(3) is 5. As stated earlier, the relationship between
and
as in EquationEquation (3)
(3)
(3) , is nonlinear when arbitrary values of
and
as shown in ; however, a non-linearity error analysis was done in order to get the desired
and
that gives a linear output. () shows that the maximum non linearity occurs at the mid-range of the mango stiffness.
Figure 4. Nonlinear and expected sensor output vs mango stiffness.
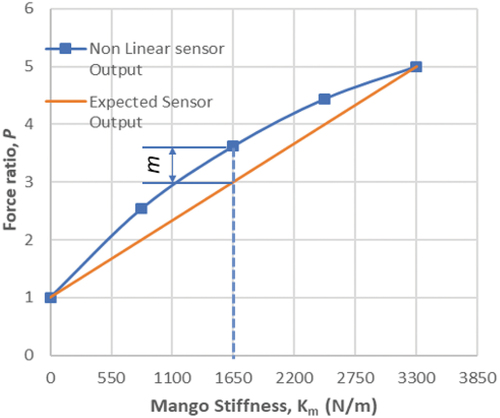
Therefore, the maximum nonlinearity error () from is represented mathematically in EquationEquation (7)
(7)
(7)
Where, is the sensor output at the mid-range of the mango stiffness designed,
is the distance between the maximum point of non-linearity to the corresponding linear point, as shown in . Therefore, for
= 5, EquationEquation (7)
(7)
(7) becomes
Also from EquationEquation (3)(3)
(3) ,
The relationship between and
at
from Equation (310) becomes
Substituting EquationEquation (10)(10)
(10) into EquationEquation (9)
(9)
(9) gives
Subsequently, substituting EquationEquation (11)(11)
(11) into EquationEquation (8)
(8)
(8) yields
EquationEquation (12)(12)
(12) shows the relationship between the between
and
, which implies that
is a function of change in
. However, if a higher value of
is selected, then the value of
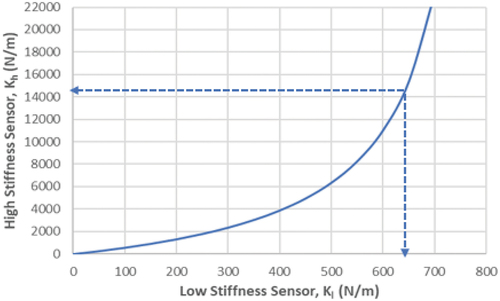
will be increased, which will make the strain on the high stiffness sensor very low, and this will consequently lead to a low output voltage. In this work, a non linearity error of 5% is assumed to be allowed, and this gives a value of 645.7 N/m for
and 14,855 N/m for
. The relationship between the high stiffness sensor
and the low stiffness sensor (
) is shown in .
Figure 5. High stiffness sensor, (
) versus the low sensor stiffness,
(
).
2.4. Simulation of the sensor
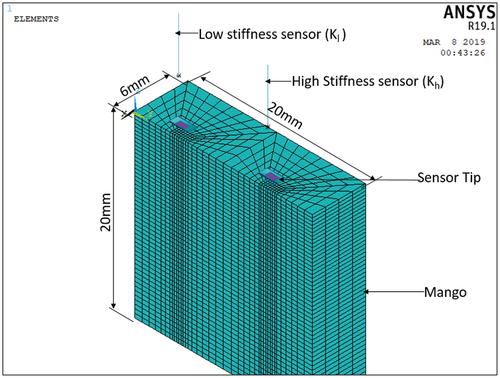
The design parameters obtained in the previous section were used to build a finite element model using ANSYS Parametric Design Language (APDL) software to analyze the sensor performance and ensure that the two-tip configuration is feasible. The mango was constructed using a 3-D axisymmetric finite element model where the mango was assumed to be isotropic, homogeneous, fixed below at its base and linearly elastic with a Poisson’s ratio of 0.3 with dimensions of 20 mm × 12 mm × 20 mm, as shown in .
Figure 6. Isometric view of the 3-D axisymmetric finite element model.
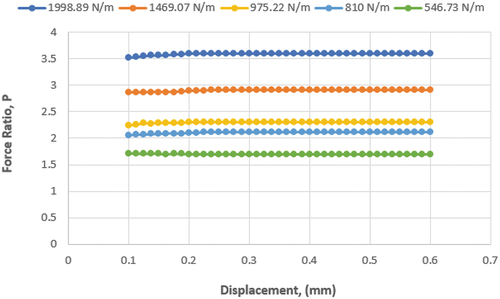
Also the stiffness of the mangoes simulated were 1998.89 N/m, 1469.07 N/m, 975.22 N/m, 810 N/m and 546.73 N/m. These values were selected so as to test for a wider range of stiffness and to compare with the analytical and experimental results. The distance between the sensor tips is 8 mm; this is narrow enough to assume that the surface of contact is flat. The sensor tips which is a rigid body attached to the spring during pushing is cubic with a side length of 1 mm, and the sensor tip in the model is at a distance 0.1 mm above the mango surface; hence, the simulation readings began to record results form 0.1 mm. The contact of the sensor tip with the mango was built with CONTA174 and TARGE170 elements located on its boundary. The sensors are the two springs of COMBIN14 elements, which represents the low stiffness sensor () = 645.7 N/m on the left and the high stiffness sensor (
) = 14,855 N/m on the right, as shown in . illustrates that the sensor was able to differentiate between the different stiffness simulated. The simulated mango stiffness of
= 1998.89 N/m has the highest force ratio of 3.59, while the simulated mango of
= 546.73 N/m has lowest force ratio of 1.70. The maximum error of the simulation results did not exceed 2.7%.
Figure 7. Force ratio, for simulated stiffness versus displacement, x.
2.5. Fabrication of sensor
2.5.1. Design of the tactile sensor
The tactile sensor was fabricated using the 30 W CO2, VersaLASER® (VLS) 3.50 laser cutter to verify the two-tip configuration sensor concept in distinguishing mango stiffness. () shows the image of the fabricated tactile sensor, which was used in this experiment after being drawn with Solid Works® software, and the dimensions of the tactile sensor, as shown in . The sensor comprises two cantilevers representing the two springs (sensing components) of high and low stiffness, as shown in .
Figure 8. Fabricated two-tip tactile sensor.
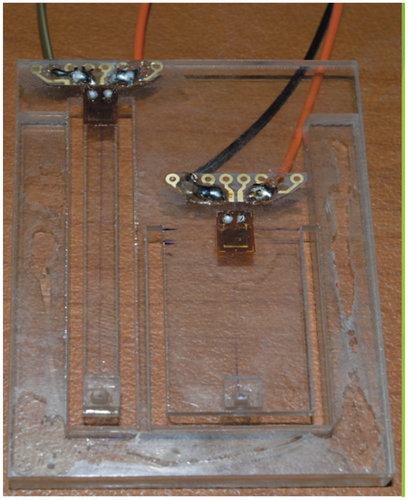
Figure 9. Two-tip tactile sensor (dimensions in mm).
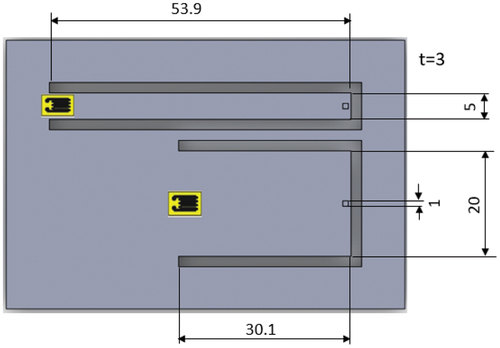
One end is fixed while the other end is deflected perpendicularly to the long axis of the beam. Sensing elements were selected as cantilevers because cantilever has a linear force-deflection behaviour (Fouly, Fath El-Bab, Nasr, Abouelsoud et al., Citation2017b). The sensor was first designed with Solid®Works software with the dimensions of the cantilever, which equals the value of the and
, respectively, as obtained from EquationEquations (13)
(13)
(13) and (Equation14
(14)
(14) )
where is the elastic modulus of the high stiffness sensor,
is the length of the high stiffness sensor,
is the width of the high stiffness sensor,
is the thickness of the high stiffness sensor
is the elastic modulus of the low stiffness sensor,
is the length of the low stiffness sensor,
is the width of the low stiffness sensor and
is the thickness of the low stiffness sensor. The dimensions of the cantilever beams were obtained by applying EquationEquations (13)
(13)
(13) and (Equation14
(14)
(14) ). Since the elastic modulus
is constant, the stiffness to be obtained is known (i.e
and
), and the thickness of the material is selected to be 3 mm in this work due to its higher resistance to laser cutting. The length of each cantilever must be greater than or equal to 10 times the gauge length of the strain gauge for maximum sensing, where the gauge length of the strain gauge is 3 mm. Therefore, applying these criteria in EquationEquation (14)
(14)
(14) , the width of the cantilevers were obtained.
2.6. Calibration of the sensor
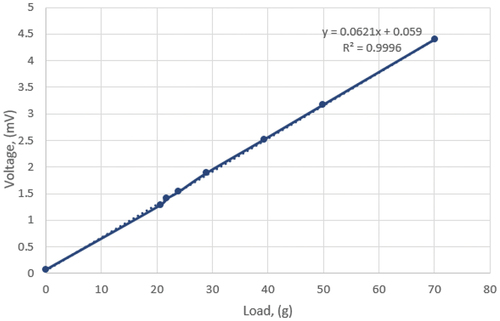
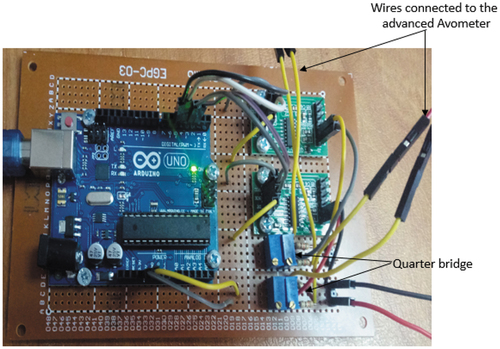
After the bonding of the strain gauge to the fixed end of each of the cantilever beam, the sensor was then calibrated. This was done by applying measured loads on the free end of each of the cantilever and then measuring the resulting output voltage at every loading and unloading of the cantilever beam. The high and low stiffness cantilever beams were calibrated separately by loading the free end of each of the cantilever beams with loads and then connecting the sensor to a quarter bridge measuring the change in the output voltage from an advanced Avometer, and this was done five times for each cantilever. A hole of 0.5 mm was drilled in the free end of the cantilever as shown in ) using the laser machine in order to allow the passage of strings that were used to carry the loads that were applied on the free end of the two cantilevers. illustrate the loading and unloading of masses on the high stiffness sensor, and the voltage–load relationship on the high stiffness sensor is linear, which implies that the high stiffness sensor is stable and reliable to give high repeatability of results. However, illustrate the loading and unloading of masses on the low stiffness sensor, and the voltage–load relationship on the low stiffness sensor is linear, which implies that the low stiffness sensor is stable and reliable to give high repeatability of results. Also, show load–voltage relationship of the average loading of masses on the high stiffness sensor and the low stiffness sensor, respectively. This load–voltage relationship is called the calibration factor. The calibration factor enables the proper conversion of measured voltage to the equivalent value of force. After the calibration of the sensors, the sensor tips were bonded to the free end of each of the cantilever beams.
Figure 10. Two-tip tactile sensor showing the drilled holes.
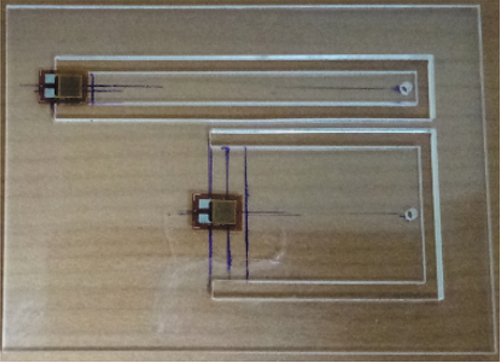
Figure 11. Loading of masses on the high stiffness sensor.
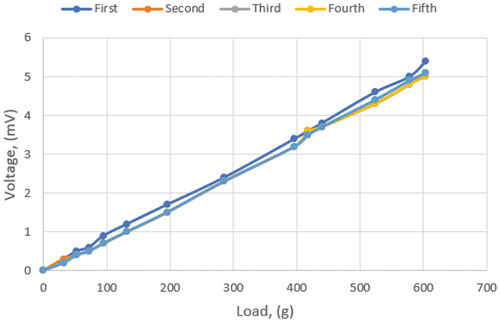
Figure 12. Unloading of masses on the high stiffness sensor.
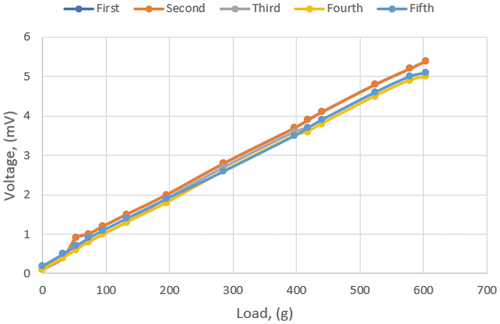
Figure 13. Loading of masses on the low stiffness sensor.
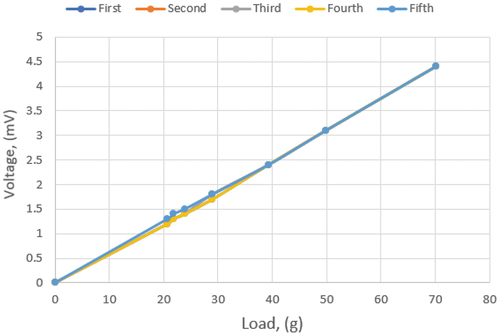
Figure 14. Unloading of masses on the low stiffness sensor.
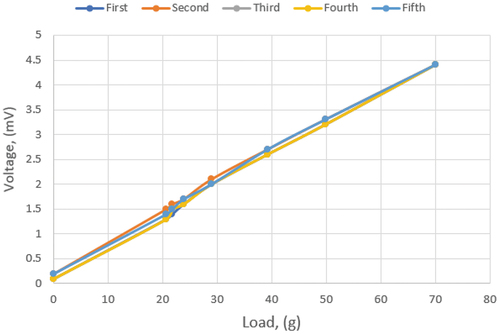
Figure 15. Calibration factor of the high stiffness sensor.
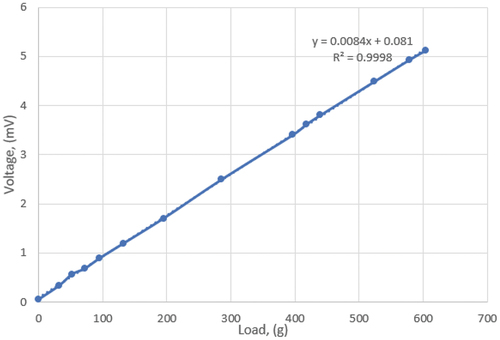
Figure 16. Calibration factor of the low stiffness sensor.
The value for the high stiffness sensor as shown in is 0.9998 with a calibration equation of
while that of the low stiffness sensor as shown in is 0.9996 with a calibration equation of
The strain gauge used in this work has a nominal resistance of , gauge factor of 2.00–2.20, gauge length of 3 mm, modified phenolic resin backing, constantan alloy foil with temperature compensation and creep compensation; high accuracy and good stability. The working temperature range of the strain gauge is −30 C to +80 C. The strain gauges were connected to a quarter bridge which comprised of two resistors with nominal resistance of
each and a variable resistor of
. ) shows the quarter bridge circuit.
Figure 17. Quarter bridge circuit.
3. Experimental testing
3.1. Testing using test pieces representing mangoes
To prove the two-tip configuration concept of stiffness measurement, five test pieces with different known stiffness values to represent mangoes were fabricated. Test pieces were selected as cantilevers to avoid any non-linearity in mangoes and to explicate the concept of measurement, as shown in . Each test piece consists of two cantilevers with the same width 5 mm and thickness 3 mm. However, changing the length of each test piece, gives variable stiffness. illustrates the change in stiffness due to the change in cantilevers lengths.
Figure 18. Test pieces with different known stiffness representing mangoes, dimensions in mm.
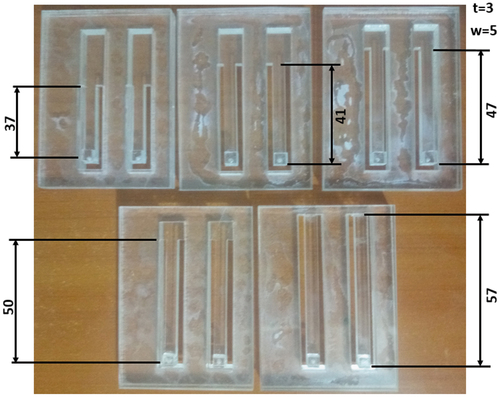
Table 1. Test pieces lengths and their stiffness
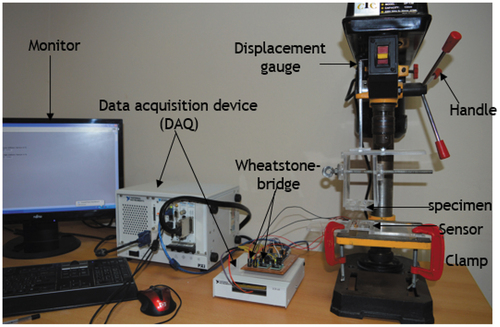
The experimental setup is illustrated in . It comprises of a special clamp which was designed and fabricated to hold the test piece; a displacement gauge was used measure the displacement moved between the sensor and the test piece, a handle to push the test piece towards the sensor. A data acquisition card was used to record the strain signals (two strain gauges, one on each cantilever). Each of these test pieces was tested with the sensor three times to ensure accuracy and repeatability.
Figure 19. Experimental set up for the test pieces.
) present the force ratio versus the displacement between the sensor and the test pieces, along with their average values.
Figure 20. Force ratio, P versus displacement, x for test piece with stiffness of 1998.89 N/m.
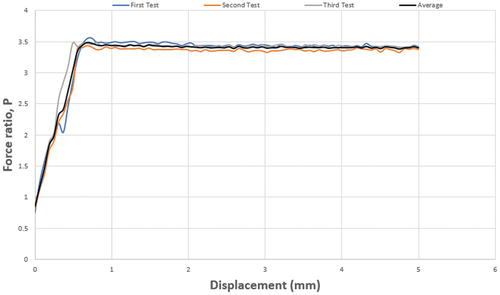
Figure 21. Force ratio, P versus displacement, x for test piece with stiffness of 1469.07 N/m.
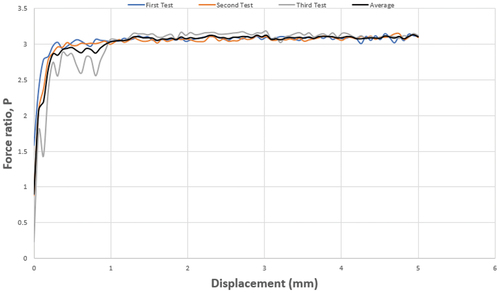
Figure 22. Force ratio, P versus displacement, x for test piece with stiffness of 975.22 N/m.
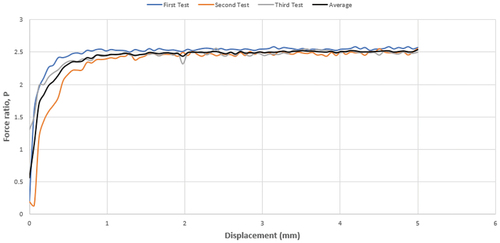
Figure 23. Force ratio, P versus displacement, x for test piece with stiffness of 810 N/m.
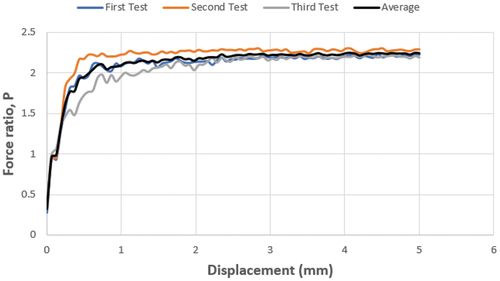
Figure 24. Force ratio, P versus displacement, x for test piece with stiffness of 546.73 N/m.
) shows the force ratio versus displacement of the test piece of the stiffness of 1998.89 N/m. The corresponding force ratio of this test of the stiffness, 1998.89 N/m is 3.64. ) shows the force ratio versus displacement of the test piece of the stiffness of 1469.07 N/m. The corresponding force ratio of this test of the stiffness, 1469.07 N/m is 3.09. ) shows the force ratio versus displacement of the test piece of the stiffness of 975.22 N/m. The corresponding force ratio of this test of the stiffness, 975.22 N/m is 2.5. ) shows the force ratio versus displacement of the test piece of the stiffness of 810 N/m. The corresponding force ratio of this test of the stiffness, 810 N/m is 2.2. Similarly, ) shows the force ratio versus displacement of the test piece of the stiffness of 546.73 N/m. The corresponding force ratio of this test of the stiffness, 546.73 N/m is 1.9. It can be seen from ) that the displacement pushed was 5 mm, and the sensor’s readings started attaining stability and linearity from about 1 mm of displacement. This is because the sensor and the test piece had not made full contact at the initial point of displacement. illustrates the comparison between the stiffness value for each test piece analytically, experimentally (average), simulation and their percentage error.
Table 2. Comparison of the experimental force ratio and the simulated force ratio of the test pieces relative to the analytical force ratio
3.2. Testing of mangoes
Since the sensor has shown an acceptable level of accuracy and repeatability in the experimental testing of the five test pieces with known stiffness values, as shown in , five mangoes from the hardest (stiffest) to the softest as shown in ) were tested. The experimental setup for the test on mangoes is as shown in .
Figure 25. Mangoes of different ripeness tested.
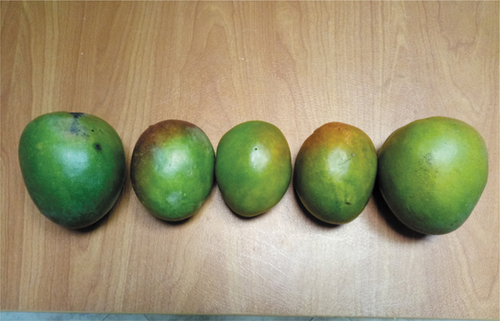
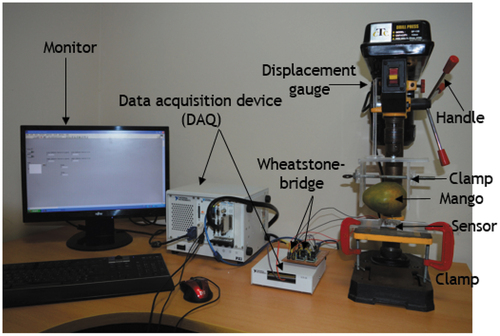
Figure 26. Experimental setup for the mangoes.
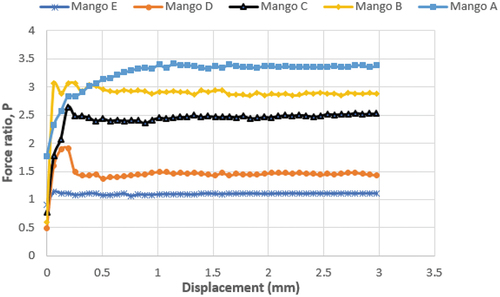
) show the three tests of the force ratio versus displacement of 3 mm of Mango A, B, C, D and E, respectively, with a corresponding force ratio of 3.37, 2.89, 2.49, 1.46 and 1.1, respectively. The results at the beginning is not stable because the mango surface is not flat as we assumed in the analytical and simulation, but after full contact it began to stabilize at around 1 mm of the displacement during the contact of the sensor and the mango.
Figure 27. Force ratio, P versus displacement, x for Mango A (stiffest).
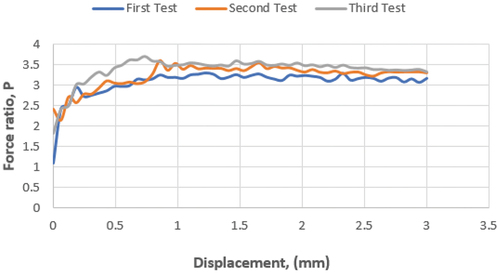
Figure 28. Force ratio, P versus displacement, x for Mango B.
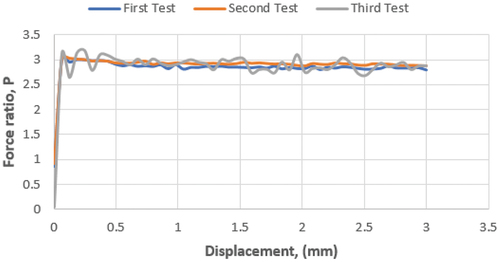
Figure 29. Force ratio, P versus displacement, x for Mango C.
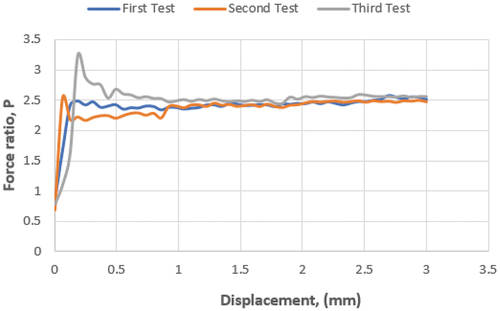
Figure 30. Force ratio, P versus displacement, x for Mango D.
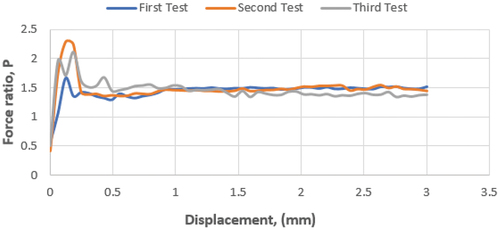
Figure 31. Force ratio, P versus displacement, x for Mango E (softest).
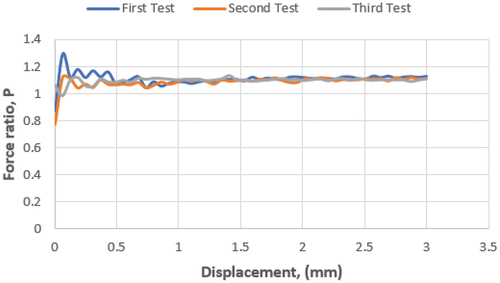
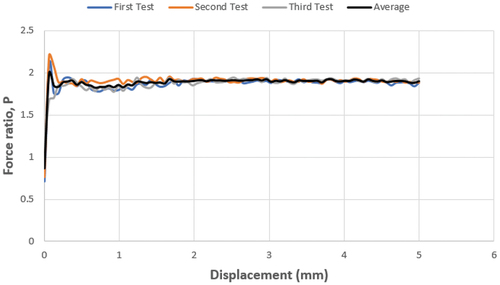
) shows the average of each force ratio of the mango tested versus the displacement pushed. It is seen in that the sensor distinguished clearly between the mangoes tested. Mango A is the mango with the highest stiffness, and it gave the highest force ratio which implies that during the contact between the sensor and Mango A, higher forces were generated due to its stiffness, similarly Mango E was the softest of all the mangoes tested which means Mango E had the lowest stiffness, and it gave the lowest force ratio. Also, the matching values of the force ratios from the averages of each mango in ) are 3.37, 2.89, 2.49, 1.46 and 1.10 for mango A, mango B, mango C, mango D and mango E, respectively. In order estimate the stiffness of these tested mangoes from their respective force ratios, Equation ((4)) was applied and the stiffness values for mango A, mango B, mango C, mango D, and mango E resulted to 1792.95 N/m, 1395.70 N/m, 1078.86 N/m, 317.15 N/m and 67.81 N/m respectively.
Figure 32. Average force ratio, P versus displacement, x for Mango A to Mango E.
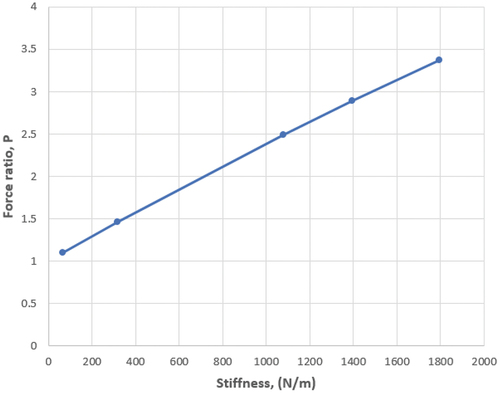
A relationship between the force ratio and the corresponding stiffness of the tested mangoes is shown in . ) shows that their is a linear relationship between the force ratio and the corresponding stiffness value of the mangoes. This implies that, as stiffness increases, the force ratio increases i.e stiffness is directly proportional to the force ratio. This is an indicator which proves an existing fact that as mangoes ripen, their stiffness reduces.
Figure 33. Relationship between force ratio versus stiffness of the experiments on mangoes.
4. Conclusion
This paper presented a piezoresistive dual tip stiffness sensor for mango ripeness assessment. The sensor is designed, simulated, fabricated and tested with linear samples with different known stiffness and with real mangoes that have different stiffness based on its ripeness. The simulation results of the stiffness of the selected test pieces, which mimics mangoes as compared to the analytical results shows that the maximum error does not exceed 2.7%, while the experimental results of test pieces that mimics mangoes as compared to the analytical results shows that the maximum error does not exceed 7%. The experimental results of the mangoes proves that the sensor’s performance in determination of the ripeness levels of mangoes based on their stiffness is high. The stiffness values of the mangoes tested from the stiffest to the softest (Mango A—Mango E) is 1792.95 N/m, 1395.70 N/m, 1078.86 N/m, 317.15 N/m and 67.81 N/m, respectively. It is evident from this work that as ripeness increases in mangoes, stiffness reduces and vice versa. The comparison of the analytical force ratio with the simulation and experimental force ratio of the test pieces is an indicator of the accuracy and repeatability of the sensor. This approach of mango ripeness detection is unique and will be able to complement existing ripeness detection methods like image recognition and colour segmentation. Finally, during the entire process of the experiment, no bio-yield point appeared on the mangoes; therefore, this can be considered a non-destructive test in mango ripeness detection.
Acknowledgements
The authors would like to thank the Pan African University Institute for Basic Sciences, Technology and Innovation (PAUISTI), Japan International Cooperation Agency (JICA), Egypt-Japan University of Science and Technology (E-JUST) and Science & Technology Development Fund (STDF) through the capacity building project (STDF-12417) for their financial support and access to enabling the authors use their research facilities and resources to accomplish this work.
Disclosure statement
No potential conflict of interest was reported by the author(s).
Additional information
Funding
Notes on contributors
Chiebuka T. Christopher
Chiebuka T. Christopher Christopher is a Lecturer in the department of Mechatronics Engineering, Bowen University Nigeria. His research interest include Mechatronics, sensors, energy studies, artificial intelligence and materials science.
Ahmed M. R. Fath Elbab
Ahmed M. R. Fath Elbab is a Professor in Egypt-Japan University of Science and Technology. He does research in MEMS, tactile sensor, energy harvesting devices and microfluidics.
Christian O. Osueke
Christian O. Osueke is a professor in Bowen University. His research interest include design, system analysis, automation, artificial intelligence, and manufacturing.
Bernard W. Ikua
Bernard W. Ikua is a professor in Jomo Kenyatta University of Agriculture and Technology. His research interest include Precision Engineering, manufacturing, machine design, non-traditional machining and mechatronics.
Daniel N. Sila
Daniel N. Sila is a professor of food science in Jomo Kenyatta University of Agriculture and Technology. His research interest include plant based foods and novel food processing technologies.
Ahmed Fouly
Ahmed Fouly is an assistant professor in Minia University. His research interest include MEMS, design and automatic control, Material science and tribology.
References
- Alan, D., Romulo, B., Neto, A. F., & Hernandez, L. N. (2017, February). Mango mechanical compression tests. Revista de Ciencias Agrarias, 40(2), 405–23 doi:10.19084/RCA16095.
- Aoyagi, R., & Yoshida, T. (2004, May). Frequency equations of an ultrasonic vibrator for the elastic sensor using a contact impedance method. Japanese Journal of Applied Physics, Part 1: Regular Papers and Short Notes and Review Papers, 43(5), 3204–3209. https://doi.org/10.1143/JJAP.43.3204
- Cárdenas-Pérez, S., Chanona-Pérez, J. J., Güemes-Vera, N., Cybulska, J., Szymanska-Chargot, M., Chylinska, M., Kozioł, A., Gawkowska, D., Pieczywek, P. M., & Zdunek, A. (2018, May). Structural, mechanical and enzymatic study of pectin and cellulose during Mango ripening. Carbohydrate Polymers, 196 5 , 313–321. https://doi.org/10.1016/j.carbpol.2018.05.044
- Cecchi, R., Verotti, M., Capata, R., Dochshanov, A., Broggiato, G., Crescenzi, R., Balucani, M., Natali, S., Razzano, G., Lucchese, F., Bagolini, A., Bellutti, P., Sciubba, E., & Belfiore, N. (2015, November). Development of micro-grippers for tissue and cell manipulation with direct morphological comparison. Micromachines, 6(1), 710–1728. https://doi.org/10.3390/mi6111451
- Dadwal, M., & Banga, V. K. (2012). Color image segmentation for fruit ripeness detection: A review,” In 2nd International conference on electrical, electronics and civil engineering, 18 (Singapore: ICEECE). pp. 190–193.
- Engel, J., Chen, J., Fan, Z., & Liu, C. (2005, January). Polymer micromachined multimodal tactile sensors. Sensors and Actuators. A, Physical, 117(1), 50–61. https://doi.org/10.1016/j.sna.2004.05.037
- Fath El-Bab, A. M. R., Eltaib, M. E. H., Sallam, M. M., & Tabata, O. (2007, May). A Tactile Sensor for Compliance Detection. Sensors and Materials, 19(3), 165–177 https://myukk.org/SM2017/sm_pdf/SM673.pdf.
- Fath El-Bab, A. M. R., Tamura, T., Sugano, K., Tsuchiya, T., Tabata, O., Eltaib, M. E. H., & Sallam, M. (2008). Design and simulation of a tactile sensor for soft-tissue compliance detection. IEEJ Transactions on Sensors and Micromachines, 128(5), 186–192. https://doi.org/10.1541/ieejsmas.128.186
- Fitmawati, M. S., Anjasmara, R., Sari, N., & Hefniati. (2017). Ripeness detection simulation of oil palm fruit bunches using laser-based imaging system. AIP Conference Proceedings, 1801 1 , 1–7 https://doi.org/10.1063/1.4973101.
- Fouly, A., Fath El-Bab, A. M. R., Nasr, M. N. A., & Abouelsoud, A. A. (2017a, February). Modeling and experimental testing of three-tip configuration tactile sensor for compensating the error due to soft tissue surface irregularities during stiffness detection. Measurement: Journal of the International Measurement Confederation, 98 5 , 112–122. https://doi.org/10.1016/j.measurement.2016.11.032
- Fouly, A., Fath El-Bab, A. M. R., Nasr, M. N. A., & Abouelsoud, A. A. (2017b). Design of micro tactile sensor for detecting soft tissue stiffness Serepitca, Victoria. In PhD as a Book (pp. 1–149). LAP LAMBERT Academic Publishing.
- Fouly, A., Nasr, M. N. A., Fath El Bab, A. M. R., & Abouelsoud, A. A. (2015). Design and modeling of micro tactile sensor with three contact tips for self-compensation of contact error in soft tissue elasticity measurement. IEEJ Transactions on Electrical and Electronic Engineering, 10(S1), 144–150. https://doi.org/10.1002/tee.22175
- Gomez, A. H., Hu, G., Wang, J., & Pereira, A. G. (2006, July). Evaluation of tomato maturity by electronic nose. Computers and Electronics in Agriculture, 54(1), 44–52. https://doi.org/10.1016/j.compag.2006.07.002
- Grotte, M., Duprat, F., Pitri, E., & Loonis, D. (2007, February). Young’s modulus, poisson’s ratio, and lame’s coefficients of golden delicious apple. International Journal of Food Properties, 5(2), 333–349. https://doi.org/10.1081/JFP-120005789
- Hayes, W. C., Keer, L. M., Herrmann, G., & Mockros, L. F. (1972). A mathematical analysis for indentation tests of articular cartilage. Journal of Biomechanics, 5(5), 541–551. https://doi.org/10.1016/0021-9290(72)90010-3
- Jarimopas, B., & Kitthawee, U. (2007, October). Firmness properties of mangoes. International Journal of Food Properties, 10(4), 899–909. https://doi.org/10.1080/10942910701221731
- Lee, M. H., & Nicholls, H. R. (1999, January). Review article tactile sensing for mechatronics—a state of the art survey. Mechatronics, 9(1), 1–31. https://doi.org/10.1016/S0957-4158(98)00045-2
- Nnodim, C. T., Fath El-Bab, A. M. R., Ikua, B. W., & Sila, D. N. (2019a, April). Estimation of the modulus of elasticity of mango for fruit sorting. International Journal of Mechanical and Mechatronics Engineering, 19(2), 1–10 http://ijens.org/Vol_19_I_02/191702-5858-IJMME-IJENS.pdf.
- Nnodim, C. T., Fath El-Bab, A. M. R., Ikua, B. W., & Sila, D. N. (2019b). Design and simulation of a tactile sensor for fruit ripeness detection. Lecture Notes in Engineering and Computer Science: World Congress on Engineering and Computer Science, 2019 2241 , 390–395 http://www.iaeng.org/publication/WCECS2019/WCECS2019_pp390-395.pdf.
- Peterlík, I., & Filipovic, J. (2011, August). Distributed construction of configuration spaces for real-time haptic deformation modeling. IEEE Transactions on Industrial Electronics, 58(8), 3205–3212. https://doi.org/10.1109/TIE.2009.2032438
- Praveena, S. M. (2017, May). Evaluation of fruit ripeness using electronic nose. International Journal of Advanced Information Science and Technology, 6(5), 1–5 doi:10.15693/ijaist/2017.v6i5.1-5.
- Sa, I., Ge, Z., Dayoub, F., Upcroft, B., Perez, T., & McCool, C. (2016). Deepfruits: A fruit detection system using deep neural networks. Sensors, 16(8), 1222. https://doi.org/10.3390/s16081222
- Sanchez, A. M., Prieto, R., Laso, M., & Riesgo, T. (2008, January). A piezoelectric minirheometer for measuring the viscosity of polymer microsamples. IEEE Transactions on Industrial Electronics, 55(1), 427–436. https://doi.org/10.1109/TIE.2007.910528
- Suwanratchatamanee, K., Matsumoto, M., & Hashimoto, S. (2010, March). Robotic tactile sensor system and applications. IEEE Transactions on Industrial Electronics, 57(3), 1074–1087. https://doi.org/10.1109/TIE.2009.2031195
- Suwanratchatamanee, K., Matsumoto, M., & Hashimoto, S. (2011, August). Haptic sensing foot system for humanoid robot and ground recognition with one-leg balance. IEEE Transactions on Industrial Electronics, 58(8), 3174–3186. https://doi.org/10.1109/TIE.2009.2030217
- Tsuji, T., Kaneko, Y., & Abe, S. (2009, May). Whole-body force sensation by force sensor with shell-shaped end-effector. IEEE Transactions on Industrial Electronics, 56(5), 1375–1382. https://doi.org/10.1109/TIE.2009.2014748
- Verzhuk, V. G., Murashev, S. V., & Belova, A. Y. (2012). Determination of tissue elasticity of apple, pear, and quince fruits for predicting losses during cold storage. Russian Agricultural Sciences, 38(4), 272–274. https://doi.org/10.3103/S1068367412040209
- Yossy, E., Pranata, J., Wijaya, T., Hermawan, H., & Budiharto, W. (2017). Mango fruit sortation system using neural network and computer vision. Procedia Computer Science, 117 10 , 596–603. https://doi.org/10.1016/j.procs.2017.10.013
- Zhang, M., Zheng, Y. P., & Mak, A. F. T. (1997). Estimating the effective Young’s modulus of soft tissues from indentation tests - Nonlinear finite element analysis of effects of friction and large deformation. Medical Engineering & Physics, 19(6), 512–517. https://doi.org/10.1016/S1350-4533(97)00017-9