
 ?Mathematical formulae have been encoded as MathML and are displayed in this HTML version using MathJax in order to improve their display. Uncheck the box to turn MathJax off. This feature requires Javascript. Click on a formula to zoom.
Abstract
Nowadays, video streaming has become one of the most dominant services due to increasing interest in watching online television programs and video-on-demand activities. Providing this service requires high quality, high speed and high-capacity network infrastructures. In this work, we propose a data-driven-based fuzzy logic inference algorithm for quality of experience (QoE) modeling of video streaming services in Addis Ababa City LTE network. The proposed fuzzy logic inference system model is used to measure the user perception from the key quality of indicator (KQI) parameters. The model is essential to replace conventional subjective measurement techniques that are costly and inefficient. In addition, the proposed fuzzy logic inference system model is helpful for business decision making, network planning and optimization activities. To analyze the performance of the proposed model, we consider main KQI parameters such as video streaming start success rate, video streaming start delay, video streaming play disconnection rate, video streaming stall frequency and video streaming stalled time rate. We perform numerical simulation to analyze the proposed model and to validate the impacts of main KQI parameters on the quality of experience in LTE video streaming services. The simulation results show that video streaming stall frequency and video streaming start delay rate play a major impact on user perception by 33% and 25%, respectively. Besides, validation of the results shows that the proposed fuzzy logic inference system model is accurate, consistent and linear compared to currently existing models.
PUBLIC INTEREST STATEMENT
Video streaming has become one of the most dominant services due to increasing interest in watching online television programs and video-on-demand activities. Providing this service requires high quality, speed and capacity network infrastructures. In this work, we develop data-driven based fuzzy logic inference algorithm for quality of experience modeling to video streaming services in Addis Ababa City LTE network. The proposed algorithm helps to measure the user perception from key quality of service parameters for video streaming services in LTE network. To analyze the performance of the proposed algorithm, we consider main key quality indicator parameters such as video streaming start success rate, video streaming start delay, video streaming play disconnection rate, video streaming stall frequency and video streaming stalled time rate. The proposed model is essential to replace conventional subjective measurement techniques that are costly and inefficient. It also helps for business decision making, network planning and optimization activities.
1. Introduction
According to the recent Cisco visual networking index, video traffic will quadruple and account for 82% of all IP traffic at the end of 2022 (Cisco, Citation2019). The forecast says that nearly half of all devices and connections will be video capable (Cisco, Citation2019). Hence, modeling, analyzing and characterizing video streaming algorithms and systems have become a hot area of research in both the academies and industries (G´omez et al., Citation2012; ITU-T, Citation2008). A video streaming can be either an integral part of a browser, plug-in, separate program or dedicated device. Video files may also include in embedded players. There are two types of streaming video content distribution such as on-demand and programmed-time streaming (ITU-T, Citation2008). On-demand streaming allows the viewer to choose what content to play at any time. This type of streaming increases the bandwidth costs due to the necessity of establishing a new network stream for each player. Whereas, programmed-time streaming requires a channel for a viewer at specific time that is programmed by the streamer. This type of streaming minimizes bandwidth costs as it broadcasts at one time. The quality of experience of the users can be measured from Quality of Service (QoS) parameters (Cisco, Citation2019; G´omez et al., Citation2012; ITU-T, Citation2008; Bajpai and Schonwalder, Citation2015).
Quality of experience (QoE) in mobile networks is defined by International Telecommunication Union (ITU) as the degree of delight of the user applications or services (Cisco, Citation2019; G´omez et al., Citation2012). QoE shows the overall acceptability of an application or service when perceived subjectively by the network users. It includes the complete end-to-end system effects such as client, terminal, network, services infrastructure and others. In this regard, QoE modeling aims to achieve high user expectations and requirements on network reliability and cost-effective communication, access to anytime and anywhere services, and interworking across multiple operator domains (G´omez et al., Citation2012). Whereas, due to the move toward converged all IP wireless network environments, modeling end-user QoE has become a challenging task. Besides, the overall acceptable QoE standard is influenced by user expectations and contexts. Therefore, QoE modeling is considered to be a multidimensional construct, encompassing both objective (performance-related) and subjective (user-related) aspects (Huang et al., Citation2018). Thus, to incorporate these multidimensional constructs, QoE has been modeled by using both the quality of service (QoS) which is primarily a technical, objective and model-oriented concept; and by using the user experience (Planel-Ratna & Juwaheer, Citation2021), which is generally considered as a more user-oriented concept. The former approach focuses on the impact of network and application performance on the perception of the user quality; while the latter approach primarily deals with the individual user’s experience derived from encounters with the system, and it is affected by expectations, prior experiences, feelings, thoughts and contexts (Planel-Ratna & Juwaheer, Citation2021).
Quality of service (QoS) shows the service providers ability to guarantee a certain level of consistent performance in the network to a data flow by means of monitoring and controlling. By using the key QoS parameters, QoE can be modeled subjectively and objectively (G´omez et al., Citation2012; Lo Duca & Marchetti, Citation2020). The subjective measurement is the mean opinion score (MOS) of the users perception. The MOS value is dependent on user factors such as user expectations, security requirements, demography, access types, user mobility and location, social contexts and others. In this regard, the MOS measurement has a 5-point scale score such as 5-Excellent, 4-Good, 3-Fair, 2-Poor and 1-Bad (G´omez et al., Citation2012). Whereas, subjective-based QoE measurement is costly, limited to a certain sample level, has insufficient system knowledge and difficult to take real-time measurements (G´omez et al., Citation2012), (Pal & Triyason, Citation2018).
However, objective based measurements estimate the QoE by using a parametric model and without the involvement of the users’ opinion. The parametric model is a function of the network-level end-to-end QoS parameters (BarakoviT & Skorin-Kapov, Citation2013). Objective-based QoE measurement is essential for user-centric service provisioning that help to deliver a service by considering the interest and satisfaction level of customers. Therefore, this approach helps the service provider to identify the customers’ interest and satisfaction level before delivering a service on market. The objective measurement provides several advantages for both the users and the service providers. It helps to predict QoE of a specific service from the most significant key quality indicator (KQI) parameters. Objective-based QoE modeling is network centric and can be measured objectively (G´omez et al., Citation2012; Pal & Triyason, Citation2018; Nasralla et al., Citation2018).
In this work, we develop a data-driven-based fuzzy logic inference algorithm for quality of experience (QoE) modeling for video streaming services in Addis Ababa City Long-Term Evolution (LTE) network. The model helps to measure the user perception from quality of service (QoS) parameters for video streaming services in Addis Ababa city LTE network. To develop the proposed model, first real network traffic data is collected from selected experimental customer survey and network management system (NMS) key quality indicator parameters. The experimental customer survey data is collected through the Internet by inviting individual LTE customers to watch online broadcasting television programs and then fill the questionnaires prepared on Google Sheet. The NMS data is collected from QoS monitoring platform in Ethio-Telecom QoS monitoring section. Then, extracting and categorizing the KQI parameters have been done to map the KQI parameters to the QoE features. Regression and correlation analysis is done to remove redundancy and to identify the relationship between each KQI parameter with the QoE. The coefficient influence analysis and weighting coefficients is used to show the impact of each KQI parameter on the QoE (ITU-T, Citation2008; Alakhras etal., 2020).
Then, the proposed data-driven-based fuzzy logic inference algorithm is developed. Finally, the performance of the proposed model is analyzed and validated by using experimental customer survey subjective test. The subjective test is done to analyze the relationship between the KQI parameters and QoE at different network performance and customer situations. The test considers the subjective context, expectation, terminal device performance, network quality and user experiences. Besides, the accuracy and consistency of the model has been validated through simulation. The results show that the proposed data-driven QoE model for video streaming services in Addis Ababa City LTE network is highly accurate, consistent and linear. The model is sufficient to evaluate the user satisfaction level and to evaluate the impact of KQI parameters on the user perception.
The rest of the paper is organized as follows. In Section 2, summary of the review of recent related works is provided. The system model and algorithm formulation are shown in Section 3.
Simulation results are discussed in Section 4 and conclusions are drawn in Section 5.
2. Review of related works
A survey of state-of the-art research work that address the field of QoE management, which include three management aspects such as QoE modeling, monitoring and measurement, and adaptation and optimization are shown in (BarakoviT & Skorin-Kapov, Citation2013). The authors identify and discuss the key aspects and challenges that need to be considered to model and design quality of experience of wireless networks. The authors in (Goel et al., Citation2016) show that end-to-end QoS and QoE measurements are very important guideline for network operators, developers, regulators, customers and researchers. Operators may use the data to identify network performance problems, developers may use the data to predict the future network, regulators may use to identify the best serving operator, customers may use to check the issue of quality within their own network or within the operators and researchers may use the data for academic study. The work in (Pedras & Sousa, Citation2017) proposed a novel QoE model for universal mobile telecommunication system (UMTS) voice services and long-term evolution (LTE) data services from QoS parameters. They employ machine learning algorithms and show that the results have a good correlation and small error variation.
The authors in (Huang et al., Citation2018) provide a survey of the state-of-the-art on data-driven approach for QoE modeling assessment. The result shows that QoE evaluation based on data-driven approach are significant in three aspects. First, with the age of big-data, operators can know more about the users behavior and interests. Second, QoE assessment based on data-driven approach uses real data from networks instead of test data from laboratories. Third, this approach can help to evaluate the QoE of the users without knowing anything about them.
The authors in (BarakoviT & Skorin-Kapov, Citation2013) propose objective QoE measurement models based on QoS parameters. They present the state-of-the-art on mobile QoE modeling and outline some of the key challenges. A fuzzy logic inference-based scheduling algorithm for multi-user scalable video streaming over orthogonal frequency division multiple access (OFDMA) channels in proposed in (Omiyi et al., Citation2020). The video streams are precoded using a scalable video coding (SVC) scheme. The algorithm prioritizes the transmission to different users by considering video content and channel conditions. A QoS-aware, content-aware and device-aware nonintrusive medical QoE prediction model over small cell networks is proposed in (Rehman et al., Citation2019). The proposed prediction model utilizes a Multilayer Perceptron (MLP) neural network to predict the QoE. It also acts as a platform to maintain and optimize the acceptable diagnostic quality through a device-aware adaptive video streaming mechanism. The model is trained for an unseen dataset of input variables such as QoS, content features and display device characteristics, to produce an output QoE value. The work in (Wang et al., Citation2017) proposed a data-driven QoE analysis framework for video streaming. They show that a small set of QoS parameters play an important role to determine the video streaming MOS values. They show that the weights of initial buffering latency, stalling times and stalling ratio is 69.01%. The work in (Umoh & Asuquo, Citation2018) proposes a fuzzy logic model to assess the QoS in multimedia transmission. It evaluates the major QoS parameters such as delay, jitter and packet loss. Then, they use these parameters as inputs to evaluate the QoS parameter requirements of each network. The model is used to detect and restore any QoS deterioration in real-time and thus provides a good and efficient QoS model for customer satisfaction.
In general, the above works show the different approaches and algorithms used for QoE modeling from real-time data. Whereas, the accuracy, consistency and linearity of the proposed models still needs further improvement and customization based network types, geographical, environmental and customers contexts. Hence, based on the reviewed literatures, in this work, we develop data-driven-based fuzzy logic inference algorithm for quality of experience modeling for video streaming in Addis Ababa City LTE networks.
3. System modeling and algorithm development
The methodology that we follow for data-driven-based QoE system modeling and algorithm development is shown in figure . As stated in Section 1, first the LTE video streaming data is collected from experimental customer survey and Ethio-Telecom ISP datasets.
Figure 1. Methodology and algorithm development.
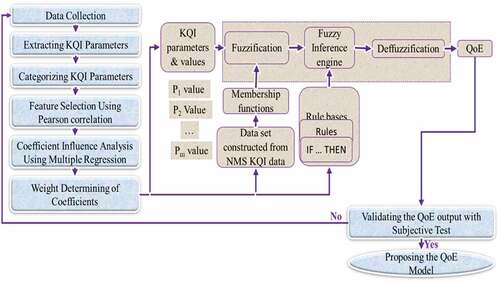
The NMS system datasets has an 1 hour KQI parameters collected from Addis Ababa LTE network video streaming services. An 8-month data, from 5 October 2018 to 5 July 2019, with a total size of 5,760 datasets have been collected. The customer survey data is collected by using subjective test on a streaming video in Addis Ababa LTE network.
The data analysis is performed with main KQI parameters, which have high impact on QoE of video streaming services. These include video streaming start success rate (SSR), video streaming start delay (SD), video streaming play disconnection rate (PDR), video streaming stall frequency (SF) and video streaming stalled time rate (STR; Lo Duca & Marchetti, Citation2020).
The SSR indicates the rate at which video streaming files are successfully played on a webpage after a user clicks the play button. It is the ratio of video streaming start success to video streaming start request (Wang et al., Citation2017). The SSR is affected by connect success rate, get response success rate and initial buffer success rate as (Technologies Ltd, Citation2015; Wang et al., Citation2017)
The PDR indicates the rate at which the downloading of a video streaming file stops or restarts before the video buffer is fully occupied due to the client or server fails to process the video service efficiently or the network transmission quality is poor (Technologies Ltd, Citation2015; Wang et al., Citation2017). The PDR is given by (Technologies Ltd, Citation2015; Wang et al., Citation2017)
The SD is the amount of time a user waits until a video streaming file is played after clicking the play button on a webpage. This KQI parameter depends on the end-to-end delay or latency. It is the sum of video streaming response delay, DNS query delay, TCP connection delay, get response delay and initial buffer delay as (Technologies Ltd, Citation2015; Wang et al., Citation2017)
The STR indicates the percentage of the total stall time out of the total length of the played video streaming file (Technologies Ltd, Citation2015; Wang et al., Citation2017). This KQI depends on the TCP download retransmission rate, the stalled duration (min), play times, video streaming download throughput and average download delay as
The SF is the number of times a video streaming file stalls within 1 minute when the file is being played. It depends on the stalled count, play times, video streaming download throughput (kbps), TCP download retransmission rate (%) and average download delay (min) as (Technologies Ltd, Citation2015; Wang et al., Citation2017)
3.1. Categorization of KQI Parameters
Categorizing KQI parameters used to map the impact of each parameter on the QoE features. In this work, the selected five KQI parameters are mapped with selected video streaming QoE features. The results from linear regression of the data are used to identify the relationship between the subjective MOS value and the KQI parameters (Wang et al., Citation2017). The KQI parameters are considered as independent input variables, and the QoE is considered as dependent output variable for the regression analysis. Based on the regression results, the relationship between the KQI and QoE is formulated as
where y denotes the output QoE value and {x1, x2, x3, x4} represents the input SSR, SD, PDR, SF and STR values, respectively.
3.2. Feature selection
We employ Pearson correlation to find the linear relationship between KQI parameters and the QoE. Pearson correlation helps to reduce the dimension of the dataset by removing the redundant parameters (Pedras & Sousa, Citation2017). If r represents the Pearson linear correlation, N denote the number of samples in the dataset, and x and y denote the mean value of KQI parameters and QoE, respectively; then, the Pearson correlation is defined as (Pedras & Sousa, Citation2017)
where Xi, Yi represents the KQI and QoE data sets (ITU-T, Citation2008).
3.3. Coefficient influence analysis
We employ coefficient influence analysis with four-way analysis of variance (ANOVA) method and multiple regressions to analyze the impact of each feature on the QoE of video streaming. Before the ANOVA analysis, the KQI parameters are normalized to have zero mean and unit standard deviation. Selecting the target range depends on the nature of the data. The general expression is given by (Huang et al., Citation2018)
where x is the data value, min(x) is the minimum value of the dataset and max(x) is the maximum value of the datasets. Independent weighting method can be used to determine the weight of each KQI parameter coefficient and to identify the impact of each KQI parameters on the QoE features. The weight can be calculated as (Huang et al., Citation2018)
When Bi denotes the correlation coefficient and wi denotes the weighted coefficient of each KQI parameter.
3.4. Data-Driven-based fuzzy inference algorithm for QoE prediction in LTE Video streaming
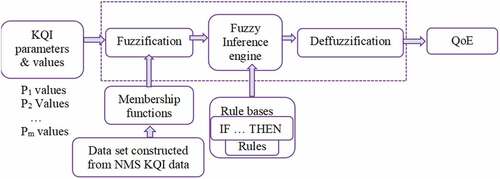
We propose data-driven-based fuzzy inference system (FIS) model as shown in figure to evaluate the video streaming QoE in Addis Ababa LTE network. The model incorporates the FIS with membership functions that is developed from the datasets prepared by using multiple regression and weighted coefficients.
Figure 2. Proposed fuzzy inference system (FIS)-based QoE model for video streaming service prediction.
3.5. Subjective test for proposed model analysis and validation
Finally, to show the performance and accuracy of the proposed data-driven-based fuzzy inference algorithm for QoE prediction, we compare the results from the proposed model with the subjective test results. Compared to objective tests, subjective methods are more accurate to formulate the user opinion. An objective model may not predict an average subjective opinion more accurately than the test subjects. Hence, validation should be done to show if the output of objective models is well correlated with subjective results. In this case, the subjective measurement is considered as the ground truth for user QoE evaluation. Hence, we validate our data-driven fuzzy logic inference model by using the subjective methods with the collected survey data.
4. Simulation results and analysis
4.1. Analysis of measured survey data
As stated in Section 3, the data measurement is taken for Addis Ababa LTE network that consists of a total 329 LTE sites all over the city. The experiment includes all these sites considering ten zones at different time of the day. The collected data includes data from four time schedules such as morning, afternoon, evening and during the night. Whereas, The NMS system datasets has a one hour KQI parameters collected for the LTE network video streaming services. An 8-month data, from 5 October 2018 to 5 July 2019, with a total size of 5,760 datasets have been collected.
The results are generated based on the KQI parameters analysis and simulation from the proposed model. The results from real data analysis show the relationship between KQI parameters and their influence on the user perception. Whereas, analysis of results from the proposed data-driven-based FIS model is used to analyze the model accuracy, consistency and linearity.
First, by using the survey data, we calculate average MOS value of LTE video streaming. The average MOS value of subjective measurements obtained with experimental customer survey data is 3.92. Based on the results in (G´omez et al., Citation2012), a 3.92 MOS value is approximated as a good satisfaction level on MOS scale rating. And this result indicates that the video streaming services in Addis Ababa LTE network has a satisfaction level of good. Hence, Ethio-Telecom should do further analysis to identify the reasons of quality degradation and to develop a model that improve the user satisfaction level to level of excellent in MOS scale rating.
(a)-(e) shows the histogram plot for SSR, SD, PDR, SF and STR results, respectively. The results show the mean and standard deviation of video streaming KQI dataset collected for 8 months. As shown in (a), the SSR has an average value of above 75%, whereas (b)-(e) shows an average value of 10 ms SD, 8% PDR, 0.3x/min SF and 9% STR, respectively.
Figure 3. Histogram plot for SSR, SD, PDR, SF and STR.
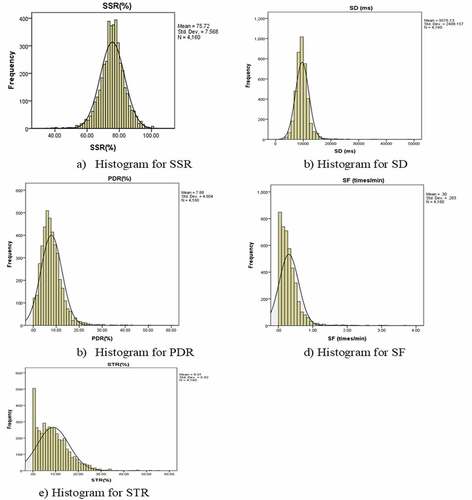
From the histogram results and data analysis, we calculate the mean, median, standard deviation, minimum and maximum value of the KQI parameters, as shown Table . Based on these statistical parameters, it may be possible to say the QoS is good or bad. But, only this justification does not guarantee to know that the required QoE has been achieved or not. Also the impact of each KQI parameter on the QoE should be identified and analyzed. Besides, there should be an algorithm or a model that help to measure the QoE of video streaming from these KQI data. Hence, we perform further data analysis and algorithm development to identify the impact of KQI parameters on the video streaming QoE.
Table 1. Video streaming KQI data analysis result
Correlation analysis is done to select the important features and to reduce the dimension by removing the redundant KQI parameters. The correlation result is used to identify the impact of each KQI parameter on the user perception. For subjective data, correlation has been done between KQI parameters obtained from participants response among themselves and with individuals opinion score. The results in Table show that SF and STR are correlated by 80.8%. And this shows that they have redundant information. Therefore, one of them should be ignored. We ignore the STR value since it is less correlated with the MOS value. The result also shows that SD and SF have high correlation magnitude value; thus, they have high impact on the customer satisfaction.
Table 2. Correlation result of the subjective KQI parameters
The results from multiple regressions are shown in . The results in Table validate that the data from the regression is consistent and accurately estimated.
Table 3. Summary of the regression result
Table 4. ANOVA result of the objective dataset
Table 5. Coefficients of the regressed objective dataset
Whereas, the ANOVA result in Table shows zero significant value, zero residual mean square and high F-value. This shows that the regression estimates accurately. Table shows coefficient of the regressed dataset with zero significant value and high t-value. The result also shows that the dependent variable is highly influenced by input independent parameters. Therefore, the output MOS can be determined by input KQI parameters.
From the above results, we can show that the average value of the standard deviation is less than 0.002 and this shows that the distribution of the data has less variation. Hence, the linear model from objective data can be formulated as
where y represents the output MOS value and {x1, x2, x3, x4} represents input KQI values. Independent weighting method (Adeolu & An Szucs, Citation2019; Bouraqia etal., 2020) is used to determine the weight of each coefficient of the KQI parameters. This helps to identify the impact of each KQI parameter on the user perception. This is done by applying independent weighting method on the magnitude of beta coefficients in Table and from EquationEquation (10)(10)
(10) . The result of the analysis is shown in Table .
Table 6. Weight coefficients of KQI parameters
Therefore, the value of the KQI parameters are calculated as SF is 33%, SD is 25%, SSR is 23% and PDR is 19%. These values also validate the accuracy of the results obtained during correlation.
4.2. Analysis of proposed data-driven-based fuzzy inference algorithm for QoE Modeling
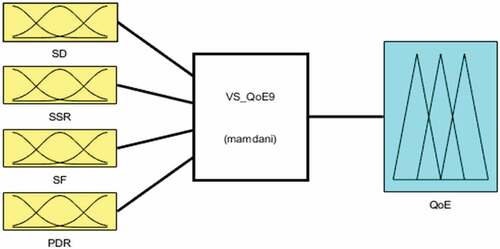
We analyze the proposed data-driven-based fuzzy logic inference algorithm for QoE modeling that take the above KQI parameters as input and QoE value as an output. For the simulation, we use the MATLAB fuzzy logic toolbox (Umoh & Asuquo, Citation2018). figure shows the four input parameters of the model such as SD, SSR, SF and PDR. We deploy Mamdani type inference system with 81 inference rules (Adeolu & An Szucs, Citation2019; Siris et al., Citation2014). The output of the model represents the QoE of the video streaming services.
Figure 4. Proposed data-driven-based algorithm for QoE modeling in LTE video streaming service.
The membership functions are obtained from the probability distribution function (pdf) of the input and output relationship. The output pdf can be triangular, trapezoidal, Gaussian or bell curves. In this work, based on the relationship between the KQI parameters and the output QoE values, the input and output parameters are selected to have a triangular pdf. The triangular curve represents the member function of input vector x and depends on three scalar parameters as (Adeolu & An Szucs, Citation2019; Lin & Yin, Citation2020; Matulin Štefica Mrvelj & Mrvelj, Citation2018; Umoh & Asuquo, Citation2018; Alreshoodi etal., 2015)
The fuzzy logic inference rule maps the input fuzzy sets into an output fuzzy set. The input fuzzy sets are operated by a logical AND operation. The result of the logical operation determines the output fuzzy set. The weight of each KQI parameter coefficients from Table has been considered to include their influence. Therefore, the output fuzzy set is determined by the sum of the product of each KQI parameter fuzzy score as
where based on Table , the value of the weight coefficients are SSR = 0.23, SD = 0.25, PDR = 0.19 and SF = 0.33. This shows that the MOS score for the condition of “IF SD is medium AND SF is medium AND PDR is medium AND SF is medium” is given by
EquationEquation (13)(13)
(13) shows a quality level of Good in the output fuzzy set. The result of each inference rule is aggregated with the maximum rule and become ready for defuzzification. During model execution, all the rules determine the result with the minimum rule and aggregate the final output with the maximum rule, then a final value is obtained after defuzzification. The results can be displayed by using rule viewer or surface viewer.
The rule viewer in figure shows the result in columns. It has a vertical red line on each input parameter and by moving this line to the left and right, it shows the impact of each parameter on the output QoE value. Except SSR, all inputs increase the QoE when the red line moves to the left. This shows that they are inversely correlated with the QoE. Whereas, the SSR increase as the red line moves to the right which means it is positively correlated with the QoE.
Figure 5. Partial QoE results with rule viewer.
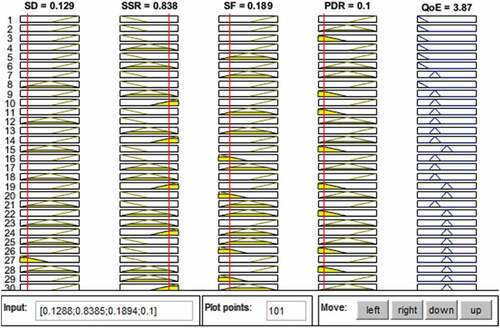
For instance, the QoE is 3.87 when SD = 0.129, SSR = 0.838, SF = 0.189 and PDR = 0.1. The yellow shaded triangular pdf within each input parameter shows the value of the fuzzy score and their operation aggregates the final output. The QoE shall be obtained from the defuzzification of the aggregated fuzzy scores.
The surface viewer displays the results in three-dimensional view. It displays the variation of the two KQI parameters when the other two are being constant. For the simulation, we use KQI parameters of SSR = 0.95, SD = 0.1, SF = 0.1 and PDR = 0.1. As shown in figure , the yellow color shows the best QoE value, whereas the blue color shows the worst QoE value.
Figure 6. Surface viewer results of the QoE parameters.
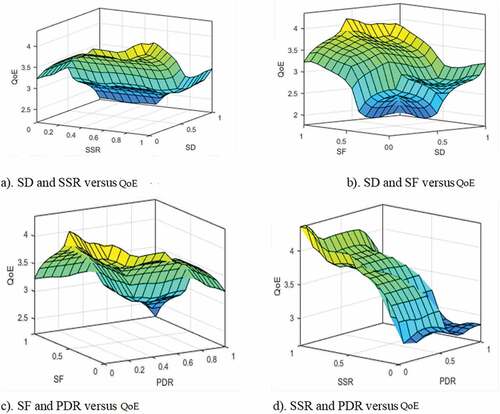
shows the impacts of SSR and SD when PDR and SF are being constant. The graph shows that the QoE increases with SSR and decreases with SD. Thus, the maximum QoE value (MOS = 4) is scored at SSR = 1 and SD = 0. The result also show that when the SSR is less than 0.6 and SD is above 0.5, the QoE is below 2.5, and this indicates poor in MOS scale value and unacceptable for LTE video streaming service. shows the impacts of SD and SF when SSR and PDR being constant. The result shows that both parameters have inversely related with the QoE. Thus, the maximum QoE values is scored at SD = 0 and SF = 0. Similarly, shows the impacts of SF and PDR on QoE when SD and SSR are being constant. The result shows that the best user perception is scored (MOS = 3.5) when SF and PDR is below 0.1. And, this shows a good service value on MOS scale. Finally, shows the impacts of SSR and PDR when SD and SF being constant. The results shows that it gives the highest MOS value that is above 4.5. This is achieved at SSR = 1 and PDR = 0. Again, the QoE is below 1 on the MOS scale, when the SSR is below 0.5 and the PDR is above 0.5. This shows that the user perception is more sensitive with SSR and PDR. If the values of these parameters are highly degraded, the user perception would be considered as no service delivered.
4.3. Model validation with experimental customer survey data
The performance and accuracy of the proposed data-driven-based fuzzy inference algorithm for QoE modeling is validated by using experimental customer survey data. The accuracy of the model has been evaluated, and the root mean square (RMSE) results are shown in Tables , VIII and IX. The result in Table confirms that the proposed model has a good accuracy. As explained in (The Mathwork Inc, Citation2019), an R value above 0.68 is accurate for linear regression. The RMSE value of 0.03175 also shows a good accuracy relative to existing models.
Table 7. Regression results of subjective and simulated QoE values
Table shows the results from ANOVA analysis of the subjective and simulated QoE value. The result shows a residual mean square error of 0. 001, which is acceptable and this confirms that the proposed model is highly consistent. Table shows the linear regression coefficients of the subjective QoE and simulated QoE values.
Table 8. ANOVA results for subjective and simulated QoE values
Table 9. Regression coefficient of subjective and simulated MOS values
The above results show that the relation can be approximated with linear curve fitting. The model for linear curve fitting is shown in figure . The linear curve fitting shows that the simulated and subjective QoE values have linear relationship with very small variation.
Figure 7. Curve fitting result of subjective and simulated MOS.
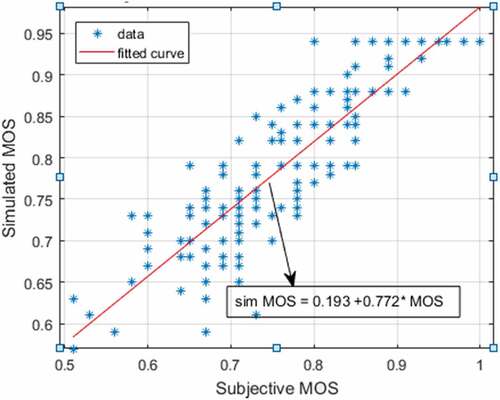
Finally, shows the result of Pearson correlation of the subjective MOS and simulated MOS values. The result shows that the subjective and simulated MOS values have above 93.2% correlated. Hence, their relationship is linear with this percentage amount and which is also a good value (The Mathwork Inc, Citation2019).
Table 10. Correlation result between subjective and objective MOS values
In general, the validation of the model results the best performance for all the three metrics. The proposed algorithm is highly accurate since RMSE = 0.03175, and it is highly consistent as the residual mean square is 0.001. The linearity of the model achieves 93.2% correlation and which is also best in linearity compared to existing models.
5. Conclusion
In this work, we have proposed data-driven-based quality of experience model using fuzzy logic inference algorithm for video streaming services in Addis Ababa city LTE network. The results show that the model can be used to replace conventional subjective measurement techniques that are costly and inefficient. The correlation, regression and ANOVA analysis results show that the KQI parameters have a great impact on QoE of LTE network video streaming. The coefficient influence analysis has shown that the SF value has high impact on video streaming, which is 33% and SD also plays critical role by 25%. This implies that the network performance on the capacity and delay parameters should be further investigated to improve the QoE. The proposed fuzzy inference algorithm for QoE modeling to LTE video streaming has good accuracy, consistency and linearity. The RMSE value of 0.03175 indicates better accuracy in prediction result. A residual mean square error of 0.001 also shows the consistency of the model. 93.2% Pearson correlation result shows the linearity of the model. Therefore, the model has better performance than current existing models. Hence, we highly recommend Ethio-Telecom to deploy the proposed fuzzy logic inference algorithm for QoE modeling to LTE video streaming. Analyzing the performances of different distributions of the membership functions and considering more datasets and subjects shall be the possible future works.
Disclosure statement
No potential conflict of interest was reported by the author(s).
Additional information
Funding
Notes on contributors

Amare Kassaw Yimer
Amare Yimer received the BSc degree in Electrical Engineering from Bahir Dar University in 2006 and the MSc degree in Electrical Engineering (Communication Systems Engineering) from Addis Ababa University in January 2011. He has got the PhD degree in Electrical Engineering in March 2021 from Addis Ababa University under the supervision of Prof. Dr.-Ing. Abelhak Zoubir in Signal Processing Group at Technical University of Darmstadt and Dr.-Ing. Dereje Hailemariam at Addis Ababa University. Currently, he is assistant professor at Bahir Dar University where he delivered lectures in Digital Communication, Wireless and Mobile Communication, Statistical Signal Processing and Machine Learning; and Fundamentals of Detection and Estimation Theory. Besides, he has participated on several researches and projects in the area of transportation systems, signal processing, ICT and wireless communication. His current research interests include massive MIMO systems, mmWave communication, resource allocation and optimization in wireless networks, quality of service and quality of experience modeling in mobile communication, machine learning and deep learning algorithms.
References
- Adeolu, O. D., & An Szucs, K. (2019). Towards Fuzzy analytics for digital video advertising campaign effectiveness and customer experience. International Journal of Fuzzy Logic and Intelligent Systems, 19(4), 332–18. https://doi.org/10.5391/IJFIS.2019.19.4.332
- Alakhras, M., 1, Oussalah, M., & Hussein, M. (2020). A survey of fuzzy logic in wireless localization. EURASIP Journal on Wireless Communications and Networking, 89 (2020)(). https://doi.org/10.1186/s13638-020-01703-7
- Alreshoodi, M., Olufemi, A., Woods, J., & Walker, S. (2015). Fuzzy logic inference system-based hybrid quality prediction model for wireless 4kUHD H. 265-coded video streaming. IET Networks, 4(6), 296–303. https://doi.org/10.1049/iet-net.2015.0018
- Bajpai, V., & Schonwalder, J. (2015). A survey on internet performance measurement platforms and related standardization efforts. IEEE Communications Surveys and Tutorials, 17(3), 1313–1341. https://doi.org/10.1109/COMST.2015.2418435
- BarakoviT, S., & Skorin-Kapov, L. (2013). Survey and Challenges of QoE Management Issues in Wireless Networks. Hindawi Journal of Computer Networks and Communications, 2013, 1–28. https://doi.org/10.1155/2013/165146
- Bouraqia, K., Sabir, E., Sadik, M., & Ladid, L. (2020). Quality of Experience for Streaming Services: Measurements, Challenges and Insights. IEEE Access, 8 (2020), 13341–13361. https://doi.org/10.1109/ACCESS.2020.2965099
- Cisco. Cisco visual networking index: Global mobile data traffic forecast update, 2018–2023 white paper. https://www.cisco.com/c/en/us/solutions/collateral/executive-perspectives/annual-internet-report/white-paper-c11-741490.pdf.(2019)
- G´omez, G., Torres, E., Lorca, J., Garc´ıa, R., & P´erez, Q. (2012). Quality of experience evaluation for data services over cellular networks. Scitepress Digital Library, 387–396.
- Goel, U., Wittie, M. P., Claffy, K. C., & Le, A. (2016). Survey of end-to-end mobile network measurement test beds, tools, and services. IEEE Communications Surveys and Tutorials, 18(1), 105–123. https://doi.org/10.1109/COMST.2015.2485979
- Huang, R., Wei, X., & Zhou, L. (2018). A survey of data-driven approach on multimedia QoE evaluation. Frontiers of Computer Science 12 (2018) 1060–1075 https://doi.org/10.1007/s11704-018-6342-7 .
- ITU-T. (2008). G.1080: Quality of experience requirements for IPTV services. International Telecommunications Union Recommendation, 47(10), 110–116.
- Lin, C.-T., & Yin, Y. (2020). A base on fuzzy theory to supplier evaluation and selection optimization. Hindawi Journal of Discrete Dynamics in Nature and Society, 2020, 1–5. https://doi.org/10.1155/2020/5241710
- Lo Duca, A., & Marchetti, A. (6, 2020). Design and implementation of a web application for cultural heritage. HighTech and Innovation Journal . 1, 72–85 doi: 10.28991/HIJ-2020-01-02-04.
- The Mathwork Inc. (2019). Fuzzy Logic Toolbox Users Guide. (https://www.mathworks.com/help/fuzzy/).
- Matulin· Štefica Mrvelj, M., & Mrvelj, Š. (2018). Modeling user quality of experience from objective and subjective data sets using fuzzy logic. Springer Multimedia Systems, 24(6), 645–667. https://doi.org/10.1007/s00530-018-0590-0
- Nasralla, M. M., Khan, N., & Martini, M. G. (2018). Content-aware downlink scheduling for LTE wireless systems: A survey and performance comparison of key approaches. Computer Communications, 130, 78–100. https://doi.org/10.1016/j.comcom.2018.08.009
- Omiyi, P. E., Nasralla, M. M., Rehman, I. U., Khan, N., & Martini, M. G. (2020). An intelligent Fuzzy logic-based content and channel aware downlink scheduler for scalable video over OFDMA wireless systems. Electronics, 9(7), 1071. https://doi.org/10.3390/electronics9071071
- Pal, D., & Triyason, T. (2018). A survey of standardized approaches towards the quality of experience evaluation for video services: An ITU perspective. International Journal of Digital Multimedia Broadcasting, 2018, 1–25. https://doi.org/10.1155/2018/1391724
- Pedras, V., & Sousa, M. 2017. “Antenna tilt optimization using a novel QoE model based on 3G radio measurements,” 20th International Symposium on Wireless Personal Multimedia Communications (WPMC) 17-20 Dec. 2017 Bali, Indonesia, pp. 124–130.
- Planel-Ratna, C., & Juwaheer, T. D. (2021). Assessing the impact of digitalization and technology on patient compliance in healthcare services. HighTech and Innovation Journal, 2(3), 216–223. https://doi.org/10.28991/HIJ-2021-02-03-06
- Rehman, I. U., Nasralla, M. M., & Philip, N. Y. (2019). Multilayer perception neural network-based QoS-aware, content-aware and device-aware QoE prediction model: A proposed prediction model for medical ultrasound streaming over small cell networks. Electronics, 8(2), 194. https://doi.org/10.3390/electronics8020194
- Siris, V., Balampekos, K., & Marina, M., “Mobile quality of experience: Recent advances and challenges,” IEEE International Conference on Pervasive Computing and Communications (PERCOM2014) 24-28 March 2014 Budapest, Hungary, pp. 425–430, 2014.
- Technologies Ltd, H. (2015). “SEQ analyst KQI and KPI modeling summary”. Addis Ababa.
- Umoh, U., & Asuquo, D. (2018). Fuzzy logic based quality of service evaluation for multimedia over wireless Adhoc networks. Journal of Computational Intelligence and Applications, 5(21), 12–30 https://doi.org/10.1142/S1469026817500237.
- Wang, Q., Dai, H., Wang, H., & Wu, D., “Data-driven QoE analysis on video streaming in mobile networks,” IEEE International Conference on Ubiquitous Computing and Communications 12-15 Dec. 2017 (IEEE)doi:DOI: 10.1109/ISPA/IUCC.2017.00168 Guangzhou, China, 2017.