
 ?Mathematical formulae have been encoded as MathML and are displayed in this HTML version using MathJax in order to improve their display. Uncheck the box to turn MathJax off. This feature requires Javascript. Click on a formula to zoom.
Abstract
All the countries are in needs of renewable energy (RE) penetration into their power system. As Bangladesh power system (BPS) depends on fossil fuel by 99% of its total generation capacity, it is very much focusing on having RE. In its Western grid, it has planned to install 55 MW wind turbine generator (WTG) and 100 MW solar photovoltaic generator (SPVG). It is expected that the system will be upset from stability perspective. To increase the power system security, contingency analysis is needed. But the power system operation parameters are always variable, with conventional load flow method, it is impossible to carry out contingency analysis according to such variations in parameters. So, this present work adopts machine learning (ML) to predict the contingency analysis by determining the performance indices (PI) with variable operating conditions in a quick time. Decision tree (DT), random forest (RF) and extra tree (ET) methods based supervised learning will be used to predict the result for the contingency analysis. Comparison among these methods will be carried out to get the most suitable one. Also, due to RE penetration, the system will be vulnerable to voltage due to reduction in reactive power. Adoption of static synchronous compensator (STATCOM) will help to reduce the voltage stress of the system. Effective location of it is very essential, so that it can enhance the voltage stability. In this paper, modal analysis technique will be used to find out the optimal location for a STATCOM and to calculate the enhancement in stability.
PUBLIC INTEREST STATEMENT
Renewable energy has been very popular to get integrated with any existing power system. It needs reliability and security too like conventional power systems. Contingency analysis is a key parameter to increase the security of the power system. As the power system depends on numerous variables, it is not always feasible to carry out contingency in a short time. Moreover, renewable energy is weather dependent. Adoption of machine learning (ML) algorithms can solve this issue by handling several variables in the power system. If the system is learnt with some real parameters that come from real scenarios, ML can predict or classify the issues of unknown or later events. Thus, it enables power system operators to adjust the system operating parameters quickly to attain the reliability of a power system with renewables. Also, adoption of Flexible AC Transmission System (FACTS) enables the system to increase the stability with a high percentage of renewable energy systems. This paper shows several ML algorithm-based contingency analysis of Bangladesh Power System with prospective highly renewable energy penetration besides the improvement in steady state stability with STATCOM (static synchronous compensator) in the most effective bus of it.
1. Introduction
Power system consists of so many appliances like transmission line, generator, transformer, circuit breaker, relays, etc. Outage occurs due to the failure of any equipment. For a secure power system operation, it must be maintained without loss of its loads. So proper power system operational planning is needed. Severity of outages of different elements thus needs to be studied. It helps to avoid the emergency condition where limits of power system parameters are crossed. Contingency analysis allows to find out the severity of outages and its impact on the system so that operators can plan for a secure operating condition and increase reliability (Abdullah, Citation2020). Ranking is the vital issues of contingency analysis where critical contingencies are determined among large cases of contingencies and marking them according to severity (Gita & Kumar, Citation2020). Security analysis consists of optimal dispatch where the operation may be economically optimal but may not be secure, post contingency where violation of parameters are identified with contingency, secure dispatch where adjustment in operating parameters are considered from previous contingency, secure post contingency where continuation of power system maintained even in the event of contingency (Wang et al., Citation2013). Global power flow, fast decoupling method, and cloud modelling are reviewed in Harisha et al., (Citation2020) as methods of analysis. However, classical contingency analysis (CA) is unable to differentiate safe operating region from likely threatening one in term of voltage stability which is one of the prime factors for power system security. In Bulat et al. (Citation2021), enhanced CA is proposed which includes modal based static voltage analysis with CA.
Grid tied SPVG and WTG are getting popularity day-by-day targeting microgrid concept. It mainly encounters reliability problem as energy sources are variable in nature. Authors found random forest (RF) method as the most suitable for energy forecasting and they designed a hybrid system based on SPVG and WTG (Barua & Barua, Citationin press). In (Tawfiq et al., Citation2021), authors used modified adaptive accelerated particle swarm optimization (MAACPSCO) algorithm in IEEE_EPS_24 bus to construct a grid tied SPVG system to attain optimum generating reliability. Multi-objective particle swarm optimization (MOPSO) based optimization technique was used to size a SPVG, WTG and battery composed hybrid energy system for a heavily disrupted grid (Samy et al., Citation2021). BPS is also going to incorporate 34% RE penetration into its Western grid which consists of 55 MW WTG and 100 MW SPVG (Barua, Barua, Quamruzzaman, Rabbani et al., Citation2021a). It will also phase out equivalent amount of synchronous machine (SM) from its system. So, loss of reactive power and inertia are expected. From the stability perspective, the Western grid will face steady state stability problem. In Barua & Quamruzzaman (Citation2018a, Citation2018b), authors showed that the steady state stability limit of BPS without any RE is 198% of its loading at Western grid. With RE penetration, the stability limit will be determined again. It is certain that the stability limit will be reduced as RE systems has limitations in generating reactive power. So, a shunt flexible alternating current transmission system (FACTS) device will be adopted to increase the stability limit. STATCOM is preferred as shunt FACTS device. It provides or absorbs reactive power depending on its voltage magnitude with the system bus (Barua, Barua, Quamruzzaman, Rabbani et al., Citation2021b). As the resources are scarce in Bangladesh, optimal location of STATCOM is necessary. So mostly stressed bus due to loading in RE penetrated system needs identification. The particular stressed bus will be the perfect choice for STATCOM location. This will reduce the voltage stress in the system than any other bus with STATCOM.
Load flow analysis is a conventional way to determine the contingency. The changes take place in voltage and transmission line power flow are evaluated to find out the performance index which is then used to find out the very sensitive outage location (Putri & Afandi, Citation2019). This conventional way requires much time and every time the system needs contingency analysis with changing parameters of the system like loading, generators effective output, plant capacity, etc. Moreover the conventional method cannot be used for online security assessment. Machine learning is a promising tool to eradicate the problem that lies in conventional method (Yang et al., Citation2020). In (Schaefer et al., Citation2020), Authors used regression and classification methods to either estimate bus voltage & loading of line or to determine critical loading cases using time steps. They worked on different machine learning models, such as multilayer perceptrons (MLPs), DT, k-nearest neighbors, gradient boosting, and determined the training and prediction duration along with prediction errors. In Schäfer et al., (Citation2018), artificial neural network (ANN) was used to carry out contingency analysis. Deep analyses of this method were applied on a real German 110 kV sub-transmission grid situated in Karlsruhe and IEEE57 bus system was used for verification. Both the prediction error and time were significantly low. Tree methods are also very useful tools for both supervised and unsupervised learning (Meng et al., Citation2020). It requires less computations. Power system is full of uncertain parameters, tree methods can handle this uncertainty by statistical method (Bugaje, Cremer, Sun, Strbac et al., Citation2021a; Liu et al., Citation2013). The principle is to extract off-line data of a target problem and reorder them into decision trees which are suitable for on-line use. This facilitates to predict about unseen and new cases. Trees are spontaneously built on the learning set of variables. To get good prediction, it should be trained with numerous cases.
Modal analysis technique (Barua & Quamruzzaman, Citation2018a) is a good tool which can be used to find out optimal location for STATCOM. Modal analysis technique helps to find out the most stressed bus of the system. Besides Modal analysis, V-Q sensitivity analysis (Lee & Song, Citation2019) can also be used to justify the mostly stressed buses to select proper location for STATCOM also. Contingency analysis can be performed by real and reactive power performance of its parameters. More severe elements of the system have more impact on its performance index.
The noteworthy contributions of present paper are as follows:
Contingency analysis of Western grid to rank the most critical transmission lines and to make a dataset using conventional load flow method.
Decision tree, random forest and extra tree model based contingency analysis and comparison.
Selection of mostly stressed bus to locate a STATCOM using Modal analysis and V-Q sensitivity analysis technique.
Steady state stability analysis of the system with and without STATCOM to show the voltage stresses.
This paper is organized as section 2 describes the analysis technique. Machine learning algorithms which are carried out in this work, are discussed in section 3. Methodology is provided in section 4. Result and discussion section is given in section 5. At last, the conclusion is stated in section 5.
2. Analysis technique
2.1. Modal analysis technique
In a stable voltage system, the voltage magnitude increases with the VAR inclusion. If the voltage level does not increase or decrease even after VAR injection, then the system can be said voltage unstable (Kundur, Citation1994). Modal analysis technique deals with Eigenvalues and the Eigenvectors of sparse Jacobian matrix. Eigenvector shows the participation of each parameter and its severity. Least Eigenvalues are always crucial to study any power system as they cause the instability of the system much faster than other Eigenvalues. Jacobian matrix helps to linearize the highly non-linear power system. Sensitivity among real power, reactive power, and transmission angle and bus voltage can be represented as Equationequation (1)(1)
(1) .
where ΔP = change in real power, ΔQ = change in reactive power, Δθ = change in transmission angle, and ΔV = change in voltage bus.
If ΔP is set to 0, then the sensitivity between reactive power and voltage can be analyzed. In Barua & Quamruzzaman (Citation2018a) Q-V modal analysis technique was performed using Jacobian matrix Jr in reduced form to scrutinize Eigenvalue and Eigenvector of the power system. The relation between ΔQ and ΔV can be shown in Equationequation (2)(2)
(2)
The reduced Jacobian matrix jr can be evaluated by analyzing EquationEq. (3)(3)
(3) as given below (Barua & Quamruzzaman, Citation2018a)
Let
where Ѱ = Right Eigenvector matrix of matrix jr.
Ʌ = Diagonal Eigenvalue matrix of matrix jr.
Ø = Left Eigenvector matrix of matrix jr.
From Eq. (2)
ΔV = ѰɅ−1Ø ΔQ or ΔV = Σi (Ѱi Øi)/ λi ΔQ
where is ith eigenvalue, Ѱi is the ith column right eigenvector, and Øi is the ith row left eigenvector.
The ith modal variation can be written as
2.2. Contingency selection
Outages of power system elements may not overload all other healthy transmission lines or may not cause voltage sag. So selection of particular elements whose parameters are violated due to contingency is called contingency selection. By calculating severity indices which is also known as performance indices (PI), the contingencies are marked. Using conventional power flow method, the PI can be obtained. High value of PI takes the top rank position, and significantly high rank value is of great concern. Generally, reactive power performance index (PIv) and real power performance index (Pip) are considered to evaluate the total PI (Burada et al., Citation2016).
PIp reveals the changes in active power flow through transmission line due to particular outage. It can be expressed by
where Pi = active power flow in line i, Pimax = maximum active power flow in line i, n is the specified exponent, j is the total number of transmission lines in the system, W is the weight or importance measure of any transmission line where difficulty in handling its operation to secure it at contingency can make the importance measure high even if the violation of operating parameters are low.
Voltage performance index can be written as below
where Vi = Voltage of bus I, Vimax and Vimin are maximum and minimum voltage limits, Vnom is average of Vimax and Vimin, and j is the total number of load buses in the system.
3. Tree-based machine learning
Tree-based algorithms are mostly used in case of supervised learning. They can sort nonlinear relationship with good accuracy (Waseem Ahmad, Reynolds et al., Citation2018). Decision Tree (DT), Random Forest (RF) and Extra Tree (ET) are used in this present work. In supervised learning algorithms, the DT algorithm can be used for solving regression and classification problems. The purpose of adopting DT is to compose a training model that is able to predict the class or value of the target variable by understanding simple decision rules derived from previous data (training data; Bugaje, Cremer, Sun, Strbac et al., Citation2021b). DT is started from the root of the tree. Root attributes are compared with the recorded attributes; based on the comparison, a branch is followed as per respective value and then search for next node.
RF uses ensemble learning, which is a strategy that join many classifiers to deliver solutions to complex problems (Negnevitsky et al., Citation2015). A RF algorithm stands on many DT. The “forest” constructed by the RF algorithm is trained through bagging or bootstrap aggregating. Bagging is an ensemble meta-algorithm that enhances the accuracy of machine learning algorithms. The algorithm establishes the outcome based on the predictions of the decision trees. It foretells by taking the average or mean of the output from various trees. Enlarging the number of trees increases the accuracy of the output. A RF emancipates the limitations of a DT algorithm. It reduces the overfitting of datasets and increases precision. It generates predictions without requiring many configurations in packages. Extremely Randomized Trees Classifier (Extra Trees Classifier) is a type of ensemble learning algorithm which accumulates the outcomes of several orthogonal decision trees collected in a “forest” to output its classification result (Waseem Ahmad, Mourshed et al., Citation2018). In principle, it is very much related to a RF classifier and only difference is the way of construction of the DT in the forest. Each DT in the ET is composed from the trivial training sample. Then, at each test node, each tree is given with a random sample of k features from the feature-set from which each decision tree must select the best feature to spread the data based on some mathematical criteria (generally the Gini Index). This unspecified sample of properties lead to the construction of several de-correlated DT. To demonstrate feature selection using the above forest structure during the manufacture of the forest, the normalized total reduction in the mathematical criteria is used in the decision for each feature. The best method among tree methods can be selected by accuracy and error it exhibits (Chicco et al., Citation2021; Joshi et al., Citation2020). Following errors can be taken into consideration to analyze the best algorithms.
Root mean square error (RMSE): It reveals information on the short-term performance of the prediction models. Its value is always positive and is expected to be around 0.
Mean absolute percentage error (MAPE): It is the percentage of the mean of the absolute values of projected errors to the absolute values of original data. The more low value of it means the more high response. Value less than 10% means high accuracy. Any value between 10–20% represents good prediction accuracy. It should not exceed 50%, where it becomes inaccurate. MAPE can be expressed as follows:
where A = actual value, F = forecasted value, n = sample step, and t = time step.
Mean absolute error (MAE): Mean absolute error is an estimation of errors between paired observations revealing the same phenomenon.
R2 (square) value: The coefficient of determination is a statistical computation that investigates how differences in one variable can be expressed by the difference in a second variable, when projecting the outcome of a given event .This way provides understandings about how well a model can predict a set of measured data. Its value is between 0 and 1. The R2 value closed 1 is a sign of better exhibition.
4. STATCOM
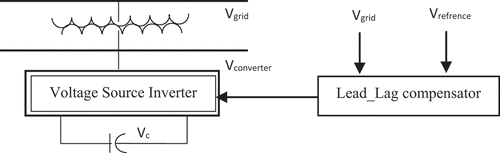
STATCOM is made of converter which can act as either inductor or capacitor being connected parallel with the grid. The output from the converter is always in phase with the grid as it is unable to supply real power without any energy source. If voltage magnitude of the converter is higher than the grid, STATCOM supplies reactive power to the grid (Mosaad et al., Citation2021). It receives reactive power when converter voltage magnitude is lower than the grid. It works more effectively than other shunt flexible AC transmission system (FACTS) devices as it maintains its rating in the event of lower grid voltage. To cope with the grid disturbances, a suitable controller is needed to direct the STATCOM to supply or absorb the corresponding reactive power in order to reduce the grid voltage disturbances. With the load increment, the voltage gets down to make the system vulnerable. Placing STATCOM in a suitable place ensures the maximum use of it. As RE will replace SM from the system, reactive power reduction will be a real challenge in the transmission system. STATCOM shows a promising solution for the future RE based power system. Figure shows a typical STATCOM diagram.
Figure 1. STATCOM.
5. Load modelling
Load modelling is an important parameter to find out the characteristics of the system. With the emergence of smart grid, modelling of loads is getting changed day by day. In Arif et al. (Citation2018), prospective smart metering with improved data mining and clustering technique is discussed. In this paper, static load model is of particular interest as it cares about steady state stability limit. Traditional exponential load model is used to model the load
Here,
P, Q = present active, reactive load; P0, Q0 = initial active, reactive load; U = present node voltage; U0 = initial node voltage; f0 = rated frequency; ∆f = change in frequency due to loading; FP = value from 0 to 3; and F0 = value from −2 to 0.
Load models in (12) & (13) depend on exponent parameter. With the exponent value 0, 1, and 2, the load model becomes constant power, constant current, and constant impedance load respectively (NEPLAN, Citation2018).
6. Methodology
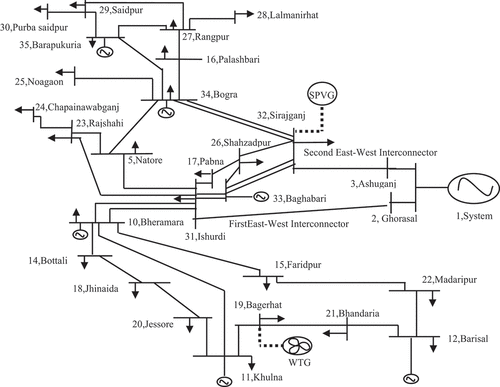
BPS has a Western grid region, and the stability limit of the system was analyzed in (Alam et al., Citation2012; Barua, Barua, Quamruzzaman, Rabbani et al., Citation2021b; Barua & Quamruzzaman, Citation2018a, Citation2018b). It will incorporate 55 MW WTG and 100 MW SPVG in Western grid region while equivalent SM will be phased out. Definitely it will lose reactive power and inertia with the removal of SM. The system will lack power system security as BPS is expected to be more vulnerable with RE penetration from stability perspective. To increase the power system security, the PI of the system is analyzed with line outage contingencies. Line outages are ranked according to the severity of impact on operation parameters. All the lines are shown in Figure which also depicts the Western grid of the system.
Figure 2. Western grid of BPS.
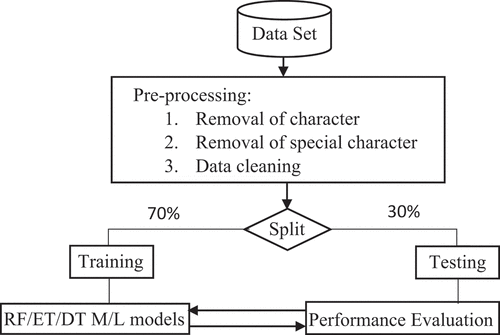
Now PI is determined using machine learning. First of all a data set is developed using conventional load flow method. Outages of lines are attributed and changes in voltage and transmission lines are recorded at any particular loading of all the load buses.
Generating buses, load buses and outages are taken as input and performance indexes are taken as output in the data set. Before selecting features for input and output we preprocessed the dataset. To process the dataset we used data cleaning and special character removal. In the phase of data cleaning we removed the null values occurred from phasing out of the lines itself. As line outages are taken as a character parameter with specials while preparing the dataset, it is converted to recognizable number during pre-processing. It is then spread between two groups. 70% of data is used for training and 30% of data is used for testing as shown in Figure . Line outage, real and reactive power load and generation, base voltage and changed voltage, line power and power flow are taken as input while PIv and PIp are taken as output. The data is trained with decision tree, random forest and extra tree based model. Successful training is evaluated with testing sets. Finally the results are analyzed with all three ML algorithms based on statistical methods such as R2, R.M.S.E, M.A.E, M.A.P.E.
Figure 3. Flowchart of ML.
The steady state stability is checked with the RE penetration in the BPS system. In (Barua & Quamruzzaman, Citation2018a), the steady state stability without any RE incorporation was found at 198% of loading. As expected, the limit should be reduced with the RE and replacement of synchronous machines of equivalent amount. So, a STATCOM of 200 MVAR or 2 p.u is adopted. Now to find the location of STATCOM for its maximum effectiveness, the mostly stressed bus is determined using Modal analysis technique. With the least Eigenvalue, the bus with most participation is selected as the mostly vulnerable bus. To test the bus further V-Q sensitivity is also analyzed. The bus which is very sensitive to the change of reactive power, is the mostly stressed bus. With these two ways, the suitable location for the STATCOM is selected. To show the maximum effectiveness, the STATCOM is placed at other buses also to compare with the selected suitable bus as a location.
7. Result and discussion
With the outages of line, the PIv and PIp are calculated. The PI is then evaluated. The PI value is ranked as per Table . Table reveals that L 10–15 (Bheramara to Faridpur) is the most critical outage which has PI of 10.146489, so it can be ranked 01. Next critical line is L 19–21 (Bagerhat to Bhandaria), which has PI of 9.668634 and can be ranked 02. All other lines are tabled chronically as per their respective PI value. Now a data set is generated to train the machine to predict the PI with known and unknown input. As the parameter of power systems is continuously variable, it is not feasible to calculate contingency variably. Dataset constructed from classical CA can be used to train for CA using ML method. So, CA can be done almost accurately though the inputs are variable without much computational complexity like classical methods. Using decision tree, random forest and extra tree model, the training is accomplished. 30% of data from data set are then used to test the trained data. shows the comparison of the three models used for supervised training for voltage performance index (PIv). The table depicts the most accurate algorithm is ET method which has 97.017% accuracy. R2 measures the accuracy, which is simply the accounting of the variation in the data. As ET has the most value, it can explain the most variation in the data than other two.
Table 1. Ranking of PI
Table 2. Comparison of tree methods (PIv)
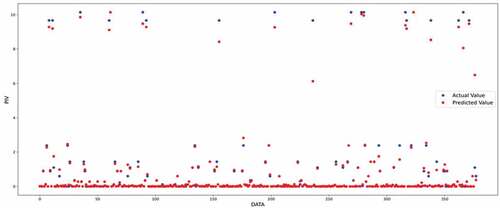
Table shows the comparison of the three models used for supervised training. The table depicts the most accurate algorithm is ET method which has 97.017% accuracy. While DT and RF have 96.082% and 96.737% respectively. ET has the least RMS error, 0.384. Which means that the deviation between actual value and predicted value is the least with ET. DT has the most deviation. MAE, with the least value means the prediction is the most perfect. MAPE is equivalent of MAE but gives value in percentage. The problems lies in ET are the MAE and MAPE, which are the largest in comparison to other two algorithms. Based on accuracy and less error, eventually DT is preferred. Figure shows the predicted value of PIv with DT algorithm. From Figure , it is seen that around 400 data are used to test the prediction accuracy which is 30% of total data.
Figure 4. PIv prediction using DT algorithm.
To do the same for real power performance index (PIp), ET and RF algorithms are adopted. Table represents the comparison between RF and ET methods. RF shows higher accuracy with 99.997% and lower errors, so it is preferred to predict PIp. Predicted data are shown in Figure . Almost 550 data are used to test the algorithm’s prediction which is again 30% of total data of PIp. In a recent work (Toubeau et al., Citation2022), the contingency analysis was done for a Belgium transmission grid with RE. Authors have found RF method as the best among the comparison with Naïve Bayes Classifier, Support Vector Machine and Tree based methods. The accuracy was just above 90%.
Figure 5. PIp prediction using RF algorithm.
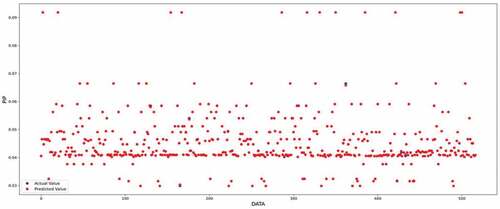
Table 3. Comparison of tree methods (PIp)
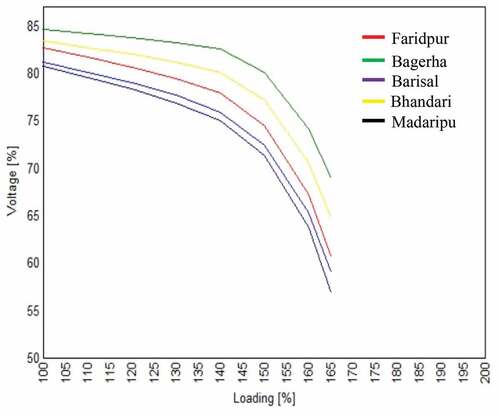
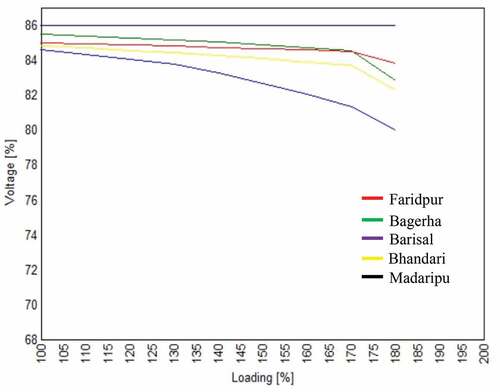
To find out the mostly stressed bus, Eigenvalue sensitivity is analyzed and the least Eigenvalue is found as 1.359. The bus with highest bus participation with the least Eigenvalue is the Madaripur bus which participation factor is 0.277986. Bus participation factor with the least Eigenvalue is depicted in Figure . Gradually, Barisal, Faridpur, Bhandaria and Bagerhat are the next four most stressed bus. To justify the Madaripur bus as the mostly stressed bus, V-Q sensitivity is analyzed and illustrated in Figure . The curve shows that the Madripur bus has the steepest V-Q relation. Any change in reactive power in this bus causes large changes in the voltage. Hence, Madaripur is the most sensitive bus. Now the steady state stability is analyzed with highly penetrated RE in Western grid, as per Figure the limit is observed at 165% of loading. The mostly stressed bus is B_22 Madaripur bus as its voltage gets downward with the increasing of loading. Figure also reveals other four stressed buses which are: Barisal, Faridpur, Bhandaria, and Bagerhat which takes the place as per previously analyzed Figure Bus participation factor
Figure 6. Bus participation factor.
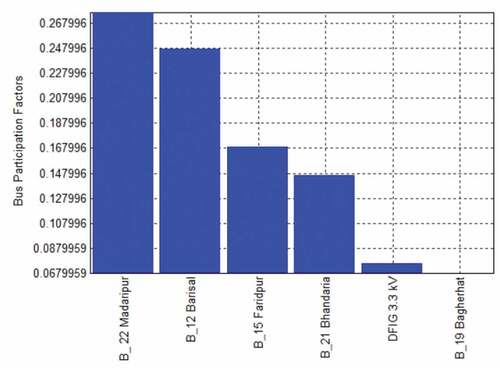
Figure 7. V-Q sensitivity.
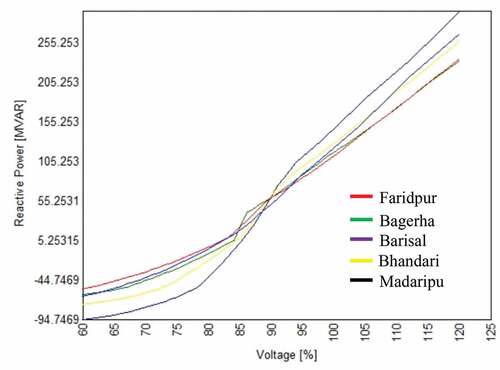
Figure 8. Steady state stability with RE penetration.
Madaripur bus is the most suitable location for 2 p.u STATCOM as it is the most vulnerable one. A STATCOM is placed in Madaripur bus and the steady stability is again analyzed. The new stability limit is found at 183% of loading as shown in Figure . So, with the aid of a STATCOM the stability limit is enhanced by 18%. As per setting of STATCOM terminal voltage which is 87%, the voltage is maintained even after loading. Voltage of other buses also never comes down below 80% after the adoption of STATCOM which hit as low as 57% without it.
Figure 9. Stability enhancement with STATCOM.
8. Conclusion
In this work, contingency analysis of western grid of BPS is carried out and stability is enhanced using STATCOM at a suitable place. As power system parameters depend on variable loads, generations and operating schedules, contingency phenomenon changes randomly. To carry out the contingency analysis with such variables much time span is needed. To heal this complicacy machine learning algorithm is adopted. This paper uses RF, DT and ET methods to train the data set. DT is found most suitable for PIv with 96.082% accuracy and RF is found suitable for PIp with 99.997% accuracy. Combination of predicted PIv and PIp will determine the mostly stressed outage of the system. To increase the steady state stability limit of highly renewable energy penetrated a STATCOM is used. To find the best location in term of stability, Madaripur bus is selected. Eventually steady state stability is enhanced by 18%.
Nomenclature
| RE | = | Renewable Energy |
| BPS | = | Bangladesh Power System |
| WTG | = | Wind Turbine Generator |
| SPVG | = | Solar Photovoltaic Generator |
| ML | = | Machine Learning |
| PI | = | Performance Index |
| DT | = | Decision Tree |
| RF | = | Random Forest |
| ET | = | Extra Tree |
| STATCOM | = | Static Synchronous Compensator |
| MAACPSCO | = | Modified Adaptive Accelerated Particle Swarm Optimization |
| MOPSO | = | Multi objective particle swarm optimization |
| SM | = | Synchronous Machine |
| FACTS | = | Flexible AC Transmission System |
| MLP | = | Multilayer Perceptron |
Disclosure statement
No potential conflict of interest was reported by the author(s).
Additional information
Funding
Notes on contributors
Pollen Barua
Pollen Barua received his B.Sc. in E.E.E from University of Science and Technology Chittagong in 2012 and M.Sc. in E.E.E from Chittagong University of Engineering and Technology in 2018. He served as a deputy manager of Electrical dept. in Western Marine Shipyard Ltd and electrical instructor in Bangladesh Marine Academy. He is currently working as a Head Electrical Instructor in MAS Marine Academy. His research area includes power system stability and capacity analysis, power system security, renewable energy in marine environment, energy storage system, control system, marine electrical system, etc. The present paper will enable Bangladesh Power System to search for renewable energy penetration very soon as it will also have the security and reliability like conventional. email: [email protected]
References
- Abdullah, M. A.-S. (2020). Contingency selection and ranking for composite power system reliability evaluation. Journal of King Saud University - Engineering Sciences, 32 (2), 141–15. 1018-3639. https://doi.org/10.1016/j.jksues.2018.11.004
- Alam, M. S., Razzak, M. A., Shafiullah, M., & Chowdhury, A. H. (2012). Application of TCSC and SVC in damping oscillations in Bangladesh power system, 7th International Conference on Electrical and Computer Engineering, pp. 571–574.
- Arif, A., Wang, Z., Wang, J., Mather, B., Bashualdo, H., & Zhao, D. (2018, November). Load modeling—A review. IEEE Transactions on Smart Grid, 9(6), 5986–5999. https://doi.org/10.1109/TSG.2017.2700436
- Barua, P., Barua, R., Quamruzzaman, M., & Rabbani, M. G. 5-7 August 2021b. Small signal stability and transient stability improvement of bangladesh power system using TCSC, SVC and TCSC, STATCOM based series shunt compensator, The International Conference on Science and Contemporary Technologies (ICSCT) 2021, Bangladesh University of Business and Technology (BUBT), Dhaka, Bangladesh, pp. 1–5
- Barua, P., & Quamruzzaman, M., Steady state voltage vulnerability and stability limit analysis of bangladesh power system using STATCOM as a shunt compensator, 4th International Conference on Electrical Engineering and Information & Communication Technology (iCEEiCT), pp. 1–4, 2018a. https://doi.org/10.1109/ICEEICT.2018.8628122.
- Barua, P., & Quamruzzaman, M., Comparison between TCSC, SVC and TCSC, STATCOM based compensation on East West interconnectors of Bangladesh power system, 4th International Conference on Electrical Engineering and Information & Communication Technology (iCEEiCT), pp. 4–8, 2018b, https://doi.org/10.1109/ICEEICT.2018.8628054.
- Barua, P., Barua, R., Quamruzzaman, M., & Rabbani, M. G. (2021a). Influence of large scale solar power on stability of east west interconnector system of Bangladesh power system, 5th International Conference on Electrical Engineering and Information & Communication Technology (iCEEiCT), Military Institute of Science and Technology (MIST), Dhaka-1216, Bangladesh, pp. 1–4, https://doi.org/10.1109/ICEEICT53905.2021.9667859.
- Barua, P., & Barua, R. (In Press). Machine learning based solar energy forecasting and wind-solar based hybrid grid arrangement at Patenga coastal area, 2021 International Conference on Power, Electrical, Electronic and Industrial Applications (PEEIACON), Publisher: IEEE
- Bugaje, A.-A. B., Cremer, J. L., Sun, M., & Strbac, G. (2021a). Selecting decision trees for power system security assessment. Energy and AI, 6 (100110), 2666–5468. https://doi.org/10.1016/j.egyai.2021.100110
- Bugaje, A.-A. B., Cremer, J. L., Sun, M., & Strbac, G. (2021b). Selecting decision trees for power system security assessment. Energy and AI, 6 (100110), 2666–5468. https://doi.org/10.1016/j.egyai.2021.100110
- Bulat, H., Franković, D., & Vlahinić, S. (2021). Enhanced contingency analysis—A power system operator tool. Energies, 14(4), 923. https://doi.org/10.3390/en14040923
- Burada, S., Joshi, D., & Mistry, K. D., Contingency analysis of power system by using voltage and active power performance index 1st, International Conference on Power Electronics, Intelligent Control and Energy Systems (ICPEICES), 2016, pp. 1–5.
- Chicco, D., Warrens, MJ., Jurman, G. 5 July 2021. The coefficient of determination R-squared is more informative than SMAPE, MAE, MAPE, MSE and RMSE in regression analysis evaluation. PeerJ Computer Science, 7, e623. https://doi.org/10.7717/peerj-cs.623
- Gita, K., & Kumar, A., Contingency ranking for security analysis of power system network with incorporation of STATCOM, International Conference on Electrical and Electronics Engineering (ICE3), 2020, pp. 71–75.
- Harisha, K., Sonaxi, B., & Raikar. (2020). A review on contingency analysis methods of electrical power system, International Journal of Advanced Science and Technology. 4210–4222. Science and Engineering Research Support Society. http://sersc.org/journals/index.php/IJAST/article/view/21149
- Joshi, A., Khosravy, M., & Gupta, N. (2020). Machine learning for predictive analysis, proceedings of ICTIS 2020 by Springer nature.
- Kundur, P., Power system stability and control, PART III, system stability 1994 edited by M. Hill. McGraw-Hill, Inc.
- Lee, Y., & song, H. (2019). A reactive power compensation strategy for voltage stability challenges in the Korean power system with dynamic loads. Sustainability, 11(2), 326. https://doi.org/10.3390/su11020326
- Liu, C., Rather, Z., Chen, Z., & Bak, C. L. (2013). An overview of decision tree applied to power systems. International Journal of Smart Grid and Clean Energy 2(3),413–419 https://doi.org/10.12720/sgce.2.3.413-419.
- Meng, X., Zhang, P., & Zhang, D. (2020). Decision tree for online voltage stability margin assessment using C4.5 and relief-F algorithms. Energies, 13 (15), 3824. 10.3390/en13153824. https://doi.org/10.3390/en13153824
- Mosaad, M. I., Ramadan, H. S. M., Aljohani, M., El-Naggar, M. F., & Ghoneim, S. S. M. (2021). Near-optimal PI controllers of STATCOM for efficient hybrid renewable power system. IEEE Access, 9, 34119–34130. https://doi.org/10.1109/ACCESS.2021.3058081
- Negnevitsky, M., Tomin, N., Kurbatsky, V., Panasetsky, D., Zhukov, A., & Rehtanz, C. (2015). A random forest-based approach for voltage security monitoring in a power system, IEEE Eindhoven Power Tech, pp. 1–6.
- NEPLAN, smarter tools V 5.5.3, 2018. www.neplan.ch/[email protected]
- Putri, M. D. M., & Afandi, A. N., Performance Index Analysis (PIA) for N-1 contingency transmission in 150 kV electricity system, International Conference on Electrical, Electronics and Information Engineering (ICEEIE), 2019, pp. 1–5.
- Samy, M. M., Mosaad, M. I., El-Naggar, M. F., & Barakat, S. (2021). Reliability support of undependable grid using green energy systems: Economic study. IEEE Access, 9, 14528–14539. https://doi.org/10.1109/ACCESS.2020.3048487
- Schaefer, F., Menke, J.-H., & Braun, M. (2020). Evaluating machine learning models for the fast identification of contingency cases. In Applied AI Letters (vol. 1, issue 2). John Wiley & Sons Ltd. https://doi.org/10.1002/ail2.19
- Schäfer, F., Menke, J., & Braun, M., Contingency analysis of power systems with artificial neural networks, 2018 IEEE International Conference on Communications, Control, and Computing Technologies for Smart Grids (SmartGridComm), 2018, pp. 1–6, https://doi.org/10.1109/SmartGridComm.2018.8587482.
- Tawfiq, A. A. E., El-Raouf, M. O. A., Mosaad, M. I., Gawad, A. F. A., & Farahat, M. A. E. (2021). Optimal Reliability Study of Grid-Connected PV Systems Using Evolutionary Computing Techniques. IEEE Access, 9, 42125–42139 https://doi.org/10.1109/ACCESS.2021.3064906.
- Toubeau, J.-F., Pardoen, L., Hubert, L., Marenne, N., Sprooten, J., De Grève, Z., & Vallée, F. (2022). Machine learning-assisted outage planning for maintenance activities in power systems with renewables. Energy, 238(PC), 121993. Part ca. 0360-5442. https://doi.org/10.1016/j.energy.2021.121993
- Wang, Q., Yang, A., Wen, F., Li, J. (2013). Risk-based security-constrained economic dispatch in power systems. Journal Modern Power System and Clean Energy, 1(2), 142–149. https://doi.org/10.1007/s40565-013-0019-x
- Waseem Ahmad, M., Reynolds, J., & Rezgui, Y. (2018). Predictive modelling for solar thermal energy systems: A comparison of support vector regression, random forest, extra trees and regression trees. Journal of Cleaner Production, 203, 810–821. 0959-6526. https://doi.org/10.1016/j.jclepro.2018.08.207.
- Waseem Ahmad, M., Mourshed, M., & Rezgui, Y. (2018). Tree-based ensemble methods for predicting PV power generation and their comparison with support vector regression. Energy, 164, 465–474 https://doi.org/10.1016/j.energy.2018.08.207. 0360-5442
- Yang, S., Vaagensmith, B., & Patra, D. (2020). Power Grid Contingency Analysis with Machine Learning: A Brief Survey and Prospects, 2020 Resilience Week (RWS) https://doi.org/10.1109/RWS50334.2020.9241293, pp. 119–125. IEEE.