
 ?Mathematical formulae have been encoded as MathML and are displayed in this HTML version using MathJax in order to improve their display. Uncheck the box to turn MathJax off. This feature requires Javascript. Click on a formula to zoom.
Abstract
This research aims to identify the factors that affect the export of steel products and then prioritize them using the Weighted Aggregated Sum Product Assessment (WASPAS) method. This industry has a crucial role in various countries and the company involved in the case study is one of the three largest steel exporters in Iran. In our study, 56 effective factors have been extracted and classified after a review of the literature in the area of export and marketing, especially the export and marketing of steel products. For identifying the factors affecting the steel products export, the Delphi method was used. This method identified 26 effective factors. In the third part of the study, these effective factors were prioritized using Shannon’s entropy and the WASPAS method in combination. As a result, we have recognized three factors that are the most important to affect the export of steel products: problems and questions of export, transport aspects, and skills/knowledge.
PUBLIC INTEREST STATEMENT
The current study considers the situation in the steel manufacturing industry, which is of high importance in various countries. In the paper, 56 critical success factors (CSFs) related to export and marketing with focus on steel products are identified. These CSFs are evaluated using the Delphi method, which involves expert decision makers from a large steel company in Iran, Khouzestan Steel. As a result, 26 CSFs appear sufficiently relevant and are further prioritized using two mathematical methods for decision support in combination (Shannon’s entropy and the WASPAS method).
Three factors are finally identified as most relevant: skills and knowledge, export problems and issues and transferring the product from the production place to the customer’s place at the right time. Based on these findings, a road map for implementing improvements to increase steel exports is suggested.
1. Introduction
Steel is a world-leading industry, and steel products are a highly traded commodity. The steel industry is presumed as one of the key industries, which serves small and large industries (Mehmanpazir et al., Citation2019). It is often considered that growth in that field reflects economic growth in general and contributes to a country or region’s economic success. Economic growth and steel production growth are linked and affect each other as growth in one area causes an increase in the other. A healthy economy causes industrial activities to increase, and a rising steel demand (Bilal et al., Citation2022; Hasnain et al., Citation2020; Mehmanpazir et al., Citation2019).
Hence, identifying the steel industry’s market situation both outside and inside of a country is very important. In recent years, market changes, shifts in export and import levels, and global steel demand weakness have negatively affected steel industries in some countries.
With the growth in foreign trade, earnings and increasing domestic demand, especially for steel products, the volume of investing in steel production projects rises dramatically. Growth and limitations in production affect the prices of crude steel products. These effects are intensified by the fact that the smelting industry is considered time-consuming, risky, and costly. Hence, the market requires essential government support to grow in line with demand, but surplus to requirements may be achieved through imports (J. Chen et al., Citation2018). In order to understand the effects of financial factors on changes in the costs of nonferrous materials, a theoretical framework was designed by J. Chen et al. (Citation2018). Also, for analyzing nonlinear relationships, a Markov-Switching Vector Auto-Regression (MS-VAR) model is used based on price data from August 2004 to October 2016 of international copper futures (Mehmanpazir et al., Citation2019).
The difference between exports and imports plus domestic demand defines steel production in the country. Based on the retail sales of imported products, and these products’ prices, the amounts of exports and imports are determined. This means that with the growth in the prices of imported products compared with domestic prices, imports decline, and exports grow, and vice versa. Simultaneously, increased tariffs (and other transaction costs) decrease imports.
Steel industries are of key importance in the national economy and society’s well-being in some of the steel manufacturing countries. It is noted that the manufacturing and consumption of steel products is a key indicator to measure and evaluate a country’s economic and industrial performance. Nowadays, some nations (e.g., Iran), which have plenty of natural oil and gas resources, attempt to adopt an alternative economic attitude to use the resources in steel manufacturing instead of exporting raw natural resources. While steel products have a considerable worldwide consumption, export to international markets remains challenging (Gorjian Jolfaei et al., Citation2017).
According to the World Steel Association (WSA), Iran has classified 14th with 17.9 Mt of steel. Comparisons of steel production in Middle Eastern countries found that Iran is presumed to be the largest crude steel producer in this region, with a 65% share in the Middle Eastern region in April 2017 (Worldsteel association, Citation2018). Currently, the export of Iran’s steel products is only marginal. Therefore, marketing in this industry might significantly increase this industry’s importance (Economic Studies Department, Citation2006). Economists believe that marketing factors would effect on competition and presence in global markets. Therefore, using marketing methods is essential for steel products (Gorjian Jolfaei et al., Citation2017; Mirabi & Sarmad, Citation2003; Ottosson & Kindström, Citation2016). Competitive advantages of steel production in Iran and the possibility of international export were further explored in a literature review (Gorjian Jolfaei et al., Citation2017). Most of the budget of Iran directly depends on oil and gas. The strong fluctations in the respective commodity prices, make such a dependency undesirable. Moreover, as these resources are expiring, Iran’s government must search for new industries to replace oil and gas. One of these industries is steel production.
The identification and prioritization of factors affecting the export volume of steel have key roles in these companies. For prioritizing these factors, some methods can be applied. One type of methods is multiple attribute decision-making (MADM) methods. These methods consist of two subcategories: 1 – comparing alternatives; 2 – applying decision matrix. In this research, the Weighted Aggregated Sum Product Assessment (WASPAS) method is used for ranking these factors described by a decision matrix. As the decision matrix’s evaluation requires weights for the different criteria (or factors), an approach is needed to determine them. We implemented the Shannon entropy approach for finding these weights.
This research’s novelty and contribution are that we are first using a combination of WASPAS and the Shannon entropy method for prioritizing these factors. The second contribution is that we use this hybrid approach for the first time in the steel industry to prioritize crucial factors of steel export.
This paper consists of the following parts: After this introduction, Section 2 provides a literature review. Section 3 presents the methodology of Shannon’s entropy and WASPAS in combination. In Section 4, the data analysis results are presented. The final section points out the conclusion and managerial implications.
2. Literature review
2.1. Related work
Worldwide, steel is a highly traded commodity. WSA statistics on 2016 display a total production of more than 1500 million tons for semi-finished and finished steel products (World Steel Association, Citation2016). During the years, the massive volume of steel trades in international markets caused a severe monitoring activity to possible anti-competitive measures. WSA standards focused on strict antitrust principles as resumed by Cerasa and Buscaglia (Citation2017) with respect to typical categories of violations related to prices, capacities, production quantities, geographical or product markets, and customers or classes of customers.
Todshki and Ranjbaraki (Citation2016) focused on investigating macroeconomic variables with effect on the strategic (main) product. In their approach, a long-term co-integration model and Granger causality model are used for economic evaluation. In this research, the relationships of Iran’s macroeconomic variables such as gross national product, global oil price, population and domestic steel production are analyzed concerning their influence on steel export and import.
Wang et al. (Citation2019) applied complex network theory to analyze the trade competition of global nature graphite based on trading data and other internal factors in a single country. The factors influencing competition intensity are analyzed by employing the extended gravity model. It is discovered that the most relevant factors are the country’s GDP, technology and graphite consumption along with the distance to competitor countries.
J. Chen et al. (Citation2018) analyzed the effects of financial factors on fluctuations in nonferrous metal prices based on a Markov-switching vector auto-regression (MS-VAR) model. They conducted their analysis based on monthly data of futures prices from August 2004 to October 2016.
Maksimović et al. (Citation2017) recognized the most critical factors in predicting GDP growth based on six products using the ANFIS model. Results indicate that electricity consumption from renewable sources appears to have the highest impact on GDP growth. In modern economics, all markets in the economy are composed of three significant parts: supply, demand, and prices (that were considered the result of the previous two). It was discovered that demand changes might affect prices with some delay.
Fernandez (Citation2018) employed a division moment approach to estimate prices and income elasticities for seven major metals, including steel. The study focused on eight global geographic regions for the period from 1980 to 2015, and worldwide for the period from 1960 to 2015.
Mehmanpazir et al. (Citation2019) specified steel supply and demand functions to forecast the supply and demand trends by applying multiple logarithmic regression analysis. Logarithmic regression models are a common and useful way to deal with nonlinear relationships between the independent and dependent variables. For the considered model, the dependent variables to be predicted supply and demand, whereas the independent variables that require known values are, for instance, inflation, exchange rates, and supply of raw materials.
By applying dynamic panel data models, Shao et al. (Citation2017) analyzed supply, demand, prices, and openness of crude oil trade, along with various traditional economic, political, and geographical factors for identifying the relevant variables for crude oil imports in emerging markets. From the considered traditional factors, only bilateral trade relationships have been found to influence imports of crude oil from the Asia-Pacific region.
The impact of an increase in per capita foreign direct investment on exports in developing nations is analyzed by Banerjee and Nayak (Citation2017). In their study, two panels of cross-country quality indexes by Hallak and Schott (Citation2011) and Feenstra and Romalis (Citation2014) were used as well as variations of US import prices.
Yang et al. (Citation2017) attempted to promote the sustainable use of graphite resources by investigating the consequences of environmental regulations with respect to China’s graphite export. Based on the gravity model and empirical data of the top 30 import countries during 2005–2014, economical volume and prices, export tax refunds, demographic aspects such as language and population, economic downturns and political conflicts are used as indicators of environmental regulations to study how the corresponding changes affect graphite export values. The results show that the main determinants of export values are the export prices, export tax refunds, and language.
Based on a game model, S. Chen et al. (Citation2017) analyzed relationships between six state-owned companies, independent refineries, domestic and foreign oil product consumers, and domestic and foreign crude oil producers. To work out the detailed impacts, a game-theoretic model was studied. The effects of various quota mechanisms are analyzed, an optimal model is developed for diverse price scenarios, and the most vital factor is considered of quota allocation mechanisms.
Another research studying the price relationships between the EU, China and US for stainless steel markets showed that European stainless steel prices track those of other regions (Giuliodori & Rodriguez, Citation2015; Guo et al., Citation2019). In order to evaluate a steel production enterprise, Pan et al. (Citation2016a) suggested their improved energy-based indicators. Energy is a concept suggested by Odum (Citation1988) that discusses the historical accumulation of all kinds of energy applied in a production process and provides a universal measure for different types of energy flows in a system network.
Based on a cluster analysis and an adaptive neural fuzzy inference system, Liu et al. (Citation2019a, Citation2019b) examined the price impacts in the Chinese import and export steel markets from the perspective of the main international markets and steel products. They assessed the essential factors that are midstream product prices, market supply and demand, and inventory, respectively. This research indicated that the diversity of steel products is essential for analyzing the central participating countries’ steel markets. The global steel market is distributed widely, and the main products traded in each market are also varied.
Sun et al. (Citation2017) assessed the market demand and the mechanism of investment and allocation of capacity in the steel industry. Using quantitative methods, Wen et al. (Citation2019) investigated an energy conservation and emission reduction (ECER) concepts and determined an ECER path for China’s iron and steel industry. First, they used a scenario analysis based on situations where different ECER measures are adopted. Using a quantitative approach they evaluated the ECER effects in each scenario for 2020 and 2025. Secondly, they assessed the ECER potential of different single processes by applying the ECER measures in the steel and iron industry. Moreover, the level of advanced technology application is assessed by using two methods. The results are as follows: For four kinds of ECER measures, the most effective is the limitation of production output, contributing to 6.98% and 12.50% declines in total industrial energy consumption and pollutant emissions in 2020 and 2025. The sintering and iron making processes have strong ECER potential in 2020, while the steel making process has high ECER potential in 2025.
In another research, Hailu and Kipgen (Citation2017) expanded and proposed an index called Extractives Dependence Index (EDI) to check the degree of dependence of a country on oil extraction, gas and minerals for export. The index is on the basis of three indicators: the export income percentage, the commodities revenues percentage, and the GDP value added. Based on EDI, Iran has ranked 55 out of 81 countries under evaluation. It is found that Iran steel industry already has a potential capacity for more research.
The hybrid strategic planning were used by Shahabi et al. (Citation2014) through SWOT analysis and multiple criteria decision-making (MCDM) methods to classify the practical strategic factors in Iran 's steel production by applying the Analytical Hierarchy Process (AHP) and the Analytic Network Process (ANP). The ANP results showed that the dependency among the factors causes major changes in the ranking of alternatives particularly for the main alternatives.
Shahba et al. (Citation2017) used a SWOT analysis with respect to strategies for waste management in Iran’s iron mines. They presented a quantitative basis to analytically specify the ranks of the factors in SWOT analysis through two conventional MCDM methods, AHP and Technique for Order Preference by Similarity to Ideal Solution (TOPSIS).
Azimifard et al. (Citation2018) distinguished the weights of sustainability criteria by applying the AHP and proposed a hybrid decision-making concept to choose sustainable suppliers for Iran’s steel industry along with using the TOPSIS method. By considering the data availability of criteria, the essential criteria for supplier selection of Iran’s steel industry Supply Chain (SC) are CO2 emission, the number of employees working in the supplier industry, the water consumption rate, and distances between the countries.
shows an overview of methods that are used in previous studies in the steel industry. presents an overview of factors affecting exports as discussed in previous studies.
Table 1. Previous studies of methods for steel industry exports
Table 2. Previous studies of factors affecting exports
2.2. Research gap
For studying the effects of import and export costs, methods including dynamic panel data models (Kang et al., Citation2018), the Markov-switching approach (Adler et al., Citation2017), or value-chain analysis (Min & He, Citation2018) are applied. Although all of these methods study price impacts, they usually consider a few countries or regions. Aspects other than prices are frequently neglected. In order to satisfy the requirements of calculating effectively of plenty data with high accuracy, some methods are available so that it is important to select a best suited approach (Liu et al., Citation2019a). Moreover, as trade prices are regularly fluctuating in an irregular way, it is hard for traditional methods to obtain a model for predicting sales volumes based on the price (Liu, et al., Citation2019b). Also, further factors should be considered when analyzing sales volume of steel in the world. In this paper, we used the WASPAS method in combination with Shannon entropy to achieve the aim of this research.
As the literature review shows, companies need to identify factors that affect exports to markets. These factors must be prioritized to help companies understand the respective markets better and allocate their resources accordingly. Some papers have been published about CSFs that effect on export. According to previous studies (cf., ) using MCDM methods both under conditions of certainty and uncertainty. However, there is a lack of using decision-maker input (as in the Delphi method) for prioritizing factors in combination with a hybrid multicriteria evaluation approach based on Shannon entropy and WASPAS as suggested in our study.
3. Multi-criteria decision analysis
MCDM methods can be categorized into soft or hard operations research techniques or statistics methods. Moreover, they can be categorized into methods using pairwise comparisons and methods using a decision matrix. All of these methods have specific advantages and disadvantages (Hanne, Citation2012). Hence, these methods must be applied in the right situation. For further reference to the MCDM methodology, we recommend Bilal et al. (Citation2022) and Hasnain et al. (Citation2020).
The WASPAS method is one of the decision matrix methods that uses weights for computation and is considered one of the most accurate methods among decision matrix approaches (A.K. Yazdi et al., Citation2020, Citation2020; Amir Karbassi Yazdi et al., Citation2021). The SWARA method belongs to the MCDA methods that can calculate the required weights. These weights are mandatory for computing data in the WASPAS method. The method is based on the decision makers’ preferences and one of its most crucial merits is that it requires less computational effort compared with other methods.
3.1. Weighted aggregate sum-product assessment (WASPAS) method
The WASPAS method was introduced by Zavadskas et al. (Citation2012). This method assumes a multicriteria problem with a given decision matrix. The decision matrix can be formulated as in EquationEq. (1)(1)
(1) .
m indicates the number of alternatives, and n is the number of criteria.
With respect to calculating an overall score using weights, two different variants are considered in the WASPAS method: the Weighted Sum Model (WSM) and the Weighted Product Model (WPM). When using these approaches, the decision matrix must be normalized based on EquationEq. (2)(2)
(2) and (Equation3
(3)
(3) ).
For benefit criteria (to be maximized)
For cost criteria (to be minimized)
represents the normalized value of
.
For the calculation of additive optimality scores, WSM is a suitable method. The importance of the ith of alternative is calculated by EquationEq. (4)(4)
(4) .
The value represents the weight of the jth criterion.
For calculating the total score of the ith alternative according to a multiplicative model, WPM, EquationEq. (5)(5)
(5) is used.
Eq. (6) indicates the calculation of a generalized criterion of weighted aggregation on the basis of the additive and the multiplicative method.
In the WASPAS method, for a more accurate calculation of the rankings, Eq. (6) can be replaced by an approach that is based on both models in a weighted form according to Eq. (12).
Based on this equation, an overall rank Q is calculated for all alternatives. The alternative with the highest Q value is the most important one, and the alternative with the smallest value of Q is the least essential (Zavadskas et al., Citation2012).
3.2. Shannon entropy
Shannon entropy is a practical method for MCDM approaches that quantifies uncertainty. It is named after Shannon, although its origin goes back to Pauli and von Neumann (Lotfi & Fallahnejad, Citation2010). This model shows promising results (Yazdani et al., Citation2020). The method steps are as follows:
Step 1. Specify decision-makers (DMs) priorities and set up the decision matrix.
Step 2. Identify which alternatives are benefit criteria (to be maximized) or cost criteria (to be minimized).
Step 3. Normalize the data of the decision matrix.
Step 4. Specify the entropy of each alternative, according to Eq. (8).
with k =
where m indicates the number of alternatives.
For the considered problem, we have
Step 5. Calculate the degree of diversion of each alternative (). For this study, we define
. This diversion degree provides helpful information for decision makers. Coming close to the value of indicators to each other means having less different between competitive factors;
Step 6. Specify the final weights by applying EquationEq. (9)
(9)
(9) .
In the first step of the Shannon entropy method, the decision-making matrix for index j is normalized as follows:
In the next step, the entropy was calculated as follows:
The final step in the Shannon’s entropy method is to calculate the degrees of deviation (variances). The degrees of deviation show how the information value is high.
We illustrate this by an example:
Assume we have three criteria, one of them is cost, and the others are benefit criteria.
Moreover, we have three alternatives. First, the decision matrix is created according to the preferences of DMs (EquationEq. 1(1)
(1) ), see, .
Table 3. Decision matrix
According to EquationEq. (2(2)
(2) –Equation3
(3)
(3) ) the data is normalized. The result is shown in Table .
Table 4. Normalized matrix
The weights of criteria are assumed to be 0.3, 0.5, 0.2. The weighted normalized matrix according to EquationEq. 4(4)
(4) is shown in .
Table 5. Weighted normalized matrix
Then according to EquationEq. 5(5)
(5) –6 the variance matrix is obtained (see, ).
Table 6. Variance matrix
According to EquationEq. 7(7)
(7) , the final ranking results as shown in .
Table 7. Final matrix
4. Research results
4.1. Research methodology
In this research, first, the relevant factors are extracted. Based on the Delphi method, these factors are then customized. Because the WASPAS method is used for ranking factors, and this method is a kind of decision matrix method, criteria weights need to be determined. For this purpose, the Shannon entropy approach is applied. During this research step, 22 top managers of Steel Khouzestan, one of the largest steel companies in Iran, were involved. These were different from the persons involved in the first step of prioritizing factors.
After finding the criteria weights, all factors will be ranked according to the WASPAS method and it is shown which of these factors has the highest priority. demonstrates the procedure of this research.
Figure 1. Research procedure.
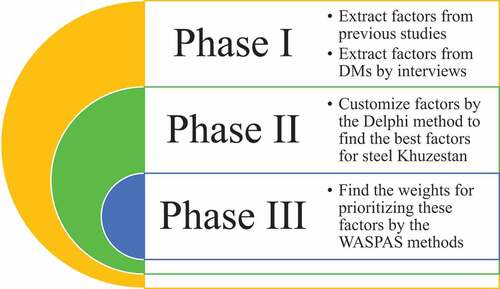
Phase I: Factors related to research subjects are extracted from previous research and interviews with experts
Phase II: The factors are customized for this research by the Delphi method.
Phase III: We need the weights to prioritise these factors by the WASPAS method. These weights are obtained by the Shannon entropy method. Afterwards, the ranking of alternatives is calculated.
For the data analysis discussed in the following subsections, Excel V.2016 was used for the Delphi method and for calculating Shannon entropy. For WASPAS, a specific WASPAS software is used.
4.2. Data collection
The relevant factors should be customized for this research. Hence, after extracting factors from previous studies, interviews with experts are conducted. By doing so, factors are customized using the Delphi method. The Delphi method is used for two aims: making predictions and screening factors. For the screening of factors with the Delphi method, a questionnaire is created which uses a 5-point Likert scale for evaluating the factors. The number of people who should answer questionnaires is debatable. Some researchers believe that the number of DMs should be 100 but others showed that it should be between 5 and 15 persons (Dunham, Citation1998; Powell, Citation2003). Also, due to practicability aspects, we selected seven persons for this research that are highly professional experts in this industry. This increases the reliability of responses and the speed of research while keeping accuracy at a high level. Further information about these DMs is presented in
Table 8. Information about DMs
We have 56 factors that are to be evaluated by these DMs. If the average of DMs preferences for a factor is equal to 4 or higher it will be accepted. If it is lower than 4 it will be rejected. The results are shown below in .
Table 9. Factors affecting the amount of steel exports
4.3. Data analysis using Shannon entropy
After identifying the factors that affect steel products’ export, these factors were prioritized using Shannon’s entropy method and WASPAS. The WASPAS decision-making matrix questionnaire was distributed and the required data were collected.
DMs asserted their preferences from 1 very very low to 9 very very high (9-point Likert scale). The data shown in are calculated according to Eqs 8–Equation10(10)
(10) . This Shannon Entropy information is further used for calculating the weight required by the WASPAS method. shows the diversion degree of each decision-maker.
Table 10. The diversion degree of each decision maker
For the sum of dj values, the following holds:
From this diversion degree information, the weights are calculated according to Step 6 above using EquationEq. 9(9)
(9) . The respective values for
in our study are shown in .
Table 11. for each decision maker
4.4. Data Analysis Using the WASPAS Method
First, the decision matrix has been created based on the DMs preferences () which is normalized subsequently ().
Table 12. Decision matrix
Table 13. Normalized matrix
The variances of data are shown in .
Table 14. Variance matrix
points out the final ranking of all alternatives.
Table 15. Final ranking
4.5. Sensitivity analysis
For sensitivity analysis, first, several methods similar to WASPAS method were determined. These methods are EDAS, MABAC and CoCoSo methods (). Then, data that have been used for computing in WASPAS will be used in these methods. The results are then compared with each other by the Spearman correlation coefficient (). If the significance of result less than 0.05, then there is a correlation between our results and that of the respective method. Otherwise, there is no significant relation. The correlation results of these methods show that our result has correlation with other methods. It means that our results show reliability and accuracy.
Table 16. Sensitivity analysis
Table 17. Correlations among the results of several MADM methods
5. Discussion of results
Today, many companies attempt to increase their revenue. There may be some factors with an impact on revenues. One of the factors is the export of their products abroad. Export problems and issues include the consequences of wrong decisions and lack of attention to the necessary infrastructure in the steel industry and instability in the country’s monetary and financial system. We should consider interconnected activities from the raw materials supply, via various production steps to distribution and sale to the end customers, including various transportation and storage activities along the interconnected supply chains. Economic developments, market requirements, changing environmental conditions, technology developments, consumers’ expectations as end customers, the number and variety of customer service organizations, and many other factors have established a network-based business system. However, some companies fail and waste their money. Hence, finding Critical Success Factors (CSFs) that help companies to export successfully are vital. These CSFs need to be ranked because companies cannot allocate all required but limited resources such as time, budget, human resources, and information to them. This ranking helps to understand which factors have high priority and need to be focused on. As the number of factors, which can affect a company’s exports, is larger and there relevance may be different, it is useful to customize them for the considered region or company. The Delphi method is used for this work. MCDM methods are then applied to prioritize these CSFs. The WASPAS method is one of these methods. To prioritize these CSFs by WASPAS, it needs weights that are obtained by the Shannon entropy method.
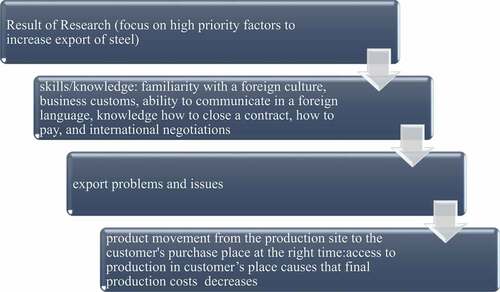
In the first step, 56 factors are identified and then, based on the Delphi method, 26 factors are selected. These factors are then ranked based on Shannon’s entropy and the WASPAS method. Among these factors are the following three most important factors in our study: skills/knowledge, export problems and issues and transferring the product from the production place to the customer’s place of purchase at the right time. Skills/knowledge is the most crucial factor and may help a steel company find foreign customers and increase exports. Skills/knowledge such as familiarity with a foreign culture, business customs, ability to communicate in a foreign language, knowledge of how to close a contract, how to pay, and international negotiations are critical for business success. The Canadian Export Association classifies export skills into 12 groups as follows: export management including planning and control, the export process, project management, international marketing, market research and intelligent market information system, commercial financing, pricing export goods, choosing a partner and how to have a partnership to enter foreign markets, foreign language proficiency including trade language proficiency, business correspondence and business negotiation, familiarity with the culture and customs of export markets, and familiarity with the requirements and international trade rules. The second factor focuses on export problems and issues. As our research on CSFs shows, there are some problems related to steel exports from Iran. Focusing on these and allocating rare resources to them should lead to increases of steel export volumes. The next factor is assumed the product movement from the production site to the customer’s purchase place at the right time. This means that access to production in customer’s place causes that final production costs will drastically decrease and customers can be attracted.
If managers of a steel company look forward to increase export of their products, based on this research we provide a road map for further implementation in . Among these CSFs, the first step focusing on these three factors helps them to increase exports.
Figure 2. The results of several MADM methods.
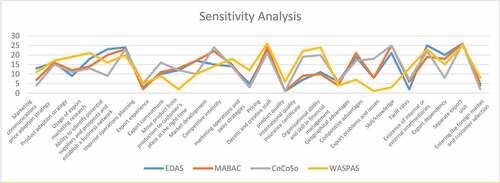
Figure 3. Road map of implementation.
6. Conclusions
6.1. Managerial implications
The Iranian government is aware that oil and gas resources will expire soon. Therefore, they need to find other sources to make money than to sell oil and gas. Iran has potential in various industries, one of them being the steel industry. Foreign countries need steel products in various industries.
The Khouzestan Steel Company, which was involved in our study, is one of the prominent steel manufacturers in Iran. As analyzed in detail, there are several aspects, which affect the export volume and are essential for a successful steel export. Therefore, top managers are trying to find out which CSFs have the highest impact on export volume. For this reason, these factors must be ranked. The result helps managers to allocate rare resources to these factors to increase export volume. The result of this research contradict with Azimifard et al. (Citation2018) who identified distance as the most important factor, whereas this factor has fourth rank in our study. Moreover, the results of Shahba et al. (Citation2017) conflict with our results. In the mentioned research, wasting had the highest priority, but in our study it has only rank 20. Liu et al. (2019) found that market development had the highest priority in their research, but it only has rank 10 in our study.
6.2. Limitations and future research
The research was using data from top managers of a single steel producer (Khouzestan Steel Company) who were quite busy. During the research (e.g., for interviews and answering questionnaires), the access to them proved difficult, and the sample size remained relatively small. Another limitation is the employed methodology. For better considering uncertainties of the decision environment, we will explore using fuzzy sets approaches in subsequent research.
Disclosure statement
No potential conflict of interest was reported by the author(s).
Additional information
Funding
Notes on contributors
Thomas Hanne
Thomas Hanne is Professor for Information Systems at the University of Applied Sciences and Arts Northwestern Switzerland and Head of the Competence Center Systems Engineering since 2012. He is author of more than 180 journal articles, conference papers, and other publications and editor of several journals and special issues. His current research interests include computational intelligence, evolutionary algorithms, metaheuristics, optimization, simulation, multicriteria decision analysis, natural language processing, machine learning, systems engineering, software development, logistics, and supply chain management. Together with Amir Karbassi Yazdi (one of the co-authors of the current paper) and other colleagues, he is frequently analyzing practical decision companies by using approaches from multicriteria decision analysis and/or fuzzy set theory. Typically, these studies focus on a particular industry or company involving decision makers from these fields.
References
- Adler, G., Magud, N. E., Werner, A., Adler, G., Magud, N. E., & Werner, A. (2017). “Terms-of trade cycles and external adjustment”. IMF Working Papers 54. International Monetary Fund.
- Azimifard, A., Moosavirad, S. H., & Ariafar, S. (2018). Selecting sustainable supplier countries for Iran’s steel industry at three levels by using AHP and TOPSIS methods. Resources Policy, 57(1) 30–40. https://doi.org/10.1016/j.resourpol.2018.01.002
- Balmer, J., & Gray, E. (1999). Corporate identity and corporate communications: Creating a competitive advantage. Corporate Communications: An International Journal, 4(4), 171–177. https://doi.org/10.1108/EUM0000000007299
- Banerjee, T., & Nayak, A. (2017). Multinational investments and product sophistication. Economics Letters, 161. https://doi.org/10.1016/j.econlet.2017.08.023
- Barney, J. (1995). Looking inside for competitive advantage. Academy of Management Perspectives, 9(4), 49–61. https://doi.org/10.5465/ame.1995.9512032192
- Bhunia, A., & Uddin Khan, I. (2011). Liquidity management efficiency of Indian steel companies (a case study). Far East Journal of Psychology and Business, 3(3).3–13. https://doi.org/10.9790/487x-1454961
- Bilal, M., Ali, M. K., Qazi, U., Hussain, S., Jahanzaib, M., & Wasim, A. (2022). A multifaceted evaluation of hybrid energy policies: the case of sustainable alternatives in special economic zones of the china Pakistan economic corridor (CPEC). Sustainable Energy Technologies and Assessments, 52, 101958. https://doi.org/10.1016/j.seta.2022.101958
- Bizmpiroulas, A., Rotsios, K., & Kartsiotis, G. (2014). Determinant of export success factors: the perception of Greek food and drink export companies. International Journal of Economics & Business Administration (IJEBA), 2(2), 77–98. https://doi.org/10.35808/ijeba/40
- Blecker, R. A. (2015). markup pricing, import competition, and the decline of the American steel industry. Journal of Post Keynesian Economics,12(1) 70–87. Published. https://doi.org/10.1080/01603477.1989.11489781
- Cerasa, A., & Buscaglia, D. (2017). Do the EU countries import at the same price? the case of coffee. Agricultural Economics, 48(3), 397–408.
- Cerasa, A., & Buscaglia, D. (2019). A hedonic model of import steel prices: Is the EU market integrated? Resources Policy, 61, 241–249. https://doi.org/10.1016/j.resourpol.2019.01.018
- Chen, S., Li, M., Zhang, Q., & Li, H. (2017). Study on the oil import/export quota allocation mechanism in China by using a dynamic game-theoretic model. Energy Procedia, 105, 3856–3861. https://doi.org/10.1016/j.egypro.2017.03.788
- Chen, J., Zhu, X., & Zhong, M. (2018). Nonlinear effects of financial factors on fluctuations in nonferrous metals prices: a Markov-switching var analysis. Resources Policy. Available 8 May 2018, (in press), Corrected Proof.
- CuiChunxiang, C., BaoMin, H., Lichen, Z., & Shuangjin, L. (2011). Titanium alloy production technology, market prospects and industry development. Materials & Design, 32(3), 1684–1691. https://doi.org/10.1016/j.matdes.2010.09.011
- Dewatripont, M. (1988). Commitment through renegotiation-proof contracts with third parties. The Review of Economic Studies, 55(3), 377–390. https://doi.org/10.2307/2297390
- Dhliwayo, S. (2017). Export experience and key success factors in cross-border trade: Evidence from Southern Africa. Acta Commercii, 17(1), 1–9. https://doi.org/10.4102/ac.v17i1.383
- Dunham, R. B. (1998). The DELPHI technique. Organizational Behavior.
- Economic Studies Department (2006). “Investigating of Iran’s Steel Market”. Iranian Mines Development and Renovation Organization, http://www.fooladtechnic.ir/
- Erdoğan, H. H., & Kırbaç, G. (2021). Financial performance measurement of logistics companies based on entropy and waspas methods. Isletme Arastirmalari Dergisi, 13(2), 1093–1106. https://doi.org/10.20491/isarder.2021.1186
- Feenstra, R. C., & Romalis, J. (2014). International prices and endogenous quality. The Quarterly Journal of Economics, 129(2), 477–527.
- Fernandez, V. (2018). Price and income elasticity of demand for mineral commodities. Resources Policy, 59, 160–183. https://doi.org/10.1016/j.resourpol.2018.06.013
- Giuliodori, D., & Rodriguez, A. (2015). Analysis of the stainless steel market in the EU, China and US using co-integration and VECM. Resources Policy, 44, 12–24. https://doi.org/10.1016/j.resourpol.2014.11.006
- Gorjian Jolfaei, N., Haghighi, M., & Gorjian, N. (2017). Marketing mix elements - a case study on steel industry export. Iranian Economic Review, 21(1), 121–136. https://doi.org/10.22059/IER.2017.60866
- Grossman, G. M. (1986). Imports as a cause of injury: The case of the U.S. steel industry. Journal of International Economics, 20(3–4), 201–223. https://doi.org/10.1016/0022-1996(86)90019-X
- Guo, S., Li, H., An, H., Sun, Q., Hao, X., & Liu, Y. (2019). Steel product prices transmission activities in the midstream industrial chain and global markets. Resources Policy, 60, 56–71. https://doi.org/10.1016/j.resourpol.2018.11.014
- Hailu, D., & Kipgen, C. (2017). The extractives dependence index (EDI). Resources Policy, 51, 251–264. https://doi.org/10.1016/j.resourpol.2017.01.004
- Hallak, J. C., & Schott, P. K. (2011). Estimating cross-country differences in product quality. The Quarterly Journal of Economics, 126(1), 417–474.
- Hanne, T. (2012). intelligent strategies for meta multiple criteria decision making. Springer.
- Hasnain, S., Ali, M. K., Akhter, J., Ahmed, B., & Abbas, N. (2020). Selection of an industrial boiler for a soda-ash production plant using analytical hierarchy process and TOPSIS approaches. Case Studies in Thermal Engineering, 19, 100636. https://doi.org/10.1016/j.csite.2020.100636
- Iskanius, P., Haapasalo, H., & Page, T. (2006). Requirements for change in a traditional industry to be competitive: Transformation towards an agile supply chain. International Journal of Agile Systems and Management, 1(3), 258. https://doi.org/10.1504/IJASM.2006.010942
- Johansson, M. T. (2015). Improved energy efficiency within the Swedish steel industry—the importance of energy management and networking. Energy Efficiency, 8(4), 713–744. https://doi.org/10.1007/s12053-014-9317-z
- José, O. M., & Javier, C. H. C. (2014). Export success factors of small- and medium-sized firms in Chile. Journal of Small Business and Enterprise Development, 21(3), 450–469. https://doi.org/10.1108/jsbed0320140053
- Kang, Z. Y., Li, K., & Qu, J. (2018). The path of technological progress for China’s low-carbon development: Evidence from three urban agglomerations. Journal of Cleaner Production, 178, 644–654. https://doi.org/10.1016/j.jclepro.2018.01.027
- Laage-Hellman, J. (2002). Business Networks in Japan. In Supplier-customer interaction in product development. Imprint Routledge. https://doi.org/10.4324/9780203441176
- Liu, Y., Li, H., Guan, J., Feng, S., & Guo, S. (2019a). The impact of Chinese steel product prices based on the midstream industry Chain. Resources Policy, 63, 101415. https://doi.org/10.1016/j.resourpol.2019.101415
- Liu, Y., Li, H., Guan, J., Liu, X., Guan, Q., & Sun, Q. (2019b). The influence of different factors on prices of upstream, middle and downstream products in China’s whole steel industry chain based on adaptive neural fuzzy inference system. Resources Policy, 60, 134–142. https://doi.org/10.1016/j.resourpol.2018.12.009
- Lotfi, F. H., & Fallahnejad, R. (2010). Imprecise Shannon’s entropy and multi attribute decision making. Entropy, 12(1), 53–62. https://doi.org/10.3390/e12010053
- Maksimović, G., Milosavljević, V., Ćirković, B., Milošević, B., Jović, S., & Alizamir, M. (2017). Analyzing of economic growth based on electricity consumption from different sources. Physica A: Statistical Mechanics and Its Applications, 484, 37–40. https://doi.org/10.1016/j.physa.2017.04.174
- McCraw, K., & Reinhardt, F. (2009). Losing to win: U.S. Steel’s pricing, investment decisions, and market share, 1901–1938. Cambridge University Press. https://doi.org/10.1017/S0022050700008779
- McQuiston, D. H. (2004). Successful branding of a commodity product: The case of RAEX LASER steel. Industrial Marketing Management, 33(4), 345–354. https://doi.org/10.1016/j.indmarman.2003.07.001
- Mehmanpazir, F., Khalili-Damghani, K., & Hafezalkotob, A. (2019). Modeling steel supply and demand functions using logarithmic multiple regression analysis (case study: Steel industry in Iran). Resources Policy, 63, 101409. https://doi.org/10.1016/j.resourpol.2019.101409
- Meyer, K. E., Foliano, F., Foliano, F., & Foliano, F. (2008). Export propensity and intensity of subsidiaries in emerging economies. International Business Review, 17(5), 574–586. https://doi.org/10.1016/j.ibusrev.2008.04.002
- Min, D., & He, J. (2018). Linking the past to the future: A reality check on cross-border timber trade from Myanmar (Burma) to China. Forest Policy and Economics, 87, 11–19. https://doi.org/10.1016/j.forpol.2017.11.002
- Mirabi, V., & Sarmad, S. (2003). International Marketing in the Third Millenium. Andishehaye-Gohar-Bar Publication.
- Molina-Morales, F. X., López-Navarro, M. A., & Guia-Julve, J. (2002). The role of local institutions as intermediary agents in the industrial District. European Urban and Regional Studies.
- Nair, A. (2002). Cointegration of firm strategies within groups: A long‐run analysis of firm behavior in the Japanese steel industry. Strategic Management Journal. https://doi.org/10.1002/smj.286
- Nankani, G. T. (1979). Development problems of mineral-exporting Countries. World Bank Washington, DC.
- Navarro-García, A., Arenas-Gaitán, J., Rondán-Cataluña, F. J., & Rey-Moreno, M. Global model of export performance: Moderator role of export department. (2016). Journal of Business Research, 695(5), 1880–1886. JOUR. https://doi.org/10.1016/j.jbusres.2015.10.073
- NBSC (National Bureau of statistics of China). 2017. http://www.stats.gov.cn/
- O’Cass, A., & Julian, C. Examining firm and environmental influences on export marketing mix strategy and export performance of Australian exporters. (2003). European Journal of Marketing, 37(3/4), 366–384. https://doi.org/10.1108/03090560310459005
- Odum, H. T. (1988). Self-organization, transformity, and information. Science, 242(4882), 1132–1139.
- Ohashi, H. (2005). Learning by doing, export subsidies, and industry growth: Japanese steel in the 1950s and 1960s. Journal of International Economics, 66(2), 297–323. https://doi.org/10.1016/j.jinteco.2004.06.008
- Ongun, U., Dagli, İ., & Kösekahyaoglu, L. (2021). Comparison of the pre-pandemic performances of the leading countries in tourism with entropy and waspas methods. Turizm Akademik Dergisi, 8(2), 259–271. https://dergipark.org.tr/tr/pub/touraj/issue/67401/964150
- Ottosson, M., & Kindström, D. (2016). exploring proactive niche market strategies in the steel industry: activities and implications. Industrial Marketing Management, 55, 119–130. https://doi.org/10.1016/j.indmarman.2015.08.003
- Pan, H., Zhang, X., Wang, Y., Qi, Y., Wu, J., Lin, L., Peng, H., Qi, H., Yu, X., & Zhang, Y. (2016a). Energy evaluation of an industrial park in Sichuan Province, China: A modified energy approach and its application. Journal of Cleaner Production, 135, 105–118. https://doi.org/10.1016/j.jclepro.2016.06.102
- Powell, C. (2003). The Delphi technique: Myths and realities. Journal of Advanced Nursing, 41(4), 376–382. https://doi.org/10.1046/j.1365-2648.2003.02537.x
- Robertson, K., & Wood, V. R. (2001). The relative importance of types of information in the foreign market selection process. International Business Review, 10(3), 363–379. https://doi.org/10.1016/S0969-5931(01)00021-X
- Shahabi, S., Basiri, R., Rashidi, M. H., & Kahag, M. (2014). An ANP–SWOT approach for interdependency analysis and prioritizing the Iran's steel scrap industry strategies. Resources Policy, 42, 18–26. https://doi.org/10.1016/j.resourpol.2014.07.001
- Shahabi, S. R., Basiri, M. H., & Kahag, M. R. (2018). Ranking of productivity improvement strategies in Iran mineral sector based on integrated SWOT-FAHP-FTOPSIS analysis. Arabian Journal of Geosciences, 11(3), 1–15.
- Shahba, S., Arjmandi, R., Monavari, M., & Ghodusi, J. (2017). Application of multi-attribute decision-making methods in SWOT analysis of mine waste management (case study: Sirjan’s Golgohar iron mine, Iran). Resources Policy, 51, 67–76. https://doi.org/10.1016/j.resourpol.2016.11.002
- Shao, Y., Qiao, H., & Wang, S. (2017). What determines China’s crude oil importing trade patterns? Empirical evidences from 55 countries between 1992 and 2015. Energy Policy, 109, 854–862. https://doi.org/10.1016/j.enpol.2017.05.063
- Sun, W., Dong, K., & Zhao, T. (2017). Market demand dynamic induced mechanism in China’s steel industry. Resources Policy, 51, 13–21.
- Todshki, N. E., & Ranjbaraki, A. (2016). The impact of major macroeconomic variables on Iran’s steel import and export. Procedia Economics & Finance, 36, 390–398. https://doi.org/10.1016/S2212-5671(16)30051-X
- Wang, X. X., Li, H. J., Yao, H. J., Chen, Z. H., & Guan, Q. (2019). Network feature and influence factors of global nature graphite trade competition. Resources Policy, 60, 153–161. https://doi.org/10.1016/j.resourpol.2018.12.012
- Webb, S. B. (2010). Tariffs, Cartels, Technology, and Growth in the German Steel Industry, 1879 to 1914. The Journal of Economic History, 40 (2), 309–330. Published by Cambridge University Press. 10.1017/s0022050700108228
- Wen, Z., Wang, Y., Li, H., Tao, Y., & De Clercq, D. (2019). Quantitative analysis of the precise energy conservation and emission reduction path in China’s iron and steel industry. Journal of Environmental Management, 246, 717–729. https://doi.org/10.1016/j.jenvman.2019.06.024
- World Steel Association, 2016. Steel Statistical Yearbook. https://www.worldsteel.org/
- Worldsteel association. (2018). Worldsteel in figures. [email protected]
- Yang, Q., Yong, G., Dong, H., Zhang, J., Yu, X., Lu, S., Lu, X., & Chen, Y. (2017). Effect of environmental regulations on China’s graphite export. Journal of Cleaner Production, 161, 327–334. https://doi.org/10.1016/j.jclepro.2017.05.131
- Yazdani, M., Torkayesh, A. E., Santibanez-Gonzalez, E. D. R., & Otaghsara, S. K. (2020). Evaluation of renewable energy resources using integrated Shannon entropy–EDAS model. Sustain Oper Comput. Published. 10.1016/j.susoc.2020.12.002
- Yazdi, A. K., Komijan, A. R., Wanke, P. F., & Sardar, S. (2020). Oil project selection in Iran: A hybrid MADM approach in an uncertain environment. Applied Soft Computing Journal, 88. https://doi.org/10.1016/j.asoc.2020.106066
- Yazdi, A. K., Wanke, P. F., Hanne, T., Abdi, F., & Sarfaraz, A. H. (2021). Supplier selection in the oil & gas industry: A comprehensive approach for multi-criteria decision analysis. Socio-Economic Planning Sciences, 79. 101142. https://doi.org/10.1016/j.seps.2021.101142
- Zavadskas, E. K., Turskis, Z., Antucheviciene, J., & Zakarevicius, A. (2012). Optimization of weighted aggregated sum product assessment. Elektronika Ir Elektrotechnika, 122(6), 3–6. https://doi.org/10.5755/j01.eee.122.6.1810