
 ?Mathematical formulae have been encoded as MathML and are displayed in this HTML version using MathJax in order to improve their display. Uncheck the box to turn MathJax off. This feature requires Javascript. Click on a formula to zoom.
Abstract
Wi-Fi Received Signal Strength (RSS) fingerprinting-based Indoor Positioning System (IPS) is an economical technique due to its implementation from the existing Wi-Fi infrastructure. Nevertheless, it suffers limited positioning accuracy and in recent years, researchers have proposed various approaches to mitigate the problem. Combining different positioning algorithms is a common approach to improve the accuracy which often at the same increase the system algorithm complexity. Meanwhile, combining signals from different wireless technologies for position information is an alternative approach. Recently, Ultra-Wide Band (UWB) stands out among other wireless technologies due to its high positioning accuracy. However, an IPS developed entirely using UWB suffers from high development costs. Thus, this paper has proposed an integration of UWB RSS into Wi-Fi RSS fingerprinting-based IPS to improve the positioning accuracy. Experiments have been conducted in a designated environment equipped with Wi-Fi and UWB anchors. Results show that the positioning accuracy of IPS with the combination of UWB and Wi-Fi is overall better than Wi-Fi-based IPS even there is a reduction of the sampling points of RSS in the indoor environment. On average, the accuracy of IPS with the combination of UWB and Wi-Fi is at least two times more superior than the Wi-Fi-based IPS.
PUBLIC INTEREST STATEMENT
The growth in technology increases the information demand. One high-demand information is indoor location information. However, there is still yet to have an ideal solution for obtaining indoor location information as different Location-Based Services (LBSs) require indoor location information with different levels of accuracy. In addition, Indoor Positioning System (IPS) developed using different wireless technology will have different advantages and disadvantages. Moreover, according to a market survey report, Wi-Fi Received Signal Strength (RSS) fingerprinting-based IPS is the most widely implemented IPS. IPS developed using Wi-Fi benefits from having a great infrastructure but experiencing limited positioning accuracy. Researchers have proposed various approaches to mitigate the issue. A commonly proposed approach is the hybrid of different positioning algorithms. However, this approach will compromise the system algorithm complexity. Thus, an alternative approach to improve the positioning accuracy of Wi-Fi RSS fingerprinting-based IPS is required.
1. Introduction
Location information is vital for different types of Location-Based Services (LBSs Jiang & Yao, Citation2006; Ryschka et al., Citation2016) which can be categorised into indoor and outdoor location information. Global Positioning System (GPS) is commonly used to obtain outdoor location information, but not for the case of indoor location information. One of the main reasons is that the GPS radio signals from satellites for positioning target locations will be attenuated by building structures and obstacles in indoor environments (Özsoy et al., Citation2010). This will lead to the degradation in the accuracy of GPS in indoor environments, especially the underground infrastructures such as basement carparks and underground railway stations. Although the problem of attenuated GPS signals can be mitigated by installing a repeater system, the delay-lock loop architecture of a GPS receiver must be modified (Jardak & Samama, Citation2009; Kurek & Modelski, Citation2006; Lashiley, Citation2009). Due to the limitations of the GPS to work in the indoor environments, some other wireless technologies have gained attention from many researchers to obtain indoor location information for Indoor Positioning System (IPS).
IPS can be developed by using different kinds of technologies such as optical technology (Oh et al., Citation2014; K. K. Wang et al., Citation2017), ultrasound (Medina, Segura, De La Torre et al., Citation2013a, Citation2013b), Inertial Measurement Unit (IMU Bai et al., Citation2020; Poulose et al., Citation2019), and wireless technology (Lv et al., Citation2021). In this paper, the term wireless technology refers to wireless data communication technology. Over the last decade, many wireless technologies have been used for the development of IPS. Examples of the wireless technologies are Bluetooth (Lee et al., Citation2014; Y. Y. Wang et al., Citation2015), Zigbee (Dong et al., Citation2017; Uradzinski et al., Citation2017), Wi-Fi (Hsieh et al., Citation2019; Rashid et al., Citation2016), and Ultra-Wide Band (UWB Hong et al., Citation2019; Wei et al., Citation2018).
According to the market survey report (Bourne & IndoorAtlas, Citation2016), Wi-Fi is the most popular wireless technology used for developing IPS. It has several advantages that make it a popular wireless technology chosen for developing IPS, and, among those advantages, ubiquitous is the major advantage. IPS developed using Wi-Fi may utilise existing Wi-Fi infrastructure, and therefore benefits developers from low development cost resulting in Wi-Fi-based IPS becomes an economical solution. However, Wi-Fi-based IPS have disadvantages as well. The major disadvantage of Wi-Fi-based IPS is the issue with its accuracy. According to Tan et al. (Citation2021), Wi-Fi-based IPS typically has an average positioning error ranging from 2 m to 3 m.
IPS developed with Wi-Fi commonly uses fingerprinting positioning technique with Received Signal Strength (RSS) as signal property extracted for positioning purposes. Researchers have proposed different approaches to improve the positioning accuracy of Wi-Fi RSS fingerprinting-based IPS. Methods proposed include combination of different positioning algorithms, integration of different wireless technologies, etc. An example of IPS that achieved good positioning accuracy by combining different positioning algorithms is presented by Rahman et al. (Citation2020). The authors presented the performance of an IPS that integrates k-Nearest Neighbours (k-NN) with Feed-Forward Neural Network (FNN). The performance is then compared with the performance of an IPS developed using only k-NN or FNN. IPS developed with both k-NN and FNN gives the positioning accuracy with a median positioning error of 1.929 m. This median positioning error is 1.254 m and 7.689 m smaller or better than the median positioning error presented by IPS that is individually developed with k-NN or FNN, respectively. Combination of different positioning algorithms has proven to have improved the positioning accuracy of IPS.
Integration of different wireless technologies in IPS is another approach to improve positioning accuracy. For instance, Subedi et al. (Citation2020) had conducted a study on the positioning performance of IPS developed using Wi-Fi RSS, Bluetooth RSS and the combination of both. The study shows that the IPS developed with the combination of Wi-Fi RSS and Bluetooth RSS can achieve the smallest median positioning error, compared to the one without combination of different wireless technologies. Besides, Luo and Hsiao (Citation2019) presented another positioning system that were also developed with the combination of Wi-Fi and Bluetooth RSS. In addition, various positioning algorithms have been used to study the performance of IPS developed using pure Wi-Fi, pure Bluetooth and the hybrid of Wi-Fi and Bluetooth. The result shows that the positioning system developed using Hierarchical Topological Fingerprinting (HTF) with Wi-Fi and Bluetooth RSS gives the most accurate position estimation. Bluetooth and Wi-Fi both work on a 2.4 GHz frequency.
In this paper, UWB wireless technology that works at a higher frequency band is proposed to be integrated with Wi-Fi technology to improve the position accuracy of Wi-Fi-based IPS. According to a market survey (MarketsandMarkets., Citation2020), there are several advantages of UWB as compared to other wireless technologies. Unlike conventional wireless technologies that communicate on a specific radio frequency, UWB can communicate over a wide range of frequency bands, ranging from 3.1 GHz to 10.6 GHz. Thus, high-speed data rate communication can be done over the wide range of frequency bands. In addition, UWB signals can have higher penetration capability over obstacles (such as cabinets, walls, etc.) than conventional signals with UWB pulses in low frequency. As in the current technology of UWB, the maximum range of signal coverage is usually up to 50 m (Schneider & Feussner, Citation2017). Besides, UWB signal can be transmitted in a very short duration. This gives the benefit that it is convenient to identify which UWB signal is the correct signal to be extracted and which signal is reflected signal or diffracted signal to be filtered away. Moreover, UWB signals can be transmitted in low-power spectral density, which benefits it in lesser power consumption than the conventional system. Furthermore, UWB will cause or experience less interference when using near other radio signals. Thus, UWB signals are less susceptible to the multipath effect. This implies that it has a good straightforward distinguishability of direct multipath components without the need to implement complex estimation algorithms. The advantages discussed earlier have made UWB a suitable wireless technology for developing IPS with high performance, especially in developing IPS with low positioning errors. However, UWB is costly and is not supported by good infrastructure. This will result in a high development cost if an IPS is developed entirely using UWB.
Time of Arrival (TOA), Time Difference of Arrival (TDOA) and RSS are techniques commonly used to develop UWB-based IPS. Among these three techniques, TOA and TDOA are popularly used for UWB-based IPS as these two techniques promise high accuracy up to centimeter-level. However, different indoor LBSs require IPS with different degrees of accuracy. Implementing an IPS with centimeter-level accuracy is not essential for many potential services (Ingram et al., Citation2004), such as indoor employee tracking, item and goods tracking, navigation for pedestrians, and many more. Besides, UWB-based IPS developed using TOA and TDOA has several limitations, such as sampling rate decreases when the number of targets increases and requiring clock synchronisation between devices, resulting the increase in system complexity. Although RSS is generally less accurate than TOA and TDOA, it has benefits such as having simple system implementation, low energy consumption, and not requiring clock synchronisation (Tan et al., Citation2021).
In short, an IPS that is developed entirely using Wi-Fi can give the benefit of low development cost by utilising existing Wi-Fi infrastructure. However, Wi-Fi-based IPS is suffering from poor accuracy. On the other hand, an IPS that developed entirely using UWB can provide high accuracy, but the development cost is expensive. Thus, this paper proposes the integration of UWB RSS to Wi-Fi RSS-based IPS to construct a hybrid wireless technology (Wi-Fi and UWB) RSS fingerprinting-based IPS in low complexity. The developed IPS will be able to utilise the existing Wi-Fi infrastructure and the positioning accuracy is expected to improve with the integration of UWB. Low complexity in the context of RSS is a parameter that can be easily extracted from both wireless technologies. Even though both wireless technologies have the same parameter extracted for positioning, UWB belongs to a wideband signal, whereas Wi-Fi is a narrowband signal. In contrast to narrowband signals, the RSS of the wideband signal shows little small scale fading (Romme & Kull, Citation2003). Therefore, UWB RSS is expected to improve the positioning accuracy of Wi-Fi RSS-based IPS. The novel contribution of this paper is to present the plausibility of improving positioning accuracy of Wi-Fi RSS-based IPS with the integration of UWB RSS.
Different indoor LBSs require IPS with different levels of accuracy. To explain further, consider a Wi-Fi RSS-based IPS is implemented in a shopping center to provide indoor navigation service. After evaluating the performance of the Wi-Fi RSS-based IPS, the positioning error of the Wi-Fi RSS-based IPS is larger in certain areas. In that case, some UWB anchors can be installed at those areas to provide UWB RSS information to minimize the positioning error. The performance of integrating additional UWB anchors into existing Wi-Fi RSS-based IPS will be studied from two perspectives: integrating UWB anchors by replacing existing Wi-Fi anchors and integrating UWB anchors by adding them into existing Wi-Fi-based IPS.
The rest of this paper is divided into three sections. The next section presents the methodology involved in conducting studies to examine the performance of the proposed approach, which is the positioning performance of Wi-Fi RSS-based IPS with the integration of UWB RSS. The paper also discusses the results obtained for each study conducted. Finally, the last section presents the conclusion and future work of the paper.
2. Methodology
In this paper, the developed IPS systems are Wi-Fi-based IPS (used to benchmark the proposed approach), UWB-based IPS, and Wi-Fi-based IPS with the integration of UWB. IPS developed are using fingerprinting positioning technique, with RSS as positioning parameter and neural network as the positioning algorithm. The selected study environment consists of Wi-Fi anchors and UWB anchors. Since fingerprinting positioning technique is used, the methodology section starts with the working principle of fingerprinting positioning technique. Next, the structure of a selected study environment is presented with a floor plan, and the hardware components used in this study are described. After that, the data acquisition process is elaborated. Finally, the experiment procedures used to study the performance of the combinations of UWB RSS and Wi-Fi RSS-based IPS are explained. The procedures used to study the performance impact of different spacing between data acquisition points will be presented.
2.1. Fingerprinting positioning technique
Fingerprinting positioning technique is a flexible positioning technique since it can work with different positioning parameters (Hsieh et al., Citation2019) and positioning algorithms (Adege et al., Citation2018; Nastac et al., Citation2017). The processes of fingerprinting positioning techniques can be categorised into two phases: an offline phase and an online phase, as shown in Figure .
Figure 1. Block diagram of fingerprinting positioning technique.
During the offline phase, data acquisition is performed to construct a fingerprint database. A fingerprint database is a collection of fingerprints, whereas a fingerprint is a vector that consists of two pieces of information: location tag and environmental reading. Location tag is a pre-defined address for each location (reference point). Environmental reading is a collection of positioning parameters such as RSS, TOA, etc. Once data acquisition has been completed for every location in the study environment, a fingerprint database is constructed. A positioning algorithm will then use the constructed fingerprint database to estimate the target position during the online phase. The online phase is also known as the testing phase. In the online phase, the positioning algorithm is inputted with environmental reading captured at an unknown location. The positioning algorithm will then output an estimated location based on the previously inputted environmental reading. When a neural network is adopted as the positioning algorithm, the neural network will be required to be trained in advance before it can perform in the online phase.
In general, neural network can be used in different applications with different structures that result in different performances. However, the process to figure out the hyperparameters of a high-performing neural network is a highly iterative process. Even a person who is very experienced in neural networks will find it almost impossible to guess the best choice of the hyperparameters in the first guess. Repeating the training and validation cycle is required to identify the hyperparameters of a high performing neural network. Hyperparameters are parameters that define the structure of a neural network (neural network architecture), such as the number of neurons, type of activation function, type of optimiser, etc.
2.2. Environment layout
This subsection presents the selected study environment for carrying out the study on the proposed approach. The selected study environment is an enclosed classroom with a floor tiled in grid patterns. A floor plan that illustrates the selected study environment is shown in Figure . A 2D coordinate system is implemented to define every location of the study environment. There is a total of 27 tiles in the x-direction and 44 tiles in the y-direction. Each tile has a dimension of 0.3 m × 0.3 m. Data acquisition will be conducted by following the grout lines/joints form between tiles. Thus, the x-coordinate will range from 0 to 25, and the y-coordinate will range from 0 to 42.
Figure 2. Study environment layout.
According to (Figure )) Wireless Local Area Network (WLAN) and a server was set up in the study environment. The WLAN functions as a platform establishing Wi-Fi communication between devices. The server provides two services: (1) fingerprint database service to store all fingerprints generated during the data acquisition process and (2) venue service to provide a survey path. The survey path was stored in a file consisting of a series of commands that define the path to carry out data acquisition. The survey path was prepared in advance to cover all coordinates, except coordinates set up with wireless anchors. Furthermore, a total of six Wi-Fi anchors and six UWB anchors were set up separately in the study environment. Three Wi-Fi and three UWB anchors were set up in the study environment (Line of Sight (LOS) with tag node). Also, three Wi-Fi and three UWB anchors were set up outside the study environment (Non-Line of Sight (NLOS) with tag node). The anchors were arranged to have the actual situation, so that the RSS extracted with tag node would consist of RSS from wireless anchors in both LOS and NLOS.
2.3. Hardware components
Each Wi-Fi anchor is a NodeMCU module programmed to function in access point mode. Meanwhile, each UWB anchor and the UWB tag is a UWB module developed with DWM1000 chip that is configured with firmware to work as anchor and tag, respectively. Figure shows the image of the UWB module.
Figure 3. UWB module.
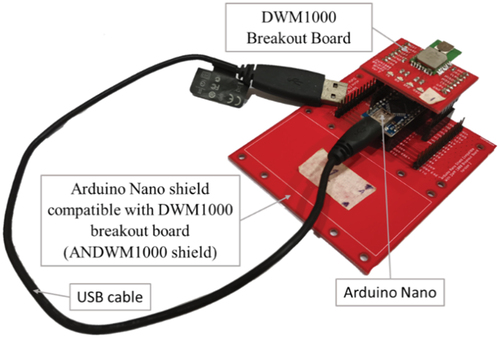
Every developed UWB module comprises of three different boards: a DWM1000 breakout board, an Arduino Nano, and an Arduino Nano shield compatible with the DWM1000 breakout board (ANDWM1000 shield). The purpose of the DWM1000 breakout board is like its name, breaking out the pins of the DWM1000 chip to make its pins to be easier to be accessed, as the DWM1000 chip manufactured by Decawave company is a Surface Mounted Device (SMD). Next, the Arduino Nano serves as the microcontroller. Due to the logic level difference of Arduino Nano and DWM1000, the ANDWM1000 shield had been developed with logic shifters to establish the communication between the Arduino Nano and DWM1000. Moreover, the UWB module that was configured as a UWB tag, was equipped with a Bluetooth module to establish connection with a smartphone for data collection. Since RSS fingerprinting positioning technique is adopted, data acquisition in the selected study environment is required to construct a fingerprint database. Data acquisition was conducted automatically using a mobile robot, carrying the UWB tag. The smartphone was pre-installed with an automatic data acquisition application (A. M. S et al., Citation2022).
2.4. Automatic data acquisition process
Automatic data acquisition process starts by executing the pre-installed automatic data acquisition application in the smartphone. The application begins by establishing Bluetooth serial communication with UWB tag, and Wi-Fi communication with the mobile robot and the server. Next, the current coordinate of the smartphone and the number of times to perform data acquisition (10 times for this study) on each coordinate is inputted to the application. Once these two pieces of information have been inputted, the application will start executing the automatic data acquisition algorithm. The process of automatic data acquisition is presented using a flow chart, as shown in Figure .
Figure 4. Flow chart for automatic data acquisition process.
The smartphone application will start by downloading the survey path from the server. After that, data acquisition will be conducted. Data acquisition starts with the smartphone application using its smartphone built-in Wi-Fi chip to measure Wi-Fi RSS values from each Wi-Fi anchor set up in the study environment. Besides, the smartphone application will also send a command to trigger the connected UWB tag to scan for the surrounding UWB RSS values and return the series of RSS values to the smartphone through Bluetooth serial communication. Next, the smartphone application will use the current coordinate and the collected environmental reading (Wi-Fi RSS values and UWB RSS values) to form a fingerprint and submit the fingerprint to the fingerprint database. On each coordinate, data acquisition will be conducted for ten times. After data acquisition is completed, the survey path will be indexed by using the current coordinate to read the motion command to be executed at the current coordinate. The example motion commands are forward, backward, leftward, or rightward. The command will be executed by requesting the mobile robot to navigate in the direction of motion command, following the surface grout formed by tiled floor to reach the next coordinate location. Once the mobile robot reaches the following coordinate, the current coordinate value will be updated based on the previously executed command. Then, the process will be looped back to conduct data acquisition for ten times. This process will be terminated only when the end of path command is indexed. More information regarding the automatic data acquisition process is presented in a paper written by A. M. S et al. (Citation2022). As mentioned before, the predefined survey path covers all coordinates except the coordinates that have the wireless anchors. After completing the automatic data acquisition process, the fingerprint database consists of a total of 11150 fingerprints. Each fingerprint consists of 14 elements, as illustrated in Figure . The first two elements are the x-coordinate and y-coordinate, together known as a location tag. The remaining columns are RSS values extracted from the six Wi-Fi anchors and the six UWB anchors, together known as environmental reading.
Figure 5. Overall fingerprint database layout.
2.5. Experiment procedure
After obtaining a fingerprint database, two experiments were conducted. The first experiment involved the study of the positioning performance of hybrid wireless technology (Wi-Fi and UWB) RSS fingerprinting-based IPS using neural network. In the following of the paper, the study of the positioning performance of hybrid wireless technology RSS fingerprinting-based IPS is also referring to the study of the positioning performance of Wi-Fi RSS fingerprinting-based IPS with the integration of UWB RSS. The second experiment investigated the impact of spacing between data acquisition points towards the accuracy performance of IPS. In order to conduct these two experiments, the 11150 fingerprints were downloaded from the fingerprint database server.
The first experiment started by separating the 11150 fingerprints into a training set and a validation set with a ratio of 9:1. Since ten samples were collected at each coordinate, nine samples were randomly selected and kept in the training set. The remaining one sample was kept in the validation set. Thus, the training set consists of 10035 fingerprints, and the validation set consists of 1115 fingerprints. Once the training set and validation set had been created, the next step involved identifying the hyperparameters of a high-performance neural network. Grid search (Zheng, Citation2015) and fine-tuning process were conducted to obtain the hyperparameter of high-performing neural network architecture. The resulting high performing neural network architecture is summarised in Table .
Table 1. Resulting neural network architecture
Standard normalisation technique was implemented as it could help the training of neural network to reach convergence faster. However, the standard normalisation technique can result in the output with a zero-mean and a standard deviation of one. This means that the output values can have negative values. Thus, the hyperbolic tangent activation function was used in the hidden layer as it considers negative value inputs, and the output is zero centric. Besides, a linear activation function was used for the neurons in the output layer because a regression neural network is expected instead of a classification neural network. Two output neurons were used for 2D positioning. The diagram of the resulting high performing neural network architecture is illustrated, as shown in Figure . The neural network models created for all experiments in this paper are based on the obtained neural network architecture, to exclude neural network architecture as a factor that affects positioning performance. However, the number of input neurons on the input layer vary depending on the number of Wi-Fi RSS and UWB RSS selected as the environmental reading of fingerprints.
Figure 6. Diagram of resulting neural network architecture.
In order to carry out the study on the performance of hybrid wireless technology, benchmark performance is required. In this study, the benchmark performance is the positioning performance of Wi-Fi RSS fingerprinting-based IPS using neural network. Thus, the same neural network architecture was used to develop neural network models that were to be trained and validated using fingerprints formed by RSS from different types and numbers of wireless anchors. The fingerprints were formed by using RSS extracted from Wi-Fi anchors only, UWB anchors only, and the hybrid of both. Fingerprints formed by RSS from different wireless anchors can represent different wireless setups. In the neural network model training stage, early stopping regularisation technique (Sitaula & Ghimire, Citation2017) was used to prevent the neural network from overfitting. Table shows the list of fingerprint patterns used in the first experiment. For instance, when the type of wireless technology is Wi-Fi and the number of RSS is 6C3, this means that each fingerprint is formed by RSS obtained from three different Wi-Fi anchors. Since a total of six Wi-Fi anchors had been set up, the total number of possible combinations of fingerprint patterns formed by Wi-Fi RSS from three Wi-Fi anchors out of six Wi-Fi anchors would be 20. Thus, 20 neural network models with the same architecture can be created, trained and validated with 20 different types of fingerprint patterns formed by RSS from three Wi-Fi anchors out of a total of six Wi-Fi anchors. The total number of combinations without repetition can be calculated using the equation as shown in (1), where is the total number of anchors for a specific wireless technology with RSS being extracted, and
is the number of different anchors selected out of
.
Table 2. Fingerprint patterns to be studied
However, when the fingerprint is formed by hybrid wireless technology, the total number of combinations will be the product of the total number of combinations of each wireless technology. For instance, when the type of wireless technology is hybrid (replacement) and the number of RSS is “Wi-Fi 6C5 + UWB 6C1”, this means that the fingerprints will be formed by six positioning parameters, which are RSS from five different Wi-Fi anchors and RSS from one UWB anchors. The total number of possible combinations will be 6C5 multiplied by 6C1, which will be equal to 36, as shown in Figure . The study conducted on hybrid wireless technology were done by two different approaches, in which the fingerprint formed by RSS from six Wi-Fi anchors were progressively replaced by UWB anchors (replacement) or progressively added with UWB anchors (insertion). This was to study the performance differences, when UWB anchors were integrated into a Wi-Fi-based IPS by replacing existing Wi-Fi anchors or adding and working together with existing Wi-Fi anchors. The results are presented in the following section, for the neural network models trained and validated with all the combinations of different patterns of fingerprints.
Figure 7. Diagram presenting possible combinations for Wi-Fi 6C5 + UWB 6C1.
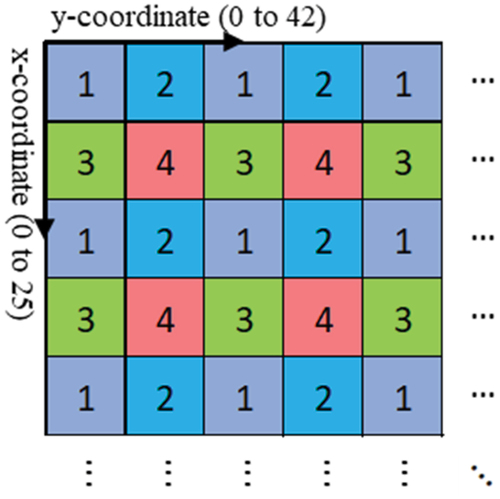
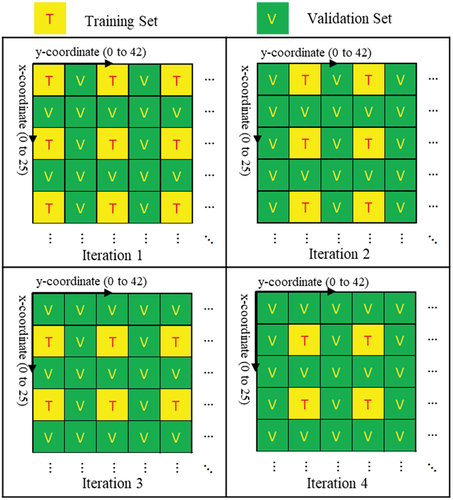
In the second experiment, three fingerprint patterns were used: fingerprint formed by RSS from all Wi-Fi anchors, all UWB anchors or all Wi-Fi and UWB anchors. The experiment aimed to study the impact of spacing on positioning performance of Wi-Fi, UWB and hybrid (insertion) based IPS, respectively. Each of the wireless technology-based IPS has different positioning accuracy. The impact of spacing size on these IPS were analysed. The procedure to conduct the second experiment is similar to the first experiment, except for the method used to separate the 11150 fingerprints into a training set and a validation set. The minimum spacing between data acquisition points to be studied is 0.3 m as data acquisition is conducted by following the grout lines/joints formed by the tiled floor. Each tile has a dimension of 0.3 m × 0.3 m. Thus, the performance results with the 0.3 m spacing could be referred from the first experiment, when neural network models were created, trained and validated using fingerprints formed by RSS from specific wireless anchors. Besides, the second experiment also included the study of the performance, when the spacing between data acquisition points is 0.6 m, 0.9 m, 1.2 m, and 1.5 m. While conducting the study for different spacing size, the 11150 fingerprints were separated into a different number of sets by skipping one, two, three, and four coordinates in both x and y directions respectively. For instance, when studying for the spacing size of 0.6 m, 11150 fingerprints were separated into four sets based on coordinate, as shown in Figure .
Figure 8. Method used to separate 11150 fingerprints into four sets based on coordinate while studying for the spacing size of 0.6 m.
Each set took turns to act as the training set, whereas the remaining sets were used as the validation set, as shown in Figure . For instance, during iteration 1, set 1 can be used as the training set, and the others can be used as the validation set. Since there are four sets, there is a total of four iterations. The validation results of each iteration are discussed in the following section. The same method of separating the 11150 fingerprints were applied while conducting the study for the spacing size of 0.9 m, 1.2 m, and 1.5 m, in which the fingerprints were separated into 9 sets, 16 sets and 25 sets, respectively.
Figure 9. Set selected to act as the training and validation sets while studying for the spacing size of 0.6 m.
3. Results and discussions
This section contains the summarized result for all experiments conducted. Throughout all experiments, each positioning error is computed using the equation as shown in (2), which is a Euclidean distance equation, where and
are the predicted coordinate and actual coordinate, respectively. The factor 0.3 is included in the equation to convert the error computation to the meter unit as each tile has a dimension of 0.3 m × 0.3 m.
Furthermore, median is used to measure the positioning performance of each fingerprint pattern and spacing size. For the Euclidean distance errors , let
represent the smallest Euclidean distance error,
the second smallest Euclidean distance error, and
the largest Euclidean distance error. In general, mathematic notation shown in (3) can be used to indicate
Euclidean distance errors arranged in ascending order.
The median Euclidean distance error, is calculated as follows:
Suppose the number of Euclidean distance errors,
, is odd, compute
Suppose the number of Euclidean distance errors,
The remaining parts of this section is divided into three subsections. First and foremost, the positioning performance of neural network models developed using the same architecture but trained and validated using fingerprints formed by RSS from different wireless anchors will be discussed. The positioning performance with the use of fingerprints formed by RSS from a different number of Wi-Fi anchors only and UWB anchors only, will be presented in the first subsection. The trend of median errors with different number of anchors will be discussed. Next, the second subsection presents the performance with the use of fingerprints formed by RSS from hybrid wireless technology. A comparison between the performance of adding UWB anchors against replacing Wi-Fi anchors with UWB anchors will be discussed. Finally, the impact of spacing towards the positioning accuracy of IPS with different accuracy is discussed in the last subsection.
3.1. Positioning performance of neural network models using fingerprints formed by a different number of RSS from single wireless technology
The performance of neural network models trained and validated using fingerprints formed by RSS from a different number of Wi-Fi anchors is presented using cumulative distribution function (CDF), as shown in (Figure ). Each CDF line is plotted using all the validation results of the specific fingerprint pattern. When the number of Wi-Fi anchors increases, the positioning accuracy increases as the CDF graph achieves higher cumulative probability in smaller Euclidean distance error. The obtained finding is consistent with the result presented in (A. K. A. K. Abed & Abdel-Qader, Citation2018), in which the reduction in the number of wireless anchors results in higher positioning error. However, based on Figure , even with the use of fingerprints formed by RSS from the greatest number of Wi-Fi anchors, the percentage of the predictions made with Euclidean distance error below 2 m is just 40.54%.
Figure 10. Positioning performance for fingerprints formed by RSS from different numbers of anchors.
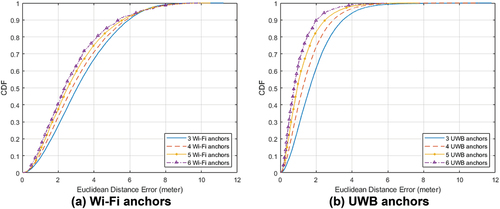
Furthermore, the performance of neural network models trained and validated using fingerprints formed by RSS from a different number of UWB anchors is shown in (Figure )). (Figure )) is similar to (Figure )), but with different rate of change. By using fingerprints formed by RSS from UWB anchors, the positioning error has a more significant decrement when the number of UWB anchors increases. When the neural network model is trained and validated with fingerprints formed by RSS from the greatest number of UWB anchors, the percentage of predictions made with Euclidean distance error lower than 2 m reaches 89.87%.
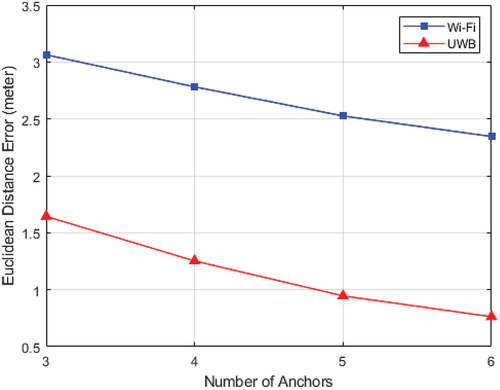
Next, the median positioning error for fingerprints formed by RSS from different numbers of Wi-Fi anchors or UWB anchors is shown in Figure . Figure shows that regardless of forming fingerprints by RSS from Wi-Fi anchors or UWB anchors, the result obtained still presents a smaller median positioning error when the number of anchors increases. However, the minimum median positioning error for fingerprints formed by RSS from Wi-Fi anchors only is higher than those from UWB anchors only. The minimum median positioning error for fingerprints formed by RSS from Wi-Fi anchors only is 2.346 m. Whereas, the minimum median positioning error for fingerprints formed by RSS from UWB anchors only is 0.763 m.
Figure 11. Trend of median positioning error for fingerprints formed by RSS from different numbers and types of wireless anchors.
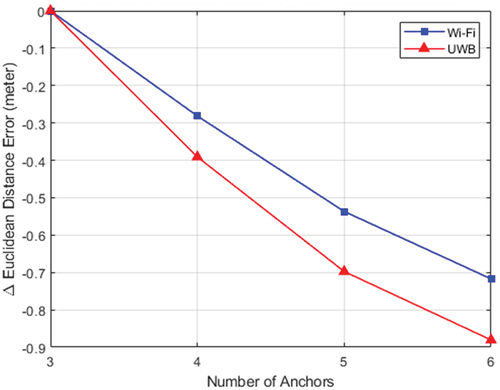
Lastly, the change in median positioning error for neural network models trained and validated using fingerprints with different numbers of Wi-Fi anchors or UWB anchors is shown in Figure . It is plotted by using (4), where is referred to the number of anchors range from 3 to 6. εn is denoted as the median of Euclidean distance error while fingerprints used is formed by RSS from
number of wireless anchors.
is denoted as the change in median Euclidean distance error with respect to the maximum median Euclidean distance error. Based on the line graph shown in Figure , the change in median Euclidean distance error with the increase of the number of UWB anchors is more significant than the one with the increase of the number of Wi-Fi anchors. The graph also shows that the change in median positioning error will decrease when the number of anchors increases.
Figure 12. Delta median positioning error for fingerprints formed by RSS from different numbers of Wi-Fi anchors or UWB anchors.
3.2. Positioning performance of neural network models using fingerprints formed by RSS from hybrid wireless technology (replacement and insertion)
This subsection presents the positioning performance of neural network models trained and validated with fingerprints formed by RSS from hybrid wireless technology with the methods of replacement and insertion. Firstly, (Figure )) shows the positioning performance illustrated in CDF for fingerprints formed by hybrid wireless technology, with six Wi-Fi anchors initially and progressively replaced by UWB anchors. When the Wi-Fi anchors are progressively replaced one by one with UWB anchors, the positioning error gradually decreases. This indicates that replacing UWB anchors in Wi-Fi RSS-based IPS can provide better positioning accuracy. For instance, when using fingerprints formed by RSS from Wi-Fi RSS-based IPS with one Wi-Fi anchor being replaced with one UWB anchor, the percentage of predictions made with Euclidean distance error lower than 2 m achieves 52.39%. It is 11.85% higher than the performance for fingerprints formed by RSS from the maximum number of Wi-Fi anchors.
Figure 13. Positioning performance for fingerprints formed by RSS from hybrid wireless technology.
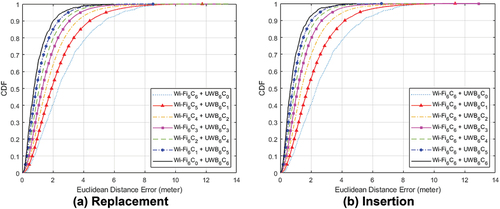
Furthermore, the positioning performance for fingerprints formed by RSS from hybrid wireless technology with the insertion approach is illustrated in Figure . When the number of UWB anchors increases, the positioning performance will increase. For instance, when fingerprints are formed by RSS from one UWB anchor and RSS from six Wi-Fi anchors, the percentage of the prediction made with Euclidean distance error lower than 2 m achieves 55.65%. It is 3.26% better than the result for fingerprints when one Wi-Fi anchor replaced with one UWB anchor. Also, it is 15.11% better than the best performance for the fingerprints formed by RSS from Wi-Fi anchors. Besides, with the use of fingerprints formed by RSS from the maximum number of Wi-Fi anchors and UWB anchors set up for this study, the positioning performance has surpassed the performance for fingerprints formed by RSS from single wireless technology. The percentage of the prediction made with Euclidean distance error lower than 2 m has reached 92.74%.
Next, the median positioning error trend against number of UWB anchors for fingerprints formed by RSS from hybrid wireless technology in both the replacement approach and insertion approach is illustrated in Figure . It can be clearly observed that the overall performance for the insertion approach is better than the overall performance for the replacement approach. Furthermore, the insertion method for the fingerprints formed by combining RSS from six Wi-Fi anchors and six UWB anchors, achieves the lowest median positioning error of 0.665 m. The median positioning error is 0.098 m smaller than the one obtained with the fingerprints formed by RSS from the maximum number of UWB anchors. The median positioning error is also 1.681 m smaller than the one obtained with the fingerprints formed by RSS from the maximum number of Wi-Fi anchors. This finding shows that integrating UWB RSS into Wi-Fi RSS fingerprinting-based IPS through insertion approach can achieve positioning accuracy higher than single wireless technology based IPS, especially in improving the positioning accuracy of Wi-Fi RSS fingerprinting-based IPS.
Figure 14. Trend of median positioning error for fingerprints formed by RSS from hybrid wireless technology (replacement and insertion).
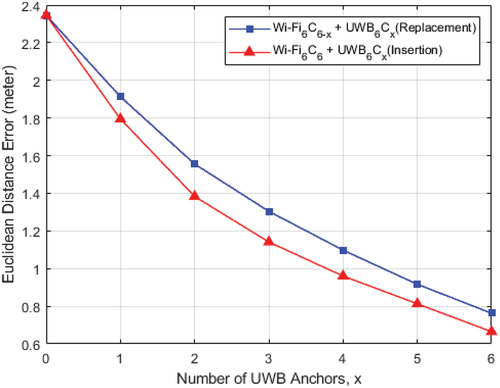
The performance of each fingerprint pattern studied in the first experiment can be summarised and tabulated in Table . According to Table , the reduction in median Euclidean distance error decreases with the increase in the number of wireless anchors of the same type. Rather than keeping on increasing the number of Wi-Fi anchors, integrating UWB anchors into the environment can significantly reduce the median Euclidean distance error, especially with insertion approach. Although the replacement approach shows that the performance does not suppress the performance of UWB RSS-based IPS, the results still show that the replacement approach can significantly help to improve the positioning accuracy of Wi-Fi RSS-based IPS. For Wi-Fi-based IPS, when the number of Wi-Fi RSS is increased from five to six, the median Euclidean distance error is only reduced by 0.180 m. This means that continue adding a Wi-Fi anchor will not be able to provide a reduction in median Euclidean distance error for more than 0.180 m. When either one of the six Wi-Fi anchors is replaced with a UWB anchor, a significant decrease in median positioning error with a magnitude of 0.433 m can be observed.
Table 3. Summarised performance of each fingerprint pattern
3.3. Impact of spacing size between data acquisition points on positioning Performance of IPS with different accuracy
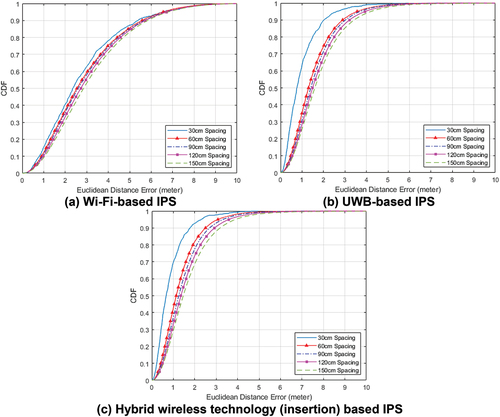
The second experiment was conducted using three different fingerprint patterns to study the impact of spacing size between data acquisition points, on the positioning accuracy of three different IPS. Each IPS has different accuracy. While presenting the results for the second experiment, the terms Wi-Fi-based IPS, UWB-based IPS and hybrid wireless technology (insertion) based IPS are the terms used to refer to the IPS systems with the fingerprints formed by RSS from six Wi-Fi anchors, six UWB anchors, or six Wi-Fi anchors and six UWB anchors, respectively. Based on the first experiment results, Wi-Fi-based IPS shows the largest positioning error. In contrast, hybrid wireless technology (insertion) based IPS shows the smallest positioning error. The impact of spacing size between data acquisition points on positioning performance for each IPS can be presented using CDF, as shown in Figure . Based on the three CDF graphs, it can be observed that the positioning performance will degrade when the spacing between data acquisition points becomes larger. In (Figure ), when the spacing between data acquisition points is 30 cm, the positioning performance of hybrid wireless technology (insertion) based IPS shows that 92.74% of predictions made are within 2 m error. However, the percentage decreases to 68.78% when the spacing size increases to 150 cm.
Figure 15. Positioning performance for IPS when fingerprints are collected under different spacing sizes between data acquisition points.
The median positioning error for each IPS when data acquisition is conducted with different spacing sizes is tabulated in Table . According to Table , it can be observed that the median Euclidean distance errors for all three IPS increase when the spacing size becomes larger. For instance, Wi-Fi-based IPS shows a median Euclidean distance error of 2.346 m when spacing size is 0.3 m. The error increases to 2.850 m when spacing size increases to 1.5 m. In addition, the accuracy factors for Wi-Fi and UWB based IPS against hybrid wireless technology (insertion) based IPS are also tabulated in Table . According to the accuracy factor column of Table , a smaller accuracy factor is generally observed when spacing size increases. For instance, the largest accuracy factor of 3.528 is observed at 0.3 m spacing size, when the median Euclidean distance error of Wi-Fi-based IPS divided by the median Euclidean distance error of hybrid wireless technology (insertion) based IPS. When the spacing size increased to 1.5 m, the accuracy factor reduces to 1.947. On average, hybrid wireless technology based IPS is 2.357 times more accurate than Wi-Fi-based IPS.
Table 4. Positioning performance for each IPS when data acquisition is conducted with different spacing sizes
4. Conclusion and future work
In conclusion, an IPS developed entirely using Wi-Fi benefits from low development costs by utilising existing Wi-Fi infrastructure but will experience limited positioning accuracy. Combining different positioning algorithms is an approach to mitigate limited positioning accuracy issues. However, the approach will compromise the system algorithm complexity. On the other hand, an IPS developed entirely using UWB can benefit from high accuracy, but the development cost is expensive. As a result, this paper proposed an approach to improve Wi-Fi RSS fingerprinting-based IPS accuracy by integrating UWB RSS into Wi-Fi RSS fingerprinting-based IPS to construct a hybrid wireless technology (Wi-Fi and UWB) RSS fingerprinting-based IPS. This approach is less in complexity in terms of RSS, as simple positioning parameter is used. Experiments are conducted to evaluate the performance of the approach proposed and the results show that hybrid wireless technology (insertion) RSS fingerprinting-based IPS using neural network presented the smallest median Euclidean distance error of 0.665 m. The median Euclidean distance error is 3.528 times smaller than the median Euclidean distance error presented by Wi-Fi RSS-based IPS. In addition, in the study of different spacing sizes impact on positioning accuracy, hybrid wireless technology RSS fingerprinting-based IPS presented an accuracy of 2.357 times on average more accurate than Wi-Fi RSS fingerprinting-based IPS.
For future work, the positioning performance of hybrid wireless technology (replacement) RSS fingerprinting-based IPS can be further investigated. Replacement approach provides limited positioning accuracy improvement compared to insertion approach. However, the replacement approach can provide the benefit in maintaining the computational cost, since the length of the environmental reading is maintained. According to A. A. Abed and Abdel-Qader (Citation2019), selecting wireless anchors based on certain criteria can allow IPS to achieve better positioning performance, compared to the random selection of anchors. Thus, replacing specific Wi-Fi anchors with UWB anchors based on certain criteria is expected to improve positioning performance. One of the considered criteria can be the maximum spatial variance.
Disclosure statement
No potential conflict of interest was reported by the author(s).
Additional information
Funding
References
- Abed, A. K., & Abdel-Qader, I. (2018). Access point selection using particle swarm optimization in Indoor positioning systems. In NAECON 2018 - IEEE national aerospace and electronics conference (pp. 403–23). IEEE. https://doi.org/10.1109/NAECON.2018.8556731
- Abed, A., & Abdel-Qader, I. (2019). RSS-fingerprint dimensionality reduction for multiple service set identifier-based indoor positioning systems. Applied Sciences, 9(15), 3137. https://doi.org/10.3390/app9153137
- Adege, A. B., Lin, H. P., Tarekegn, G. B., Munaye, Y. Y., & Yen, L. (2018). An indoor and outdoor positioning using a hybrid of support vector machine and deep neural network algorithms. Journal of Sensors, 2018. https://doi.org/10.1155/2018/1253752
- Bai, N., Tian, Y., Liu, Y., Yuan, Z., Xiao, Z., & Zhou, J. (2020). A high-precision and low-cost IMU-based indoor pedestrian positioning technique. IEEE Sensors Journal, 20(12), 6716–6726. https://doi.org/10.1109/JSEN.2020.2976102
- IndoorAtlasBourne, V. (2016). The rise of indoor positioning: A 2016 Global Research Report On The Indoor Positioning Market. IndoorAtlas.
- Chong, A. M. S, Yeo, B. C, & Lim, W. S. (2022). Automatic data acquisition system for Wi-Fi fingerprint-based indoor positioning system. International Journal of Innovative Computing, Information and Control (IJICIC), 18(1), 231–252. https://doi.org/10.24507/ijicic.18.01.231
- Dong, Z., Mengjiao, C., & Wenjuan, L. (2017). Implementation of indoor fingerprint positioning based on ZigBee. In Proceedings of the 29th Chinese control and decision conference, CCDC 2017 (pp. 2654–2659). IEEE. https://doi.org/10.1109/CCDC.2017.7978963
- Hong, J. M., Kim, S. H., Kim, K. J., & Kim, C. G. (2019). Multi-cell based UWB indoor positioning system. In Intelligent information and database systems (Vol. 11432, pp. 543–554). Springer International Publishing. https://doi.org/10.1007/978-3-030-14802-7_47
- Hsieh, C. H., Chen, J. Y., & Nien, B. H. (2019). Deep learning-based indoor localization using received signal strength and channel state information. IEEE Access, 7, 33256–33267. https://doi.org/10.1109/ACCESS.2019.2903487
- Ingram, S. J., Harmer, D., & Quinlan, M. (2004). UltraWideBand indoor positioning systems and their use in emergencies. In PLANS 2004. position location and navigation symposium (IEEE CAT. NO. 04CH37556) (pp. 706–715).
- Jardak, N., & Samama, N. (2009). Indoor positioning based on GPS-repeaters: Performance enhancement using an open code loop architecture. IEEE Transactions on Aerospace and Electronic Systems, 45(1), 347–359. https://doi.org/10.1109/TAES.2009.4805284
- Jiang, B., & Yao, X. (2006). Location-based services and GIS in perspective. Computers, Environment and Urban Systems, 30(6), 712–725. https://doi.org/10.1016/j.compenvurbsys.2006.02.003
- Kurek, A., & Modelski, J. (2006). Application of the repeaters for indoor localization. In 2006 european conference on wireless technology (pp. 219–222). https://doi.org/10.1109/ECWT.2006.280475
- Lashiley. (2009). GNSS solutions: Repeaters, pseudolites and indoor positioning. Inside GNSS, 18–21. https://www.insidegnss.com/auto/julyaug09-GNSS-Sol.pdf
- Lee, S., Koo, B., Jin, M., Park, C., Lee, M. J., & Kim, S. (2014). Range-free indoor positioning system using smartphone with Bluetooth capability. 2014 IEEE/ION position, location and navigation symposium - PLANS 2014, 657–662. https://doi.org/10.1109/PLANS.2014.6851428
- Luo, R. C., & Hsiao, T. J. (2019). Indoor localization system based on hybrid Wi-Fi/ble and hierarchical topological fingerprinting approach. IEEE Transactions on Vehicular Technology, 68(11), 10791–10806. https://doi.org/10.1109/TVT.2019.2938893
- Lv, Y., Chen, L., Zhang, D., & Liu, J. (2021). Research on indoor mobile node localization based on wireless sensor networks. Engineering Letters, 29(2), 562–574. http://www.engineeringletters.com/issues_v29/issue_2/EL_29_2_25.pdf
- MarketsandMarkets. (2020). Ultra-wideband market by application (RTLS, imaging, communication), positioning system (indoor, outdoor. Vertical (Healthcare, Automotive & Transportation, Manufacturing, Consumer Electronics, Residential, Retail), & Geography - Global Forecast to 2025. https://www.researchandmarkets.com/reports/5025111/ultra-wideband-market-by-application-rtls
- Medina, C., Segura, J. C., & De la Torre, Á. (2013a). Ultrasound indoor positioning system based on a low-power wireless sensor network providing sub-centimeter accuracy. Sensors (Switzerland), 13(3), 3501–3526. https://doi.org/10.3390/s130303501
- Medina, C., Segura, J. C., & De La Torre, Á. (2013b). A synchronous TDMA ultrasonic tof measurement system for low-power wireless sensor networks. IEEE Transactions on Instrumentation and Measurement, 62(3), 599–611. https://doi.org/10.1109/TIM.2012.2218056
- Nastac, D. I., Iftimie, F. A., Arsene, O., & Cherciu, C. (2017). A statistical estimation analysis of indoor positioning WLAN based fingerprinting. In 2017 IEEE 23rd international symposium for design and technology in electronic packaging (SIITME) (pp. 239–242). IEEE. https://doi.org/10.1109/SIITME.2017.8259898
- Oh, J. H., Kim, D., & Lee, B. H. (2014). An indoor localization system for mobile robots using an active infrared positioning sensor. Journal of Industrial and Intelligent Information, 2(1), 35–38. https://doi.org/10.12720/jiii.2.1.35-38
- Özsoy, K., Bozkurt, A., & Tekin, I. (2010). 2D indoor positioning system using GPS signals. 2010 international conference on indoor positioning and indoor navigation, IPIN 2010 - conference proceedings, (September), 15–17. https://doi.org/10.1109/IPIN.2010.5647644
- Poulose, A., Eyobu, O. S., & Han, D. S. (2019). An indoor position-estimation algorithm using smartphone IMU sensor data. IEEE Access, 7, 11165–11177. https://doi.org/10.1109/ACCESS.2019.2891942
- Rahman, T. A. Z., Ramli, N., Rahman, M. A. A., & Mohamad, H. (2020). Hybrid nearest neighbour and feed-forward neural networks algorithm for indoor positioning system. In 2020 IEEE 8th conference on systems, process and control (ICSPC) (pp. 37–40). https://doi.org/10.1109/ICSPC50992.2020.9305770
- Rashid, M. T., Chowdhury, M. S. S., & Nawal, M. F. (2016). composite indoor localization and positioning system based on Wi-Fi repeater technology. In 2016 iIEEE region 10 conference (TENCON) (pp. 2130–2133). https://doi.org/10.1109/TENCON.2016.7848402
- Romme, J., & Kull, B. (2003). On the relation between bandwidth and robustness of indoor UWB communication. In IEEE conference on ultra wideband systems and technologies, 2003 (pp. 255–259). https://doi.org/10.1109/UWBST.2003.1267843
- Ryschka, S., Murawski, M., & Bick, M. (2016). Location-based services. Business & Information Systems Engineering, 58(3), 233–237. https://doi.org/10.1007/s12599-016-0430-8
- Schneider, A., & Feussner, H. (2017). Tracking and navigation systems. Biomedical Engineering in Gastrointestinal Surgery, 443–472. https://doi.org/10.1016/b978-0-12-803230-5.00011-7
- Sitaula, C., & Ghimire, N. (2017). An analysis of early stopping and dropout regularization in deep learning. International Journal of Conceptions on Computing and Information Technology, 5(1), 17–20. https://wairco.org/IJCCIT/April2017Paper3.pdf
- Subedi, S., Hwang, S. S., & Pyun, J. Y. (2020). Hybrid wireless indoor positioning system combining BLE beacons and Wi-Fi APs. In 2020 international conference on information and communication technology convergence (ICTC) (pp. 36–41). https://doi.org/10.1109/ICTC49870.2020.9289235
- Tan, K. G., Khaing, Z. A., Moe, S. A., Min, T. S., Azlan, A., Chia, P. L., … Wong Hin, Y. (2021). Review of indoor positioning: radio wave technology. Applied Sciences, 11(1), 279. https://doi.org/10.3390/app11010279
- Uradzinski, M., Guo, H., Liu, X., & Yu, M. (2017). Advanced indoor positioning using Zigbee wireless technology. Wireless Personal Communications, 97(4), 6509–6518. https://doi.org/10.1007/s11277-017-4852-5
- Wang, Y., Ye, Q., Cheng, J., & Wang, L. (2015). RSSI-based Bluetooth indoor localization. In 2015 11th international conference on mobile Ad-hoc and sensor networks (MSN) (pp. 165–171). https://doi.org/10.1109/MSN.2015.14
- Wang, K., Nirmalathas, A., Lim, C., Alameh, K., Li, H., & Skafidas, E. (2017). Indoor infrared optical wireless localization system with background light power estimation capability. Optics Express, 25(19), 22923–22931. https://doi.org/10.1364/OE.25.022923
- Wei, Z., Chen, X., Fang, L., Zhao, N., Guo, S., & Li, X. (2018). Joint positioning technique based on TOF and TDOA. In 2018 IEEE international instrumentation and measurement technology conference (I2MTC) (pp. 1–6). IEEE. https://doi.org/10.1109/I2MTC.2018.8409683
- Zheng, A. (2015). Evaluating machine learning models. O’Reilly Media, Inc.