
 ?Mathematical formulae have been encoded as MathML and are displayed in this HTML version using MathJax in order to improve their display. Uncheck the box to turn MathJax off. This feature requires Javascript. Click on a formula to zoom.
Abstract
Owing to its relevance to several conflicting decision criteria, subjective information, different preferences, and ambiguities, multimodal transportation route selection is a multiple-criteria decision-making problem. The main research question involved here is whether decision-makers require a tool to select multimodal freight routes based on quantitative and qualitative decision criteria, including decision-makers’ preferences. This study proposes a novel hybrid approach that integrates fuzzy risk assessment-based incenter of centroid method, fuzzy analytic hierarchy process (AHP), and VIKOR (Vlse Kriterijumska Optimizacija I Kompromisno Resenje). The incenter of centroid method of fuzzy risk assessment produces precise results of risk levels, while the extent analysis on fuzzy AHP computes relative weights of attributes. Transportation cost and time, reliable risk magnitudes, and priority values are synthesized using VIKOR. The effectiveness and applicability of the proposed approach were verified through an empirical route selection from Thailand to China. The proposed methodology appropriately answers the research question by providing the most optimal transportation route and systematically yields the best compromise solution among all decision-making elements. The contributions of this study provide a new decision support model and aid decision-makers in designing comprehensive transportation planning under uncertainties.
1. Introduction
Global supply chains have been directly interrupted owing to the outbreak of coronavirus disease and the spread of infection in several countries. Although most businesses have been severely affected by nationwide lockdown measures, international and domestic transportations continue operating during the pandemic and post-pandemic periods. Commercial entrepreneurs must develop a more effective distribution system that links local goods to global markets. Multimodal transportation is a key component of the future of international trade and a region’s economic recovery, and it serves as an effective long-haul carriage with door-to-door services by combining different transportation modes (Zhang et al., Citation2017). There are many advantages of multimodal transportation, such as minimizing the overall transportation cost and time, decreasing the burden of issuing multiple documentation for each segment, increasing the ability of freight activities, reducing emissions, and easier monitoring of products at transshipment points. However, the selection of a multimodal route with maximization of benefits and minimization of non-benefits is the most critical task, which can be considered a multiple-criteria decision-making (MCDM) problem because of the large number of conflicting decision criteria, the set of feasible alternatives, and different preferences (Lu et al., Citation2022). These decision criteria have different optimal conditions and priorities, with each route having its own performance criteria, for example, a route with low transportation cost incurs long transportation time or a route with short transportation time has high transportation cost. Hence, emphasizing a single decision-making element for multimodal route selection is unreasonable. Thus, there is a need for an effective approach to select a suitable freight route.
Many MCDM approaches, analytic hierarchy process (AHP), technique for order preference by similarity to ideal solution (TOPSIS), preference ranking organization method for enrichment of evaluations (PROMETHEE), VIKOR (Vlse Kriterijumska Optimizacija I Kompromisno Resenje), and elimination and choice translating reality (ELECTRE), effectively address numerous problems; however, each method has its own distinct strengths and weaknesses. It is essential to integrate two or more methods by utilizing each other’s advantages, for example, one approach is used to prioritize decision-making attributes, while other approaches are used to find outranking relations. This integration is also known as a hybrid approach (Sitorus et al., Citation2019). Among the existing MCDM techniques, AHP is the most popular method for determining the attribute weights in transportation because it allows decision-makers to make paired judgments through importance scales. However, AHP is connected with human thinking, subjective opinions, and inherent carelessness in pairwise comparisons (Koohathongsumrit & Luangpaiboon, Citation2021). To overcome these limitations, fuzzy AHP is used to make more flexible and easy decisions using fuzzy numbers and linguistic variables rather than crisp scales. With regard to the ranking approaches, VIKOR is outstanding compared to the other approaches because it seeks compromise sorting with conflicting resolution and non-commensurable criteria (Büyüközkan & Tüfekçi, Citation2021). This approach can specify either the best alternative or an accommodating solution in accordance with the relations betweengroup utility and individual regret. Based on the aforementioned advantages, fuzzy AHP and VIKOR were selected and worked together in handling route selection problems.
In fact, freight route selection involves not only cost and time but also various risks, which can be classified as qualitative criteria. These risks are important for transportation decision-making because of decreasing reputations and profits in addition to crashes, accidents, delays, and failure of shipment. Although many hybrid approaches can address route selection problems, they cannot evaluate qualitative criteria. Risk assessment is the most preferred method for assessing unexpected events based on the probability of occurrence and severity of consequences (Vilko et al., Citation2019). The results of this technique can be used as an input for hybridization. However, risk assessment is improper in unstable conditions since decision-makers encounter several uncertainties in risk calculation processes, such as relying on personal experience, lack of expertise, deviation of the actual data format from expectations and/or related documents, loss of datasets for assessment, and subjective assessment scales (Wu et al., Citation2019). Fuzzy set theory was combined to enhance traditional risk assessment. This extension is called fuzzy risk assessment, which converts crisp scales of judgments into fuzzy numbers and linguistic terms for measuring risk magnitudes through fuzzy operations. Because fuzzy risk assessment concerns a set of possible values with their membership values ranging between zero and one, an optimal point of fuzzy risk results must be defined through systematic defuzzification procedures. In this regard, the incenter of centroid method, which is a defuzzifier used in fuzzy control systems, appropriately applies to both triangular and trapezoidal fuzzy numbers (Shah & Chatterjee, Citation2020). This method considers the relative relationships between geometric shapes and their center points, provides better reference points, ranks fuzzy results through rational crisp numbers, and facilitates easy calculation compared with other clustering analysis methods (Andrić & Lu, Citation2017). Therefore, a fuzzy risk assessment-based incenter of centroid method was used in the proposed approach to evaluate unexpected events.
This study first proposed a new hybrid MCDM approach to select the most appropriate route in multimodal transportation networks. The proposed approach includes three main phases: risk magnitude calculation, weight determination, and multimodal route selection. The first phase allowed decision-makers to express their verbal judgments on likelihood and severity through linguistic variables and trapezoidal fuzzy numbers. The reliable risk magnitudes were calculated by fuzzy arithmetic operations and the incenter of centroid analysis. For the second phase, Chang’s extent analysis computed relative weights of decision criteria. In the last phase, the VIKOR identified the most optimal multimodal route based on transportation cost and time, risk magnitudes, including decision criteria priorities. Finally, the realistic multimodal route selection between Thailand and China was illustrated to exhibit the capability and aptness of the proposed approach.
The remaining of the article is structured as follows: Section 2 provides a state-of the-art literature survey on hybrid approaches of freight route selection; Section 3 briefly presents the related methods; Section 4 introduces the proposed approach; Section 5 demonstrates the implementation of the proposed approach; Section 6 validates the reliability and robustness of the proposed approach through sensitivity and comparative analyses; Section 7 discusses obtained results; and finally, Section 8 concludes this study.
2. Literature review
In related literature on multimodal route selection problems, a simple idea of the hybrid approach is that crisp MCDM approaches are integrated with other MCDM approaches and/or fuzzy set theory; however, this concept cannot evaluate the qualitative risk levels. Moon et al. (Citation2015) compared multimodal freight routes between Busan and Berlin using the fuzzy weight calculation and TOPSIS. Singh and Singh (Citation2018) constructed a decision support method for route selection, in which the axiomatic fuzzy logic, AHP, and TOPSIS were utilized. Y. Wang and Yeo (Citation2018) adapted the fuzzy ELECTRE and group decision-making process to explore intermodal routes between Korea and Kazakhstan. Liang and Meng (Citation2019) produced the extended tools for freeway route selection, whereby TOPSIS was enhanced by fuzzy logic and interval-valued membership values. Sarraf and McGuire (Citation2020) compared individual and integrated MCDM approaches for route planning. Meethom and Koohathongsumrit (Citation2020) established a decision support system-based unsystematic fuzzy number for freight transportation routing. Multilayer zero-one goal programming, potential assessment criteria, and fuzzy AHP were worked together.
As risk factors affect multimodal transportation, a risk assessment method is incorporated in hybrid approaches to measure the risk levels based on likelihood and severity. In the past, many studies used hybrid approaches with risk assessment for ranking multimodal routes from the most to the least preferred alternatives. Kengpol et al. (Citation2014) developed a decision support framework, whereby risk analysis-based data envelopment analysis (DEA), AHP, and zero-one goal programming models were used to select the most optimal route between Thailand and Vietnam. Kengpol and Tuammee (Citation2016) improved the decision support model of ranking multimodal freight corridors based on the AHP-DEA model and semi-quantitative risk analysis. Koohathongsumrit and Luangpaiboon (Citation2020) developed the zero-one desirability programming model and risk analysis to solve the route selection problem from Thailand to Cambodia. Kaewfak et al. (Citation2020) presented a two-stage risk assessment to prioritize multimodal transportation routes. They adapted the fuzzy set theory into the decision-making processes. Koohathongsumrit and Meethom (Citation2021b) used the risk assessment method to determine risk levels, which were analyzed by the integrated AHP-DEA-TOPSIS approach.
As mentioned previously, risk assessment is inefficient under fuzzy circumstances. Employing fuzzy risk assessment, which provides more reliable results for risk analysis, is inevitable. There are a few hybrid approaches that integrate fuzzy risk assessment to solve such problems. Koohathongsumrit and Meethom (Citation2021a) invented the decision-making framework including the fuzzy risk assessment model and MCDM approaches to select the most appropriate multimodal route, in which Mamdani’s inference system and DEA model were applied to calculate risk levels. Koohathongsumrit and Meethom (Citation2022) selected the most optimal multimodal transportation route by employing the decision-making framework of fuzzy Delphi method, fuzzy risk assessment, fuzzy AHP, and fuzzy TOPSIS. In addition to the above-mentioned studies, some works developed various mathematical models of supply chain solutions based on multi-objective simulated annealing algorithm, multi-objective invasive weed optimization algorithm, possibilistic linear programming, and fuzzy weighted goal programming; more details are found in the papers of Tirkolaee et al. (Citation2022) and Tirkolaee and Aydin (Citation2022). These models are advanced to simultaneously minimize non-beneficial attributes (such as cost, emission, and word load) and maximize beneficial attributes (such as citizenship satisfaction and job opportunity) but cannot evaluate risk magnitudes and compromise all decision-making elements to find the most optimal alternative.
Based on the review above, it is clear that there are research gaps. First, none of the previous studies considered the optimal point of intersection of the fuzzy risk levels. This problem can be overcome using the fuzzy risk assessment-based incenter of centroid method to approximate highly reliable risk magnitudes, defined as input data for decision-making. Second, the ranking of possible routes with maximum group benefit and minimum regret has not been examined. The combination of fuzzy AHP and VIKOR overcomes this limitation. Finally, existing studies have not presented a hybrid MCDM approach that can simultaneously assess disruptions along freight corridors and compromise all attributes in the final results. To bridge these research gaps, this study first developed a novel hybrid approach that integrates the fuzzy risk assessment-based incenter of centroid method, fuzzy AHP, and VIKOR to select the most appropriate multimodal transportation route in fuzzy environments.
3. Related methods
3.1. Trapezoidal fuzzy numbers
The fuzzification process has been applied to convert crisp quantities to fuzzy quantities because a crisp number is insufficient owing to ambiguities that exist in real-world applications (Jain & Singh, Citation2020). A fuzzy number is expressed as a fuzzy set of real numbers with normal, fuzzy convex, and continuous relationship. There are various membership functions of fuzzy numbers, such as triangular, trapezoidal, pentagonal, heptagonal, gaussian, generalized-bell, and parametric functions (Mhaske & Bondar, Citation2020; Tchendjou et al., Citation2018). In the current study, the trapezoidal fuzzy number was applied owing to its simpler algorithm of arithmetic operations and easier interpretation than the others. Let = (w, x, y, z;
) be a generalized trapezoidal fuzzy number (see Figure ), whose membership function can be written as follows:
Figure 1. Generalized trapezoidal fuzzy number.
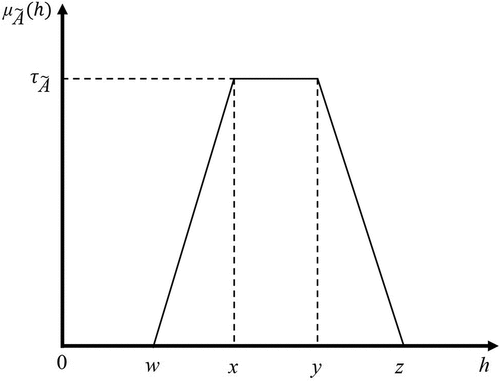
where is the membership degree of h; w, x, y, z, and τA are the lower limit, lower support limit, upper support limit, upper limit, and constant values, respectively; w < x < y < z; τA
[0, 1]. When x = y, the trapezoidal fuzzy number is transformed into triangular fuzzy numbers (Ziemba, Citation2018).
According to , is a trapezoidal fuzzy number in the case of τA = 1; a real value, which lies between x and y has the membership degree of one; the membership degree is increased, if the value between w and x is close to the element of x; the value between y and z has less degree of membership, if it converges to the element of z; the membership degree is equal to zero, if a value is either lower than w or greater than z. The trapezoidal fuzzy number has been widely applied in numerous sectors: supplier selection (Mina et al., Citation2021), steam valve system (W. W. Wang et al., Citation2019), market segmentation (Keshavarz Ghorabaee et al., Citation2017), maintenance planning (Seiti et al., Citation2019), and manufacturing systems (Rudnik & Kacprzak, Citation2017). Nevertheless, this type of fuzzy number has not been employed in selecting multimodal route. In this study, trapezoidal fuzzy numbers were adapted to comprehensively reflect the decision-making in the risk analysis processes of the proposed approach.
3.2. Incenter of centroid method
Although fuzzy results are accurate and credible, they cannot be interpreted in real-life applications. Here, a defuzzification method refers to a process for transforming fuzzy results into crisp numbers of fuzzy sets to rank fuzzy outputs (H. H. Wang et al., Citation2019). Many defuzzification methods have been presented, such as center of gravity, center of sums, weighted average, center of area, and maxima methods (Kiran et al., Citation2020). The incenter of centroid method is one of the defuzzifiers and its concept attempts to divide the trapezium into three shapes, consisting of two triangles and one rectangle. Let Q1, Q2, and Q3 be the centroids of each form, as depicted in (Samantra et al., Citation2014).
Figure 2. Incenter of centroid.
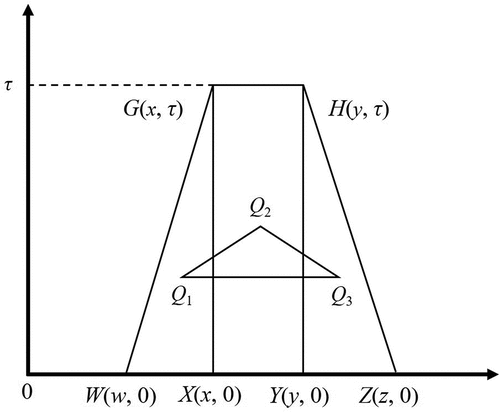
These centroids are operated by the orthocenter system, which can identify the entry points of the generalized fuzzy numbers. The centroids of each shape can be calculated as follows: Q1 = ((w + 2x)/3, τ/3), Q2 = ((x + y)/2, τ/2), and Q3 = ((2y + z)/3, τ/3). Equation of the line is y = τ/3 and Q2 does not lie on the line. Therefore, Q1, Q2, and Q3 are non-collinear to form a triangle.
Assuming be the balancing point generated from the coordination of Q1, Q2, and Q3. Then, the incenter of centroid point is determined as follows:
where
If the trapezoidal fuzzy number is transformed into a triangular form, that is, x = y, the incenter of the centroid point is approximated as follows:
where
The crisp outputs in the area between the incenter of centroid value of both fuzzy numbers can be calculated; then, the ranking function of fuzzy numbers (R()) is defined by multiplying
0 and
0 (Muneeswaran et al., Citation2020). Although this method has many benefits for defuzzifying fuzzy outputs, none of the previous studies employed the incenter of centroid method to solve route selection problems. Hence, this study used the incenter of centroid method to synthesize rational risk magnitudes in the multimodal transportation chains.
3.3. Fuzzy risk assessment
Risk assessment refers to the process of identifying and analyzing future events that negatively impact organizations. Decision-makers and/or assessors are allowed to make a formal judgment on the probability and consequence to determine the magnitudes of unforeseen events (Muhammet Gul & Ak, Citation2018). On the basis of conventional risk assessment, risk magnitude can be estimated as follows (Karasan et al., Citation2018):
where RM, P, and S are risk magnitude, probability, and severity. Risk assessment indicates the relationship between the likelihood of occurrence and severity of impact; however, this technique involves subjectivity, inaccuracy, and fuzziness. To capture the uncertainties, fuzzy set theory invented by Zadeh (Citation1965) can handle vague data and has been favorably integrated with traditional risk assessment. Fuzzy risk assessment is developed to measure risk magnitudes using fuzzy numbers instead of crisp rating scales, and it can facilitate decision-makers in evaluating risks under uncertainties. Over the past decade, fuzzy risk assessment has been done in different fields: construction projects (Biswas & Zaman, Citation2019), software development (Hsieh et al., Citation2018), manufacturing (Moreno-Cabezali & Fernandez-Crehuet, Citation2020), air transportation (Skorupski, Citation2016), and underground mining (Iphar & Cukurluoz, Citation2020). Few studies have used fuzzy risk assessments in transportation decision-making problems (for more details see Koohathongsumrit and Meethom (Citation2021a) and Koohathongsumrit and Meethom (Citation2022)). However, the fuzzy risk-analysis-based incenter of centroid method has not been utilized in decision processes. This study employed the fuzzy risk assessment-based incenter of centroid method to compute more reliable risk magnitudes, which were considered in company with quantitative data in the proposed approach.
3.4. Fuzzy analytic hierarchy process
AHP originated in the early 1970s to optimize resource allocation in military sectors and is one of the best-known MCDM methods to assign attribute weights (Mahapatra et al., Citation2020). This method has many benefits: reducing large-scale problems to a set of uncomplicated ones (i.e., comparisons between pairs of alternative values within criteria and between pairs of decision criteria), cooperating with both qualitative and quantitative decision criteria, checking the consistency of decision-makers’ judgments, and formulating a hierarchical structure of all attributes (Daniyan et al., Citation2020). Although AHP has been commonly applied to elicit preferences, this approach has many limitations, which can be eliminated by combining it with the fuzzy set theory. The fuzzy extent analysis of fuzzy AHP developed by Chang (Citation1996) is frequently used because of straightforward computation processes, precise reflection of human thinking, and simple arithmetic operations. Over the last few years, Chang’s extent analysis has been accepted in a variety of areas: supplier selection (Mohammed et al., Citation2019), fog computing services (Ogundoyin & Kamil, Citation2020), plant management (Marhavilas et al., Citation2020), software development (Khan et al., Citation2019), and credit scoring (Ignatius et al., Citation2018). Despite the rich literature on fuzzy AHP, few studies have utilized this approach to determine decision criteria priorities for multimodal route selection. More details can be found in some studies (e.g., Kaewfak et al. (Citation2020) and Koohathongsumrit and Meethom (Citation2021a)). In addition, fuzzy AHP with the risk assessment-based incenter of centroid method and VIKOR has not been explored. To improve decision-making capability, a novel integrated approach, which includes fuzzy AHP with extent analysis, fuzzy risk assessment-based incenter of centroid, and VIKOR, was developed in this study.
3.5. VIKOR (Vlse Kriterijumska Optimizacija I Kompromisno Resenje)
Among the existing MCDM approaches for comparing all feasible alternatives, VIKOR proposed by Opricovic (Citation1998) is the most popular tool because it can specify the best alternative and/or the compromise rankings of alternatives (Malekpoor et al., Citation2018). This approach has numerous advantages: balancing the maximum group effectiveness of the “majority” and the minimum individual sacrifice of the “opponent,” reducing the gap between the ideal and anti-ideal solutions, operating based on straightforward calculations with a high potential, and providing an agreement established by mutual concessions (Rafieyan et al., Citation2020). In last few years, VIKOR has been widely done in many fields: marine vehicle stabilization system (Demirel et al., Citation2020), operational and financial evaluations (Gudiel Pineda et al., Citation2018) site selection (Guleria & Bajaj, Citation2020), robot selection (Narayanamoorthy et al., Citation2019), and material management (Dev et al., Citation2020). Despite the extensive acceptance of VIKOR in the context of decision-making problems, this approach has not been worked in conjunction with fuzzy risk assessment and fuzzy AHP for multimodal route selection. To visualize these problems, a new hybrid MCDM approach integrating the fuzzy risk assessment-based incenter of centroid method, fuzzy AHP, and VIKOR was first formulated to select the most appropriate route in multimodal transportation networks.
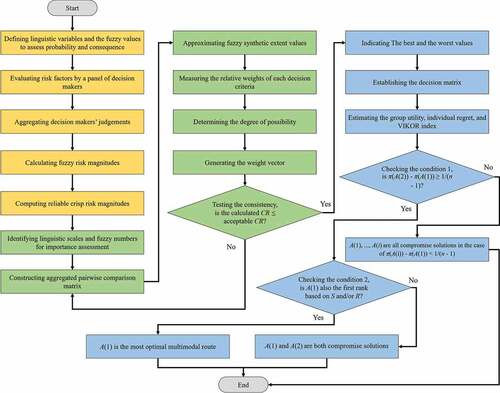
4. Proposed approach
This section presents a new hybrid MCDM approach that includes three main phases: risk calculation with the fuzzy risk assessment-based incenter of centroid method, weight determination using fuzzy AHP, and route selection employing VIKOR. The details of each phase are given in the following sections and depicted in .
Figure 3. Flowchart of the proposed hybrid MCDM approach.
4.1. Phase 1: Risk magnitude calculation
Because risks along multimodal transportation routes influence transportation, it is necessary to examine them in the decision-making processes. Generally, the consideration of these undesirable events focuses on measuring the risk magnitudes represented by numerical values, but this process is complex and inconclusive. Fuzzy risk assessment has been adapted to generate risk magnitudes, which are approximated using fuzzy scales and arithmetic operations on fuzzy numbers instead of crisp scales and traditional multiplication of the two parameters. However, fuzzy results cannot be clearly interpreted. It is essential to find the best representation of the fuzzified outputs. This phase attempts to measure risk magnitudes by applying the fuzzy risk assessment-based incenter of centroid method in the following steps:
Step 1: Linguistic variables and fuzzy values used to assess the probability and consequence are defined based on trapezoidal fuzzy numbers and a five-point assessment scale. These linguistic variables are more convenient for decision-makers to express their judgments of likelihood and severity. With reference to the fuzzy numbers of each linguistic term, they comprise the four breakpoints of trapezium, where w and z are the lower and upper limits with non-membership degrees; x and y are the lower and upper support limits with membership degrees of one (Ponnialagan et al., Citation2018). The linguistic variables and trapezoidal fuzzy numbers are shown in .
Table 1. Linguistic variables and fuzzy numbers for likelihood and severity
Step 2: A panel of decision-makers is formed to evaluate all risk factors using the linguistic variables; all responses are collected through in-depth interviews. Each decision-maker must be an expert with a professional experience of at least 10 years in the fields of logistics management, transportation planning, and/or supply chain optimization. There is no agreement on the number of participants, as the number of decision-makers depends on the qualification, knowledge, and experience pertaining to a case problem (Rajabi et al., Citation2020). Next, all the linguistic variables are converted into fuzzy numbers. Suppose that = (
,
,
,
) and
= (
,
,
,
) are the trapezoidal fuzzy numbers of likelihood and severity for the ith route and the jth decision criterion, given by the kth decision-maker, where
,
,
, and
are defined as the parameters of trapezoidal fuzzy numbers of likelihood for the ith route and the jth decision criteria, given by the kth decision-maker;
,
,
, and
are defined as the parameters of trapezoidal fuzzy numbers of severity for the ith route and the jth decision criteria, given by the kth decision-maker; n denotes the number of routes; m is the number of decision criteria; and K refers to the number of decision-makers; i = 1, 2, …, n; j = 1, 2, …, m; k = 1, 2, …, K.
Step 3: All decision-makers’ judgments are aggregated. Let = (
,
,
,
) and
= (
,
,
,
) be the aggregated trapezoidal fuzzy numbers of likelihood and severity for the ith route and the jth decision criterion, where
,
,
, and
are the aggregated parameters of trapezoidal fuzzy number of likelihood for the ith route and the jth decision criterion, while
,
,
, and
are the aggregated parameters of trapezoidal fuzzy number of severity for the ith route and the jth decision criterion. Consequently, the individual trapezoidal fuzzy numbers on the likelihood and severity of each decision-maker are averaged to determine individual viewpoint representations, as given below:
The two above formulations can be rewritten as follows:
Step 4: Fuzzy risk magnitudes are calculated by multiplying two aggregated trapezoidal fuzzy numbers. Assuming = (
,
,
,
) be the fuzzy risk magnitude of the ith route and the jth decision criterion, where
,
,
, and
are the aggregated parameters of trapezoidal fuzzy number of risk magnitude for the ith route and the jth decision criterion. Therefore, the fuzzy risk magnitudes are calculated as follows (Chu & Nguyen, Citation2019):
Step 5: Reliable crisp risk magnitudes are computed comprehensively based on the balancing points of the fuzzy numbers. In this situation, the aggregated parameters of the fuzzy risk magnitudes are operated in accordance with the concept of the incenter of centroid method, as follows (Samantra et al., Citation2014):
where RMij is the crisp risk magnitude for the ith route and the jth decision criterion; α =; β = (2
+ z −
− 2
)/3; γ = ((3
− 2
−
)2 − τ2)1/2/6.
4.2. Phase 2: Weight determination
In MCDM contexts with a large number of decision criteria, it is uncommon to assign equal weights to all elements as compared to when proper weights are given. This circumstance is similar to the decision-makers’ preferences for multimodal route selection (Koohathongsumrit & Meethom, Citation2021b). In this phase, the extent analysis on fuzzy AHP is utilized to determine priorities of decision criteria, as follows:
Step 1: Linguistic scales and fuzzy numbers for importance assessment are identified as shown in . Decision-makers provide their preferences in pairs of decision criteria using these scales.
Table 2. Linguistic variables and fuzzy numbers for importance assessment
Step 2: The decision-makers construct their own pairwise comparison matrix and generate priorities among the decision criteria by applying importance scales. Let Mk = [Sijk]m×m be the fuzzy pairwise comparison matrix of the ith and jth decision criteria formed by the kth decision-maker, where Mijk = (lijk, mijk,uijk); l, m, and u are the lower, middle, and upper values of the importance assessment; l < m < u. All pairwise matrices are aggregated by the fuzzy arithmetic mean. The aggregated pairwise comparison matrix is established as follows:
where is the aggregated pairwise comparison matrix;
= (
) is the aggregated fuzzy numbers;
, and
refer to the aggregated lower, middle, and upper values; if i = j,
= (1.00, 1.00, 1.00); i and j = 1, 2, …, m.
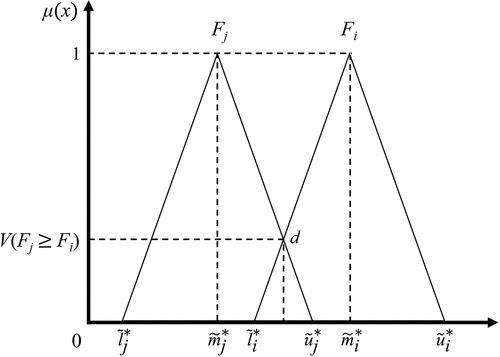
Step 3: The fuzzy synthetic extent value is calculated based on fuzzy multiplication and addition on and the inverse of the vector, as follows:
where Fj = (,
,
) refers to the fuzzy synthetic extent value of the jth decision criterion.
Step 4: The values of Fj are compared. The degree of possibility is thus identified by considering the ordinate of the highest intersection point (d) between the two fuzzy synthetic extent values. Hence, the degree possibility of Fi = (,
,
)
Fj = (
,
,
) depicted in is determined as follows (Rezaei et al., Citation2020):
Figure 4. Intersection between two fuzzy synthetic extent values.
Step 5: The priority vector is defined based on the degree of possibility of the convex fuzzy numbers. Let d΄(Cj) = min V(Fj Fi) be the minimum degree possibility of Fj over all the others, where j and i = 1, 2, … m; i
j. A weight vector (w΄) is thus formulated as follows:
w΄ = (d΄(C1), d΄(C2), …, d΄(Cj))T (19)
Step 6: The weights of attributes are calculated by normalizing the minimum-degree possibilities in the vector, as follows (Mahtani & Garg, Citation2018):
where wj as a non-fuzzy crisp number is the weight of the jth decision criterion.
Step 7: The decision-makers’ preferences are verified by consistency analysis. The middle values in the aggregated pairwise comparison matrix and related weights are checked by the consistency ratio (CR), which can be calculated as follows:
where CI and RI denote the consistency and random indices; CI = (λmax − m)/(m − 1); λmax denotes the average of weighted sum eigenvectors divided by the associated weights, and RI is acquired from . The CR must be less than or equal to the acceptable CR, which varies with the size of pairwise comparison matrices, i.e., 0.05 for a 3 by 3 matrix, 0.08 for a 4 by 4 matrix, and 0.10 for all larger matrices, whereas a 2 by 2 matrix is completely consistent. If the CR is failed to the threshold values, the pairwise comparison matrices are revised until the judgments are acceptable (Amenta et al., Citation2020).
Table 3. Random consistency index
4.3. Phase 3: Route selection
The goal of route selection is to find a compromise solution that responds productively to all decision-making elements simultaneously. The transportation cost, transportation time, risk magnitudes, and weights are synthesized together to identify the most appropriate multimodal transportation route using VIKOR. The details of this phase are as follows:
Step 1: Let xij be the real values for the ith route with respect to the jth decision criterion. The decision matrix (D) is created based on the number of criteria and the total number of routes, as follows:
where Ai and Cj refer to the ith route and the jth decision criterion; n is the number of routes; m is the number of decision criteria; i = 1, 2, …, n; j = 1, 2, …, m.
Step 2: The best and worst values of the decision criteria in each route are identified as follows (Agboola et al., Citation2020):
where and
are the best and worst values of the jth decision criterion.
Step 3: Group utility, individual regret, and VIKOR index values are calculated by the following relations (Zhou et al., Citation2020):
where Si,Ri, and πi are the group utility, individual regret, and VIKOR index values of the ith route; wj is the weight of the jth decision criterion; is the strategy of maximum group benefit significance, which is always assigned to be 0.50; S * = miniSi; S− = maxiSi; R* = miniRi; R− = maxiSi (Sennaroglu & Varlik Celebi, Citation2018).
Step 4: The VIKOR index values are sorted in ascending order. Therefore, the most appropriate multimodal route has the lowest π value. Assume that A(1) is the first rank based on the VIKOR index values on examining the two conditions as given below:
● Condition 1: The acceptable advantage is considered as follows: π(A(2)) − π(A(1)) ≥ 1/(n − 1), where A(1) and A(2) are the first and second ranks sorted by π value; π(A(1)) and π(A(2)) are π values for the first and second ranks.
● Condition 2: The acceptable stability in decision-making is investigated, where A(1) must be the first alternative according to the group utility and/or individual regret in ascending order.
A(1) is the most appropriate multimodal freight route when both the conditions are fulfilled. If one of the conditions is dissatisfied, a set of compromise solutions is provided by the following cases:
● Case 1: If condition 2 is not fulfilled, A(1) and A(2) are both compromise solutions.
● Case 2: If condition 1 is not fulfilled, A(1), A(2), …, A(i) are all compromise solutions in the case of π(A(i)) − π(A(1)) < 1/(n − 1), where A(i) is the ith position in the ranking (Kannan et al., Citation2021).
5. Empirical case study
To validate the proposed approach, a realistic multimodal route selection between an electronic manufacturing factory in Samut Sakhon, Thailand, and a distribution center in Nanning, China, is described. Presently, all products are delivered based on a 20-foot container by road transportation, whereas selected routes depend on the experience of drivers; the average transportation cost and time are 7,315 USD and 132 h, respectively. A policy of the chief executive officer to reduce transportation costs and increase logistics operation abilities exists. There are 24 feasible multimodal freight routes. The multimodal transport cost-model was applied to approximate transportation cost and time of each route as shown in .
Table 4. Details of each route
The decision criteria for freight route selection are classified into quantitative and qualitative criteria. Quantitative decision criteria are generally quantified using numbers and measurable information that can be transformed into usable statistics. This type of criteria includes transportation cost and time. Qualitative decision criteria concern the understanding of underlying reasons, opinions, beliefs, and motivations that are essentially transformed into quantitative data. Thus, the risks in multimodal routes can be viewed as qualitative elements. The details of each decision criterion are given below (Gul et al., Citation2019; Guo et al., Citation2020; Kengpol & Tuammee, Citation2016; Koohathongsumrit & Meethom, Citation2021b; Meethom & Koohathongsumrit, Citation2018):
● Transportation cost (C1) refers to the summation of all direct and indirect costs incurred to transport goods from sources to end consumers. All expenditures consist of ports, demurrage, terminal, loading/unloading, fuel, insurance, in-transit inventories, and backhaul costs, including freight rates, detention fees, and shipping surcharges.
● Transportation time (C2) refers to the planned travel time for shipment from the point of departure to the final destination. The time includes the transfer time between transport modes, border crossing, transit, loading/unloading, customs clearance, personal, and dwell time.
● Freight damage risk (C3) refers to scratches, damage, loss, breakage, and destruction of products, including contamination, humidity, infestation, and wet occurrence during mode shifting, stowage, and shipment.
● Operation risk (C4) refers to a threat that relates to failed logistics tasks, inadequate shipping document details, failure to meet terms of the contract, malpractices, labor ineffectiveness, internal fraud, inefficiency of security checks, and availability of equipment, which combines traffic accidents such as crash, collision, sinking, and derailment.
● Infrastructure risk (C5) refers to an unexpected event resulting from physical characteristics along routes, such as types of rails, gauge width, track capacity, number of terminals, and road conditions (e.g., vertical clearances of tunnels, shoulder width, number of lanes, road surfaces), track defects, watersheds, and thalwegs, including material handling systems and ground facilities.
● Economy risk (C6) refers to bankruptcy, financial crisis, global trade slump, unemployment/underemployment rate, territorial disputes, oil prices, fiscal crises, inflation, deflation, tight money including changes in taxes, interest rates, import-export duties, and exchange rates.
● Legality and policy risks (C7) are unpredictable and negative events related to government regulations, laws, trade agreements, traffic rules, claims for unjust enrichment, litigation, military control, political stability, protests, insurgence, and coups.
● Environment risk (C8) refers to actual or potential threats caused by earthquakes, landslides, avalanches, floods, droughts, storms, cyclones, wave surges, and diseases including epidemics effluent, emissions, waste, resource depletion, and pollution.
To avoid conflicts of interest, biased responses to questions, and personal relationships with other people or organizations, the decision-makers were selected from various organizations; the decision-makers participated in the risk and weight calculations. There were four decision-makers with at least 10 years of experience; the first decision-maker (DM1) was a professor in an academic institution, which differs from the authors’ affiliations; the second decision-maker (DM2) was a senior advisor in the logistics service industry, whereas the remaining decision-makers (DM3 and DM4) were managers in state-owned enterprises. In the first phase, an expert interview was performed with one-to-one correspondence and face-to-face contact to support the decision-makers, who comfortably assessed the likelihood and severity of risks. Decision-makers must answer questions using linguistic variables for probability and consequence. Before starting the interview, we clarified the definitions of linguistic variables of probability and consequence and interviewed them for approximately 30–50 min. Some sample questions were often asked as follows:
● What is the likelihood of the freight damage risk of transporting goods through this route?
● How likely will the environmental risk occur in this route? How severe is its impact?
● What is the degree of likelihood and severity of the infrastructure risk in this route?
● What is the likelihood that the economic risk occurs in this route? What about its consequences?
● What is the probability of the environmental risk occurring in this route? What negative impact will result if the risk actually occurs?
● Is it likely that this operational risk will occur in this route? What are the chances of this risk occurring?
After interviewing the experts, the linguistic expressions of likelihood and severity are summarized in . For instance, the linguistic variables of likelihood and severity for C3 under A1 judged by DM1 were “Possible (P)” and “Very low (VL),” respectively.
Table 5. Linguistic variables for likelihood
Table 6. Linguistic variables for severity
Applying EquationEquations (11)(11)
(11) and (Equation12
(12)
(12) ), the individual linguistic variables of each criterion were transformed into independent trapezoidal fuzzy numbers, which were used to obtain all aggregated trapezoidal fuzzy numbers. For instance, the aggregated fuzzy numbers of likelihood and severity for C3 with respect to every route are shown in and the aggregated fuzzy numbers of likelihood and severity for A1 and C3 were computed as follows:
Table 7. Aggregated fuzzy numbers of likelihood and severity for the freight damage risk
= ((0.30, 0.40, 0.50, 0.60)
(0.30, 0.40, 0.50, 0.60)
(0.30, 0.40, 0.50, 0.60)
(0.30, 0.40, 0.50, 0.60))/4 = (0.30, 0.40, 0.50, 0.60)
= ((0.00, 0.10, 0.20, 0.30)
(0.30, 0.40, 0.50, 0.60)
(0.30, 0.40, 0.50, 0.60)
(0.10, 0.20, 0.30, 0.40))/4 = (0.18, 0.28, 0.38, 0.48)
Next, the aggregated fuzzy numbers were multiplied to indicate the fuzzy risk magnitudes based on Equation (15). For instance, the fuzzy risk magnitudes of C3 for all routes are illustrated in and the fuzzy risk magnitudes for A1 and C3 were computed as follows:
Table 8. Fuzzy risk magnitudes of the freight damage risk
= (0.30, 0.40, 0.50, 0.60)
(0.18, 0.28, 0.38, 0.48) = (0.05, 0.11, 0.19, 0.29)
Subsequently, reliable crisp risk magnitudes were calculated based on the concept of incenter of centroid method of EquationEquation (16)(16)
(16) . The risk magnitudes for all the decision criteria with respect to each route are illustrated in . For instance, the risk magnitude for A1 and C3 were calculated as below:
Table 9. Risk magnitudes
where α = ((4.69 − 3(2.75) + 2(7.13))2 + 12)1/2/6 = 1.79; β = (2(4.69) + 7.13 − 1.31 − 2(2.75))/3 = 3.23; and γ = ((3(4.69) − 2(1.31) − 2.75)2 + 12)1/2/6 = 1.46.
In the second phase, decision-makers compared the decision criteria based on the judgment of preference relations using linguistic variables of . An in-depth interview was conducted to elicit the preferences of the decision-makers. The goal of the interview and the meaning of the linguistic variables for importance assessment were described. Subsequently, the decision-makers were asked to evaluate the relative importance between the two decision criteria. Sample questions are as follows:
● How important is the transportation cost relative to the transportation time?
● For the freight damage and the economic risks, which of these is more important for multimodal transportation route selection? and how much more?
● What is the relative importance of the transportation time and the operation risk?
● What degree of importance did you assign to the transportation cost compared to the legality and policy risks?
After collecting the responses of all pairs in datasheets, fuzzy pairwise comparison matrices for each decision-maker were established. If the decision criterion in the rows is more important than those in the columns, the triangular fuzzy numbers transform the linguistic variables. Conversely, if the decision criterion in the rows is less important than those in the columns, reciprocal fuzzy numbers are applied. The fuzzy arithmetic mean aggregated the judgments of individual decision-makers to construct an aggregated fuzzy pairwise comparison as given below:
The fuzzy synthetic extent values for each decision criterion were obtained by applying EquationEquation (17)(17)
(17) , as follows: F1 = (0.08, 0.16, 0.28), F2 = (0.10, 0.18, 0.31), F3 = (0.10, 0.19, 0.34), F4 = (0.08, 0.13, 0.24), F5 = (0.05, 0.09, 0.15), F6 = (0.05, 0.10, 0.17), F7 = (0.06, 0.11, 0.21), and F8 = (0.03, 0.05, 0.10). According to EquationEquations (18)
(18)
(18) and (19), the fuzzy synthetic extent values were compared with the others to determine the minimum degrees of possibilities as follows:
d΄(C1) = min V(F1 F2, F3, F4, F5, F6, F7, F8) = (0.87, 0.85, 1.00, 1.00, 1.00, 1.00, 1.00) = 0.85
d΄(C2) = min V(F2 F1, F3, F4, F5, F6, F7, F8) = (1.00, 0.98, 1.00, 1.00, 1.00, 1.00, 1.00) = 0.98
d΄(C3) = min V(F3 F1, F2, F4, F5, F6, F7, F8) = (1.00, 1.00, 1.00, 1.00, 1.00, 1.00, 1.00) = 1.00
d΄(C4) = min V(F4 F1, F2, F3, F5, F6, F7, F8) = (0.86, 0.73, 0.72, 1.00, 1.00, 1.00, 1.00) = 0.72
d΄(C5) = min V(F5 F1, F2, F3, F4, F6, F7, F8) = (0.53, 0.38, 0.37, 0.64, 0.93, 0.81, 1.00) = 0.37
d΄(C6) = min V(F6 F1, F2, F3, F4, F5, F7, F8) = (0.61, 0.46, 0.45, 0.73, 1.00, 0.89, 1.00) = 0.45
d΄(C7) = min V(F7 F1, F2, F3, F4, F5, F6, F8) = (0.74, 0.60, 0.59, 0.87, 1.00, 1.00, 1.00) = 0.59
d΄(C8) = min V(F8 F1, F2, F3, F4, F5, F6, F7) = (0.17, 0.01, 0.02, 0.17, 0.57, 0.51, 0.40) = 0.01
The weight vector was given as follows: w΄ = (0.85, 0.98, 1.00, 0.72, 0.37, 0.45, 0.59, 0.01)T. The degrees of possibility in the weight vector were normalized to determine the final weights of each decision criterion as follows: w1 = 0.17, w2 = 0.19, w3 = 0.20, w4 = 0.14, w5 = 0.07, w6 = 0.09, w7 = 0.13, and w8 = 0.01. These weights were used to measure the consistency of the decision-makers’ judgments. By applying EquationEquation (21)(21)
(21) , we found that the weights and judgments were in agreement because the calculated CR of 0.03 was below the critical limit of 0.10.
Having obtained the transportation cost, transportation time, risk magnitudes, and weights, these elements were proceeded to select the most appropriate multimodal transportation route in the final phase. The decision matrix can be constructed as illustrated in .
Table 10. Decision matrix
Because all criteria are non-beneficial, EquationEquations (22)(22)
(22) and (Equation23
(23)
(23) ) were applied to determine the sets of the best and worst values as follows:
= (2543, 74, 0.66, 0.69, 0.44, 0.60, 0.48, 0.50) and
= (8666, 416, 3.15, 2.84, 2.37, 2.21, 4.09, 2.24). After that, the values of S *, S−, R*, and R− were determined as follows: S * = 0.18, S− = 0.56, R* = 0.06, and R− = 0.20. With regard to these values, the group utility, individual regret, and VIKOR index values were computed based on the concordance and discordance matrices, as illustrated in . For instance, the ranking indexes of A1 were calculated as follows:
Table 11. Values of group utility, individual regret, and VIKOR index
where ν = 0.50.
Consequently, multimodal freight routes were ranked as follows: A2 A14
A1
A10
A6
A4
A13
A7
A3
A17
A5
A24
A8
A9
A11
A22
A20
A21
A18
A19
A23
A16
A15
A12. The findings revealed that A2 has the minimum VIKOR index value and was assigned the top rank as the most appropriate alternative. Based on the above results, it is necessary to validate the ranks by examining the two conditions. As it is seen in Table , the results satisfy condition 1 of acceptable advantage, accounting for 0.177 − 0.043 = 0.134 ≥ 1/(24 − 1) = 0.043, and confirm condition 2 of acceptable stability in decision-making because A2 was ranked higher with the lowest value of group utility. Therefore, A2 was selected as the most appropriate route in this case. This route began at the factory by truck between the Samut Sakhon and Vinh railroad stations, passed through the Nakhon Phanom-Thakhek and Nam Phao-Cau Treo border crossings, and subsequently by rail to Dong Dang railroad station, and by truck to the distribution center passing by the Huu Nghi Quan-Youyiguan border crossing. Nevertheless, the final decision-making outcomes may be altered when one of the decision-making elements is either increased or decreased in future scenarios.
6. Sensitivity and comparative analyses
A sensitivity analysis was performed to demonstrate the reliability of the proposed approach. The nine scenarios were verified by altering the weights of the most important decision criteria from 0.10 to 0.90. The new ranks of each route were examined as shown in and . A2 was retained as the best choice, except for scenario 1. From the findings of the sensitivity analysis, it is clear that the proposed approach is flexible, robust, and unaffected by variations in weights
Figure 5. Sensitivity analysis result.
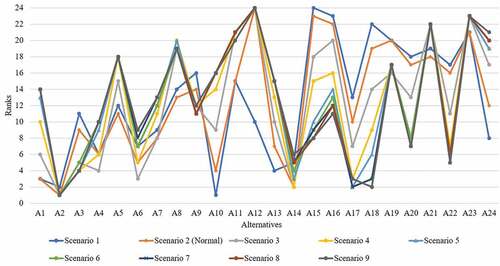
Table 12. Ranking of sensitivity analysis
The proposed approach was compared with other existing techniques. To achieve this, the same problem and input data were investigated using two related approaches: the risk assessment-AHP-TOPSIS and risk assessment-AHP-VIKOR approaches. Herein, the linguistic variables in were converted into crisp assessment scales. The modified risk levels were subsequently computed by multiplying the crisp scales of likelihood and severity, while the mid-values of the aggregated fuzzy number in the aggregated pairwise comparison matrix were used to calculate modified weights based on the conventional AHP. All the modified input data were optimized by either TOPSIS or VIKOR, and the new rankings of each route were defined and compared with the original ranks in the normal scenario, as shown in and .
Figure 6. Comparative analysis result.
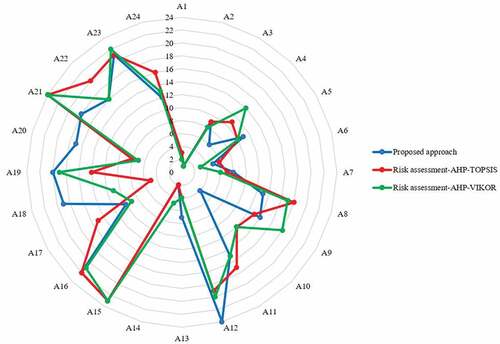
Table 13. Ranking of comparative analysis
The above results reveal that the proposed approach is evidently more efficient than the others. Although the most appropriate route did not change, other routes interchanged their positions. A2 ranked the top for all methods because this choice was dominant over the remaining options. However, the proposed approach yielded more satisfactory results than those when considering the top five routes; it provided a set of compromise alternatives with cheaper transportation costs and lower risk magnitude on average. Based on the comparative findings, it can be concluded that the proposed approach better distinguishes between alternatives and is more suitable for solving freight route selection problems than other existing techniques.
7. Discussion
The results indicated that regardless of the changes in the situations of decision-making attributes, the proposed approach does not respond to one of the decision-making elements but attempts to compromise all of them at once. Evidently, although the most optimal alternative does not have the following properties: the cheapest transportation cost, shortest transportation time, and lowest average risk magnitudes, it is the best compromise solution among numerous routes versus conflicting decision criteria under different optimal conditions. The obtained results are also consistent with decision-makers’ needs, for example, if the weight of transportation cost is high, routes with low transportation costs are preferred to the others. However, if the weight of transportation time is high, alternatives with low transportation times will be ranked as the top choice. Similarly, the final results are robust in dynamic decision-making processes because they are insensitive to the changes in the relative weights. Moreover, the proposed approach leads to transportation costs and time savings, including a risk reduction. As seen from the results, the most optimal route can result in up to 2,081 USD and 7 h reductions in cost and time compared with the cost and time being used presently. In this regard, the decreases in cost and time account for 28.45% and 5.30%, respectively. The best choice provides the lowest average risk magnitude of 0.86, which is approximately 42% lower than the grand average of the risk magnitudes.
The implications of the results provide new insights into the integration of MCDM approaches and fuzzy risk assessment that can defuzzify fuzzy risk levels into reliable crisp risk values based on the incenter of centroid method, determine the weights of attributes, and make the best trade-off among decision-making elements in solving freight route selection problems. This collaboration has practical implications for the application of the proposed approach. Decision-makers and transportation policy-makers have a better understanding of transportation decision-making problems and use the proposed methodology to select the most appropriate multimodal transportation route that simultaneously maximizes the beneficial decision criteria and minimizes the non-beneficial ones with consistent preferences in a proper manner; they can design interactive and comprehensive freight distribution systems based on available resources: budget, preferred time, and/or acceptable risk levels. In addition, the results benefit the optimization tools and algorithms provided in the vehicle routing problems. The proposed ideas can measure risk levels, prioritize decision criteria, and identify the best compromise path from one point to another, without returning to the origin. For example, products are delivered from a source to multiple destinations or terminus nodes in a single cycle under capacity limitations, time constraints, and/or various conditions. This study aids decision-makers in selecting the path between multiple pairs of nodes connected to origin–destination points in multimodal transportation networks.
8. Conclusion
The route selection in multimodal supply chains can be viewed as an MCDM problem and is becoming a more complex multi-dimensional task due to involvements of various conflicting decision criteria, different preferences, and qualitative risk factors. In this study, a novel hybrid approach was first developed to solve the multimodal route selection problem. The proposed approach can be divided into three significant phases. At the first phase, the fuzzy risk assessment-based incenter of centroid method was applied to handle risk events based on linguistic variables as well as trapezoidal fuzzy numbers for likelihood and severity. At the second phase, the fuzzy AHP with Chang’s extent analysis method was performed to reflect various patterns of preferences in the human thinking style. At the final phase, VIKOR model was utilized to optimize the problem. Finally, the usefulness and practicability of the proposed approach were exhibited through the empirical multimodal route selection between Thailand and China.
The proposed methodology completely answers the research question by providing a new decision support model that can reliably assess disruptions along freight corridors, prioritize decision criteria, and compromise all decision-making elements for selecting the most appropriate route in multimodal transportation networks. The proposed approach has many advantages over its rival methods, as follows: (1) it logically computes more reliable risk magnitudes based on the balancing points of two triangles and one rectangle formed by the rhombuses of fuzzy risk magnitudes; (2) it can elicit the priorities of decision criteria through the fuzzy pairwise comparison matrix with the concept of possibility extent and consistent responses; (3) it straightforwardly provides a satisfactory trade-off among the transportation cost, transportation time, weights, and risk magnitudes for selecting the most optimal multimodal transportation route; and (4) the main mechanisms of each phase are extremely simple and uncomplicated, helping decision-makers to better understand the resolution to the freight route selection problems. Therefore, the proposed approach is highly objective, accurate, and practical in optimizing the multimodal transportation route selection in real-life scenarios.
The major contributions of this study are threefold. First, a new defuzzification-based incenter of centroid method was developed to calculate more reliable risk magnitudes of fuzzy risk analysis. Second, easier weight calculation processes based on the extent analysis of fuzzy AHP were applied for more flexibility in computing the priority values of all criteria. Finally, a novel integration of the fuzzy risk assessment-based incenter of centroid method, fuzzy AHP, and VIKOR was established, serving as a new hybrid MCDM approach that systematically compromises all decision-making elements for route selection in multimodal transportation networks. Nonetheless, like in any other work, this study has the following limitations. The suggested fuzzy risk calculation can only be run with triangular and trapezoidal forms. The proposed approach cannot analyze interdependencies among decision-making attributes, which are structured as networks of clusters. Another limitation is that the proposed approach cannot be used for transportation from one origin to two or more consignees at different locations. These limitations provide a useful outlook for future research. The defuzzifier-based incenter of centroid method should be upgraded to other types of fuzzy numbers. The analytic network process can enhance the weighting of decision-making attributes by evaluating the interactions within and between clusters of criteria. Likewise, the idea of this study can be installed in vehicle routing models and optimization algorithms for solving large-scale logistic problems.
Disclosure statement
No potential conflict of interest was reported by the author(s).
Additional information
Notes on contributors

Nitidetch Koohathongsumrit
Nitidetch Koohathongsumrit received Ph.D. and M.Eng. degrees in Industrial Engineering and obtained B.Sc. degree in Applied Statistics. He is currently an assistant professor of industrial engineering in the Department of Statistics at Ramkhamhaeng University. His research interests are multiple attribute decision-making, fuzzy logic, expert systems, operations research, supply chain modelling, sustainable transportation, risk analysis in logistics system planning, and dynamic optimization under uncertainty.
Wasana Chankham
Wasana Chankham received M.Sc. and B.Sc. degrees in Applied Statistics. She is currently a lecturer in the Department of Statistics at Ramkhamhaeng University. Her research interests are applied statistics, advanced statistical analysis, confidence intervals, and linear models.
References
- Agboola, O. O., Akinnuli, B. O., Kareem, B., Akintunde, M. A., Pham, D., & Pham, D. (2020). Decision on the selection of the best height-diameter ratio for the optimal design of 13,000 m 3 oil storage tank. Cogent Engineering, 7(1), 1770913. https://doi.org/10.1080/23311916.2020.1770913
- Amenta, P., Lucadamo, A., & Marcarelli, G. (2020). On the transitivity and consistency approximated thresholds of some consistency indices for pairwise comparison matrices. Information Sciences, 507, 274–31. https://doi.org/10.1016/j.ins.2019.08.042
- Andrić, J. M., & Lu, D.-G. (2017). Fuzzy probabilistic seismic hazard analysis with applications to Kunming city, China. Natural Hazards, 89(3), 1031–1057. https://doi.org/10.1007/s11069-017-3007-z
- Biswas, T. K., & Zaman, K. (2019). A fuzzy-based risk assessment methodology for construction projects under epistemic uncertainty. International Journal of Fuzzy Systems, 21(4), 1221–1240. https://doi.org/10.1007/s40815-018-00602-w
- Büyüközkan, G., & Tüfekçi, G. (2021). A decision-making framework for evaluating appropriate business blockchain platforms using multiple preference formats and VIKOR. Information Sciences, 571, 337–357. https://doi.org/10.1016/j.ins.2021.04.044
- Chang, D.-Y. (1996). Applications of the extent analysis method on fuzzy AHP. European Journal of Operational Research, 95(3), 649–655. https://doi.org/10.1016/0377-2217(95)00300-2
- Chu, T.-C., & Nguyen, H. T. (2019). Ranking alternatives with relative maximizing and minimizing sets in a fuzzy MCDM Model. International Journal of Fuzzy Systems, 21(4), 1170–1186. https://doi.org/10.1007/s40815-019-00637-7
- Daniyan, I., Mpofu, K., Ramatsetse, B., Peng, T., & Peng, T. (2020). The use of analytical hierarchy process (AHP) decision model for materials and assembly method selection during railcar development. Cogent Engineering, 7(1), 1833433. https://doi.org/10.1080/23311916.2020.1833433
- Demirel, H., Şener, B., Yildiz, B., & Balin, A. (2020). A real case study on the selection of suitable roll stabilizer type for motor yachts using hybrid fuzzy AHP and VIKOR methodology. Ocean Engineering, 217, 108125. https://doi.org/10.1016/j.oceaneng.2020.108125
- Dev, S., Aherwar, A., & Patnaik, A. (2020). Material selection for automotive piston component using entropy-VIKOR method. Silicon, 12(1), 155–169. https://doi.org/10.1007/s12633-019-00110-y
- Gudiel Pineda, P. J., Liou, J. J. H., Hsu, -C.-C., & Chuang, Y.-C. (2018). An integrated MCDM model for improving airline operational and financial performance. Journal of Air Transport Management, 68, 103–117. https://doi.org/10.1016/j.jairtraman.2017.06.003
- Gul, M., & Ak, M. F. (2018). A comparative outline for quantifying risk ratings in occupational health and safety risk assessment. Journal of Cleaner Production, 196, 653–664. https://doi.org/10.1016/j.jclepro.2018.06.106
- Gul, M., Guneri, A. F., & Nasirli, S. M. (2019). A fuzzy-based model for risk assessment of routes in oil transportation. International Journal of Environmental Science and Technology, 16(8), 4671–4686. https://doi.org/10.1007/s13762-018-2078-z
- Guleria, A., & Bajaj, R. K. (2020). A robust decision making approach for hydrogen power plant site selection utilizing (R, S)-norm Pythagorean fuzzy information measures based on VIKOR and TOPSIS method. International Journal of Hydrogen Energy, 45(38), 18802–18816. https://doi.org/10.1016/j.ijhydene.2020.05.091
- Guo, J., Xu, J., Du, Q., & He, Z. (2020). Risk assessment on multimodal transport network based on quality function deployment. International Journal of Intelligent Systems, 36(3), 1408–1440. https://doi.org/10.1002/int.22348
- Hsieh, M.-Y., Hsu, Y.-C., & Lin, C.-T. (2018). Risk assessment in new software development projects at the front end: A fuzzy logic approach. Journal of Ambient Intelligence and Humanized Computing, 9(2), 295–305. https://doi.org/10.1007/s12652-016-0372-5
- Ignatius, J., Hatami-Marbini, A., Rahman, A., Dhamotharan, L., & Khoshnevis, P. (2018). A fuzzy decision support system for credit scoring. Neural Computing & Applications, 29(10), 921–937. https://doi.org/10.1007/s00521-016-2592-1
- Iphar, M., & Cukurluoz, A. K. (2020). Fuzzy risk assessment for mechanized underground coal mines in Turkey. International Journal of Occupational Safety and Ergonomics, 26(2), 256–271. https://doi.org/10.1080/10803548.2018.1426804
- Jain, N., & Singh, A. R. (2020). Sustainable supplier selection under must-be criteria through Fuzzy inference system. Journal of Cleaner Production, 248, 119275. https://doi.org/10.1016/j.jclepro.2019.119275
- Kaewfak, K., Huynh, V.-N., Ammarapala, V., & Ratisoontorn, N. (2020). A risk analysis based on a two-stage model of fuzzy AHP–DEA for multimodal freight transportation systems. IEEE Access, 8, 153756–153773. https://doi.org/10.1109/access.2020.3018669
- Kannan, D., Moazzeni, S., Darmian, S. M., & Afrasiabi, A. (2021). A hybrid approach based on MCDM methods and monte carlo simulation for sustainable evaluation of potential solar sites in east of Iran. Journal of Cleaner Production, 279, 122368. https://doi.org/10.1016/j.jclepro.2020.122368
- Karasan, A., Ilbahar, E., Cebi, S., & Kahraman, C. (2018). A new risk assessment approach: Safety and critical effect analysis (SCEA) and its extension with Pythagorean fuzzy sets. Safety Science, 108, 173–187. https://doi.org/10.1016/j.ssci.2018.04.031
- Kengpol, A., Tuammee, S., & Tuominen, M. (2014). The development of a framework for route selection in multimodal transportation. The International Journal of Logistics Management, 25(3), 581–610. https://doi.org/10.1108/IJLM-05-2013-0064
- Kengpol, A., & Tuammee, S. (2016). The development of a decision support framework for a quantitative risk assessment in multimodal green logistics: An empirical study. International Journal of Production Research, 54(4), 1020–1038. https://doi.org/10.1080/00207543.2015.1041570
- Keshavarz Ghorabaee, M., Amiri, M., Zavadskas, E. K., Hooshmand, R., & AntuchevičIenė, J. (2017). Fuzzy extension of the codas method for multi-criteria market segment evaluation. Journal of Business Economics and Management, 18(1), 1–19. https://doi.org/10.3846/16111699.2016.1278559
- Khan, A. A., Shameem, M., Kumar, R. R., Hussain, S., & Yan, X. (2019). Fuzzy AHP based prioritization and taxonomy of software process improvement success factors in global software development. Applied Soft Computing, 83, 105648. https://doi.org/10.1016/j.asoc.2019.105648
- Kiran, W. S., Smys, S., & Bindhu, V. (2020). Enhancement of network lifetime using fuzzy clustering and multidirectional routing for wireless sensor networks. Soft Computing, 24(15), 11805–11818. https://doi.org/10.1007/s00500-020-04900-0
- Koohathongsumrit, N., & Luangpaiboon, P. (2020). Multi-objective risk assessment management via Zero-one desirability programming model. Paper presented at the Proceedings of the 2020 The 6th International Conference on Frontiers of Educational Technologies. The Association for Computing Machinery.
- Koohathongsumrit, N., & Luangpaiboon, P. (2021). An integrated FAHP–ZODP approach for strategic marketing information system project selection. Managerial and Decision Economics. https://doi.org/10.1002/mde.3489
- Koohathongsumrit, N., & Meethom, W. (2021a). An integrated approach of fuzzy risk assessment model and data envelopment analysis for route selection in multimodal transportation networks. Expert Systems with Applications, 171, 114342. https://doi.org/10.1016/j.eswa.2020.114342
- Koohathongsumrit, N., & Meethom, W. (2021b). Route selection in multimodal transportation networks: A hybrid multiple criteria decision-making approach. Journal of Industrial and Production Engineering, 38(3), 171–185. https://doi.org/10.1080/21681015.2020.1871084
- Koohathongsumrit, N., & Meethom, W. (2022). A fuzzy decision-making framework for route selection in multimodal transportation networks. Engineering Management Journal, 1–16. https://doi.org/10.1080/10429247.2022.2027205
- Liang, X., & Meng, X. (2019). An extended FTOPSIS method for freeway route selection in the pre-feasibility study stage. Physica A: Statistical Mechanics and Its Applications, 526, 120871. https://doi.org/10.1016/j.physa.2019.04.107
- Lu, W., Choi, S.-B., & Yeo, G.-T. (2022). Resilient route selection of oversized cargo transport: The case of South Korea–Kazakhstan. The International Journal of Logistics Management, 33(2), 410–430. https://doi.org/10.1108/ijlm-11-2020-0445
- Mahapatra, D., Katiyar, R., Parida, R., & Kumar, D. (2020). A fuzzy multi-criteria approach for evaluating the contribution of freight transportation towards India’s Nationally Determined Contributions (NDCs). International Journal of Production Research, 59(9), 2857–2884. https://doi.org/10.1080/00207543.2020.1743891
- Mahtani, U. S., & Garg, C. P. (2018). An analysis of key factors of financial distress in airline companies in India using fuzzy AHP framework. Transportation Research Part A: Policy and Practice, 117, 87–102. https://doi.org/10.1016/j.tra.2018.08.016
- Malekpoor, H., Chalvatzis, K., Mishra, N., & Ramudhin, A. (2018). A hybrid approach of VIKOR and bi-objective integer linear programming for electrification planning in a disaster relief camp. Annals of Operations Research, 283(1–2), 443–469. https://doi.org/10.1007/s10479-018-2877-0
- Marhavilas, P. K., Filippidis, M., Koulinas, G. K., & Koulouriotis, D. E. (2020). An expanded HAZOP-study with fuzzy-AHP (XPA-HAZOP technique): Application in a sour crude-oil processing plant. Safety Science, 124, 104590. https://doi.org/10.1016/j.ssci.2019.104590
- Meethom, W., & Koohathongsumrit, N. (2018). Design of decision support system for road freight transportation routing using multilayer zero one goal programming. Engineering Journal, 22(6), 185–205. https://doi.org/10.4186/ej.2018.22.6.185
- Meethom, W., & Koohathongsumrit, N. (2020). A decision support system for road freight transportation route selection with new fuzzy numbers. Foresight, 22(4), 505–527. https://doi.org/10.1108/fs-10-2019-0090
- Mhaske, A. S., & Bondar, K. L. (2020). Fuzzy transportation problem by using triangular, pentagonal and heptagonal fuzzy numbers with Lagrange’s polynomial to approximate fuzzy cost for nonagon and hendecagon. International Journal of Fuzzy System Applications, 9(1), 112–129. https://doi.org/10.4018/ijfsa.2020010105
- Mina, H., Kannan, D., Gholami-Zanjani, S. M., & Biuki, M. (2021). Transition towards circular supplier selection in petrochemical industry: A hybrid approach to achieve sustainable development goals. Journal of Cleaner Production, 286, 125273. https://doi.org/10.1016/j.jclepro.2020.125273
- Mohammed, A., Harris, I., & Govindan, K. (2019). A hybrid MCDM-FMOO approach for sustainable supplier selection and order allocation. International Journal of Production Economics, 217, 171–184. https://doi.org/10.1016/j.ijpe.2019.02.003
- Moon, D.-S., Kim, D.-J., & Lee, E.-K. (2015). A study on competitiveness of sea transport by comparing international transport routes between Korea and EU. The Asian Journal of Shipping and Logistics, 31(1), 1–20. https://doi.org/10.1016/j.ajsl.2015.03.001
- Moreno-Cabezali, B. M., & Fernandez-Crehuet, J. M. (2020). Application of a fuzzy-logic based model for risk assessment in additive manufacturing R&D projects. Computers & Industrial Engineering, 145, 106529. https://doi.org/10.1016/j.cie.2020.106529
- Muneeswaran, G., Manoharan, P., Awoyera, P. O., & Adesina, A. (2020). A statistical approach to assess the schedule delays and risks in Indian construction industry. International Journal of Construction Management, 20(5), 450–461. https://doi.org/10.1080/15623599.2018.1484991
- Narayanamoorthy, S., Geetha, S., Rakkiyappan, R., & Joo, Y. H. (2019). Interval-valued intuitionistic hesitant fuzzy entropy based VIKOR method for industrial robots selection. Expert Systems with Applications, 121, 28–37. https://doi.org/10.1016/j.eswa.2018.12.015
- Ogundoyin, S. O., & Kamil, I. A. (2020). A fuzzy-AHP based prioritization of trust criteria in fog computing services. Applied Soft Computing, 97, 106789. https://doi.org/10.1016/j.asoc.2020.106789
- Opricovic, S. (1998). Multicriteria optimization of civil engineering systems. Faculty of Civil Engineering.
- Ponnialagan, D., Selvaraj, J., & Velu, L. G. N. (2018). A complete ranking of trapezoidal fuzzy numbers and its applications to multi-criteria decision making. Neural Computing & Applications, 30(11), 3303–3315. https://doi.org/10.1007/s00521-017-2898-7
- Rafieyan, E., Khorsand, R., & Ramezanpour, M. (2020). An adaptive scheduling approach based on integrated best-worst and VIKOR for cloud computing. Computers & Industrial Engineering, 140, 106272. https://doi.org/10.1016/j.cie.2020.106272
- Rajabi, F., Molaeifar, H., Jahangiri, M., Taheri, S., Banaee, S., & Farhadi, P. (2020). Occupational stressors among firefighters: Application of multi-criteria decision making (MCDM) techniques. Heliyon, 6(4), e03820. https://doi.org/10.1016/j.heliyon.2020.e03820
- Rezaei, A., Rahiminezhad Galankashi, M., Mansoorzadeh, S., & Mokhatab Rafiei, F. (2020). Supplier selection and order allocation with lean manufacturing criteria: An integrated MCDM and bi-objective modelling approach. Engineering Management Journal, 32(4), 253–271. https://doi.org/10.1080/10429247.2020.1753490
- Rudnik, K., & Kacprzak, D. (2017). Fuzzy TOPSIS method with ordered fuzzy numbers for flow control in a manufacturing system. Applied Soft Computing, 52, 1020–1041. https://doi.org/10.1016/j.asoc.2016.09.027
- Samantra, C., Datta, S., & Mahapatra, S. S. (2014). Risk assessment in IT outsourcing using fuzzy decision-making approach: An Indian perspective. Expert Systems with Applications, 41(8), 4010–4022. https://doi.org/10.1016/j.eswa.2013.12.024
- Sarraf, R., & McGuire, M. P. (2020). Integration and comparison of multi-criteria decision making methods in safe route planner. Expert Systems with Applications, 154, 113399. https://doi.org/10.1016/j.eswa.2020.113399
- Seiti, H., Hafezalkotob, A., Najafi, S. E., & Khalaj, M. (2019). Developing a novel risk-based MCDM approach based on D numbers and fuzzy information axiom and its applications in preventive maintenance planning. Applied Soft Computing, 82, 105559. https://doi.org/10.1016/j.asoc.2019.105559
- Sennaroglu, B., & Varlik Celebi, G. (2018). A military airport location selection by AHP integrated PROMETHEE and VIKOR methods. Transportation Research Part D: Transport and Environment, 59, 160–173. https://doi.org/10.1016/j.trd.2017.12.022
- Shah, D., & Chatterjee, S. (2020). An intelligent programmed genetic algorithm with advanced deterministic diversity creating operator using objective surface visualization. Evolutionary Intelligence, 13(4), 705–723. https://doi.org/10.1007/s12065-020-00385-w
- Singh, S. P., & Singh, P. (2018). A hybrid decision support model using axiomatic fuzzy set theory in AHP and TOPSIS for multicriteria route selection. Complex & Intelligent Systems, 4(2), 133–143. https://doi.org/10.1007/s40747-018-0067-y
- Sitorus, F., Cilliers, J. J., & Brito-Parada, P. R. (2019). Multi-criteria decision making for the choice problem in mining and mineral processing: Applications and trends. Expert Systems with Applications, 121, 393–417. https://doi.org/10.1016/j.eswa.2018.12.001
- Skorupski, J. (2016). The simulation-fuzzy method of assessing the risk of air traffic accidents using the fuzzy risk matrix. Safety Science, 88, 76–87. https://doi.org/10.1016/j.ssci.2016.04.025
- Tchendjou, G. T., Simeu, E., & Alhakim, R. (2018). Fuzzy logic based objective image quality assessment with FPGA implementation. Journal of Systems Architecture, 82, 24–36. https://doi.org/10.1016/j.sysarc.2017.12.002
- Tirkolaee, E. B., & Aydin, N. S. (2022). Integrated design of sustainable supply chain and transportation network using a fuzzy bi-level decision support system for perishable products. Expert Systems with Applications, 195, 116628. https://doi.org/10.1016/j.eswa.2022.116628
- Tirkolaee, E. B., Goli, A., Gutmen, S., Weber, G. W., & Szwedzka, K. (2022). A novel model for sustainable waste collection arc routing problem: Pareto-based algorithms. Annals of Operations Research, 1–26. https://doi.org/10.1007/s10479-021-04486-2
- Vilko, J., Ritala, P., & Hallikas, J. (2019). Risk management abilities in multimodal maritime supply chains: Visibility and control perspectives. Accident Analysis and Prevention, 123, 469–481. https://doi.org/10.1016/j.aap.2016.11.010
- Wang, Y., & Yeo, G.-T. (2018). Intermodal route selection for cargo transportation from Korea to Central Asia by adopting fuzzy Delphi and fuzzy ELECTRE I methods. Maritime Policy & Management, 45(1), 3–18. https://doi.org/10.1080/03088839.2017.1319581
- Wang, H., Zhang, Y.-M., & Yang, Z. (2019). A risk evaluation method to prioritize failure modes based on failure data and a combination of fuzzy sets theory and grey theory. Engineering Applications of Artificial Intelligence, 82, 216–225. https://doi.org/10.1016/j.engappai.2019.03.023
- Wang, W., Liu, X., Chen, X., & Qin, Y. (2019). Risk assessment based on hybrid FMEA framework by considering decision maker’s psychological behavior character. Computers & Industrial Engineering, 136, 516–527. https://doi.org/10.1016/j.cie.2019.07.051
- Wu, Y., Jia, W., Li, L., Song, Z., Xu, C., & Liu, F. (2019). Risk assessment of electric vehicle supply chain based on fuzzy synthetic evaluation. Energy, 182, 397–411. https://doi.org/10.1016/j.energy.2019.06.007
- Zadeh, L. A. (1965). Fuzzy sets. Information and Control, 8(3), 338–353. https://doi.org/10.1016/S0019-9958(65)90241-X
- Zhang, D., He, R., Li, S., Wang, Z., & Ma, X. (2017). A multimodal logistics service network design with time windows and environmental concerns. PLoS One, 12(9), e0185001. https://doi.org/10.1371/journal.pone.0185001
- Zhou, X., Zhang, R., Yang, K., Yang, C., & Huang, T. (2020). Using hybrid normalization technique and state transition algorithm to VIKOR method for influence maximization problem. Neurocomputing, 410, 41–50. https://doi.org/10.1016/j.neucom.2020.05.084
- Ziemba, P. (2018). NEAT F-PROMETHEE – A new fuzzy multiple criteria decision making method based on the adjustment of mapping trapezoidal fuzzy numbers. Expert Systems with Applications, 110, 363–380. https://doi.org/10.1016/j.eswa.2018.06.008