
 ?Mathematical formulae have been encoded as MathML and are displayed in this HTML version using MathJax in order to improve their display. Uncheck the box to turn MathJax off. This feature requires Javascript. Click on a formula to zoom.
Abstract
Wheat flour liquid waste (WF-LW) is a potential biomass that is chemically pre-treated before being enzymatically hydrolyzed to produce glucose-derived bioethanol. This study investigated the effects of pH on the pretreatment process and the subsequent hydrolysis of WF-LW in the presence of amylase (AE) and maltose enzymes (ME). In the experiment, WF-LW at varying volumes from 200 to 1000 mL was treated with 5 to 25 mL of HCl and stirred for 30 minutes and at the temperature of 40°C. Impurities were removed prior to hydrolysis. Following that, a hydrolysis with an AE of 11% w/v and ME of 9% w/v resulted in a glucose content of 24.9% v/v. Moreover, 0.859 mL of HCl was added to achieve the best results, which were then optimized using SRM (surface response methodology) at a pH of 8.85 in a WF-LW volume of 1165.69 mL. The optimization of the pH and fermentation process in the presence of amylase and maltase enzymes resulted in increased glucose production and a decrease in the LW-TW treatment volume, which was 651.426 mL. These discoveries would become an appropriate approach for the subsequent fermentation process, resulting in the highest glucose levels possible.
1. Introduction
Bioethanol production from corn and sugarcane feedstocks has attracted considerable interest due to the potential for converting biomass content into biofuels. In terms of energy supplies, biomass or bioenergy is presently the fourth-largest energy source in the world, making it a viable alternative to fossil fuel-based energy sources (Selvakumar et al., Citation2022). Accordingly, biofuels derived from biomass have the potential to be a viable foundation for sustainable energy to meet the world’s ethanol raw material needs (Sarkar et al., Citation2006; Teymouri et al., Citation2005). However, the development of biofuels derived primarily from food crops raises issues concerning environmental conservation, in addition to the inherent conflict with food production, the large fertilizer and water requirements, the scarcity of modern agricultural practices in developing economies, and issues concerning environmental conservation (Selvakumar et al., Citation2022). On the other hand, environmental concerns about greenhouse gas emissions from the use of fossil fuels have caused fuel prices to rise. Therefore, the recent price disparity in the oil market has prompted extensive research into the production of lignocellulose-based biofuels. Moreover, significant efforts have been made in this field to efficiently convert lignocellulose into a value-added biofuel, namely cellulosic ethanol, via sugar fermentation (Kuhad et al., Citation2010; Limayem & Ricke, Citation2012, Nibedita et al., Citation2012; Teymouri et al., Citation2005; Sarkar et al., Citation2006).
Alternatively, the abundance of agricultural waste is a potential raw material for converting lignocellulosic biomass into glucose-derived bioethanol, which has both energy and environmental benefits. Reusing agricultural wastes for bioethanol production, in particular, may reduce competition between food and biofuels (Selvakumar et al., Citation2022). As a result, the land use pattern and efficiency of land use would be altered, requiring more complex processing machinery, higher production costs, and larger-scale facilities, limiting their ecological and financial viability. Instead, pretreatment, hydrolysis, and fermentation stages are primarily required for bioethanol production from lignocellulosic biomass to improve yield (Selvakumar et al., Citation2022, Citation2019). This biomass fermentation process has the potential to generate glucose, xylose, and bioethanol (Sarkar et al., Citation2006). Sago waste processing for bioethanol production yielded 47% v/v glucose and 15.6% v/v ethanol (Thangavelu et al., Citation2014). The presence of disaccharides and maltose during enzyme hydrolysis reactions to produce glucose may influence the starch’s low ethanol concentration in this case (Karimi et al., Citation2006).
Another potential source of bioethanol is rice flour liquid waste, which can be hydrolyzed with bacillus microbes to produce 5–10% glucose. Particularly, Saccharomyces Cerevisiae fermentation produced 11–16% bioethanol (Sari, Sutiyono et al., Citation2016), whereas Saccharomyces Cerevisiae and Zymomonas mobilis fermentation produced 10–15% bioethanol (Sari & Ernawati, Citation2019). A batch distillation system, in particular, produced 36% v/v bioethanol (Sari, Sutiyono et al., Citation2016).
Instead of sago waste processing, pretreatment of purple sago with nitric acid (HNO3) produced ethanol-derived cellulose, whereas delignification was used to remove the lignin content. Prior to fermentation, this process is required to reduce the lignocellulosic fraction and obtain suitable cellulose biomass (Kuhad et al., Citation2010). In contrast, the microwave hydrothermal Sago pulp hydrolysis process may generate ethanol through carbon dioxide removal (Thangavelu et al., Citation2014). The hydrothermal method, in particular, consumes less energy than the fermentation process without enzymes. In the absence of acids or catalysts, the hydrolysis of sago pulp, including pretreatment and distillation, can produce 15.6% ethanol (Balat et al., Citation2008). Furthermore, AFEX-optimized enzymatic hydrolysis and thermochemical pretreatment methods have resulted in higher ethanol levels (Teymouri et al., Citation2005). Using ethanol purification, batch, and flash distillation techniques, bioethanol-derived cellulose yielded nearly 95–96% v/v bioethanol (Sari & Dira, Citation2018).
Several studies have recently been conducted for bioethanol production by acid pretreatment of waste feedstock optimization using sulfuric acid hydrolysis (Dubey et al., Citation2012). For lignocellulosic biomass pretreatment, the use of sulfuric (H2SO4) and phosphoric (H3PO4) acids provided an environmentally friendly and relatively inexpensive method of hydrolyzing lignocellulose. However, the acid effects are insignificant in the production of bioethanol. Hydrochloric acid (HCl) treatment, on the other hand, is preferable for easy recovery but is more volatile and aggressive than H2SO4 (Demirbas & Demirbas, Citation2008). Furthermore, nitric acid (HNO3) converted cellulose to sugar faster than sulfuric acid (Tutt et al., Citation2012), but it is more expensive. In this case, lignocellulosic pretreatment is advantageous because it provides a technical and cost-effective means of ensuring cellulosic ethanol’s environmental sustainability.
Despite the environmental benefits of cellulosic ethanol production, the economic viability of lignocellulosic pretreatment has become a major concern, necessitating significant technological advances in the development of effective and low-cost enzymes, feedstocks, and efficient process design. To improve carbohydrate preservation and reduce the formation of degradation products, depth knowledge with chemical pretreatment methods is required. The primary considerations for the process are maximizing sugar yield under mild reaction conditions while minimizing solvent load, enzyme requirements, and waste accumulation (Bensah & Mensah, Citation2013). The development of AE and ME cultures, in particular, may take a long time; in this way the growth rates of AE and ME remain low. As a result, use of more effective and efficient AE and ME cultivation techniques is essential. Previous studies (Sarkar et al., Citation2006; Thangavelu et al., Citation2014; Karimi et al., Citation2006) investigated how the presence of disaccharides and maltose during the enzyme hydrolysis reaction to produce glucose affected the low concentration of starch ethanol.
This study used the starch content of liquid tapioca flour waste as a feedstock to be chemically pre-treated and then hydrolyzed to produce glucose. For optimal results, each pretreatment method was performed on the same feedstock, while enzymatic hydrolysis and fermentation with the same enzymes, namely maltase or amylase, were used. The method would be the most effective way for converting wheat flour liquid waste into biofuel with a high bioethanol content. As a result, the SRM (surface response methodology) method was used to solve the associated difficulties encountered during the processing of WF-LW hydrolysis at 40°C, as well as the varying volume between experiments and optimization. The initial pretreatment process with HCl was conducted to remove impurities and harmful byproducts in WF-LW, whereas the hydrolysis process with AE and ME with certain variables was performed to obtain optimal glucose as raw material for bioethanol production.
In this current study, the SRM method was used to optimize pH values with HCl during the WF-LW pretreatment process. The use of HCl in bioethanol hydrolysis revealed that the fewer H+ groups there are in HCl, the more reactive the hydrolysis reaction. However, sulfuric acid (H2SO4) was not used for hydrolysis, because of having two H+ groups and needing a longer reaction time. The study’s findings would allow for the commercialization and standardization of the quality and production process of WF-LW hydrolysis using improved low-cost techniques currently used by small industrial groups such as restaurants and large industries, particularly in Surabaya (East Java, Indonesia), such as PT. Indofood Sukses Makmur, Tbk. Accordingly, indigenous culture AE and ME cultivation in Indonesia is recommended for the potential development of WF-LW as bioethanol.
2. Background theory
2.1. Enzymatic hydrolysis and fermentation
The structure of starch is more complex than that of disaccharides. As a result, the fermentation process necessitates the use of AE (Amylase Enzyme), which is abundant in germinated wheat. Following that, maltose is hydrolyzed to glucose, as shown in [EquationEq. 1(1)
(1) and EquationEq. 2]
(2)
(2) :
Here, the amount of starch in the raw material, the pH, the acid concentration used, the hydrolysis time, and temperature, as well as the catalyst, all have an impact on the hydrolysis process (Kumar et al., Citation2009; Sari & Dira, Citation2018). Meanwhile, the type of microbe used in bioethanol production affects the fermentation process. During this process, only 3–18% alcohol can be obtained, whereas after distillation, up to 29 and 50% alcohol can be obtained (Dubey et al., Citation2012; Limayem & Ricke, Citation2012). Furthermore, fermentation may result in a dilute alcohol solution, whereas yeast cells may die if the ethanol content exceeds 12–15%. As a result, the following reaction (EquationEq. 3)(3)
(3) produces 51.1% ethanol and 48.9% carbon dioxide:
Furthermore, the required temperature and humidity are 40°C and 43–45%, respectively. The ideal alcoholic fermentation process may yield 48.8% ethyl alcohol, 46.6% carbon dioxide, 3.3% glycerol, 0.6% succinic acid, and 1.2% cellulose, respectively (Kuhad et al., Citation2010; Nibedita et al., Citation2012). Another factor is a pH in the range of 4–5, which aids in the production of enough lactic acid for yeast growth. The fermentation process in the pH ranges from 6.3 to 7.7 may produce good glucose levels, whereas butyric acid bacteria have a negative impact (Demirbas & Demirbas, Citation2008; Sari et al., Citation2017). Moreover, time, temperature, and sugar concentration all have an impact on the fermentation process. Hence, the optimal time should be between 36 and 50 hours, and the ideal temperature should be between 25 and 30°C.
2.2. Optimization of bioethanol production
The glucose-derived bioethanol level in the WF-LW solution was optimized using Surface Response Methodology (SRM), which generates a mathematical model that correlates to a Y-response based on X-free variables. The function presenting the Y-response and X–variables can be expressed as follows [EquationEq. 4](4)
(4) :
Where Y is the response variable, f (X1, X2, Xk) is an X-variable function, and ε represents an error. SRM can generate a function of the first-order polynomial equation relating the Y-response and the X-factor, written as [EquationEq.5](5)
(5) :
Meanwhile, a second-order model of function for a polynomial equation of the second-order can be expressed as [EquationEq.6](6)
(6) .
SRM was used to examine glucose levels by optimizing pH during the pretreatment process. X-variables such as WF-LW volume and HCl concentration were determined in this manner, while stirring time was fixed during the pretreatment (Duan et al., Citation2019; Nathan et al., Citation2019; Sari et al., Citation2020; Wang et al., Citation2017). Alternatively, a traditional WSRM (Wavelength Shift of the Resonant Mode) method for fluid characterization based on RNPs (Resonant Nano-Pillars) transducer signals was used, which could be simplified using PCA (Principal Component Analysis). Later, using regression algorithms from the ML (Machine Learning) field, the feature of interest can be inferred (Sergio et al., Citation2019). After that, Matlab was used to numerically validate the control variables in the optimal control model (Muhammad et al., Citation2021). A simulation study was used to evaluate the linear representation of PDF and the model’s performance under various estimation methods (Anum et al., Citation2021).
3. Materials and methods
3.1. Pretreatment for WF-LW and enzymatic hydrolysis
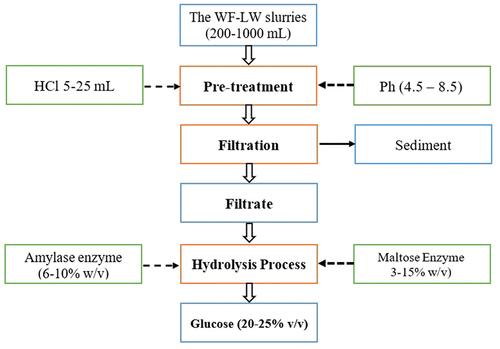
The stages of pretreatment and hydrolysis methods for WF-LW are depicted in . The pretreatment was carried out in varying volumes ranging from 200 to 1000 mL, along with HCl 5–25 mL, and then stirred for 30 minutes using a digital magnetic stirrer (MS-20D type), while the pH was set up at values ranging from 4.5 to 8.5. The filtrate (liquid) was hydrolyzed at 40°C with AE of 12% w/v and ME (Maltose Enzyme) of 9% w/v, while the sediments (solid) were separated from the liquid waste and processed into solid fertilizer. As a raw material for bioethanol products, this hydrolysis process produced glucose levels ranging from 20 to 25% v/v. Minitab software was then used to optimize pH values in the range of 7 to 8 during the SRM process.
Figure 1. Pretreatment process and hydrolysis process of the wheat flour liquid waste.
4. Results and discussion
4.1. Enzymatic hydrolysis for pretreatment of WF-LW
Pretreatment with 5–25 mL of HCl added to 200–1000 mL of WF-LW produced pH values ranging from 4.5 to 7.6. (). The results showed that increasing the HCL concentration in 200 mL WF-LW and the pH and using varying concentrations of AE and ME elevated the glucose levels. However, decreasing the pH with higher volumes of HCl up to 25 mL led to a reduction in glucose levels. Similarly, hydrolysis with subsequent volumes of 400–1000 mL blended with any concentration of HCl at any pH yielded glucose levels ranging from 17 to 24.9% v/v with AE of 6–12% w/v and ME of 3–15% w/v. This glucose level was higher than the values obtained in previous studies from hydrolysis using Bacillus, ranging from 3 to 9% v/v (Sari, Sutiyono et al., Citation2016).
Table 1. Varying pH and glucose level values produced from pretreatment of WF-LW with HCl, with AE and ME level addition
During the experiment, changes in the pH of distilled water (substrate) were observed in each process (). Apparently, dissolving distilled water in WF-LW produced an initial pH of 10, which fluctuated between 4.5 and 8.5 when HCl was added to the mix solution. Adding 5 mL-HCl to 200–1000 mL of WF-LW resulted in pH values ranging from 7.5 to 8.5. The pH of the mixed solution ranged from 4.5 to 6.5 when 25 mL of HCl was added, indicating that the higher the concentration of HCl used to make the solution, the lower the pH. A small amount of powdered activated charcoal may result in a lower final pH during the bleaching and filtration processes, allowing environmental contamination.
The pH of WF-LW had an effect on glucose levels during subsequent hydrolysis. Here, pH values ranging from 4.5 to 7.5 were optimized to 7.6 in the case of WF-LW volumes ranging from 200 to 600 mL. As a result, hydrolysis can be used as a basic enzymatic process to convert starch into more superficial glucose structures. The gelatinization, liquefaction, and saccharification stages of the starch hydrolysis process are all carried out by heating in a water bath. Enzymatic hydrolysis uses enzymes to break down starch into simpler constituent parts such as dextrin, isomaltose, and glucose.
Before hydrolyzing the starch with enzymes, the cassava must be gelatinized. According to Sari et al. (Citation2016), the gelatinized process for wheat flour takes place at temperatures ranging from 52 to 64°C. When the temperature of the substrate solution reached approximately 50°C or it began to coagulate, this process may be repeated. Because a coagulated substrate solution is frequently produced during an intense liquefaction process, the temperature was kept low to keep the substrate solution liquid. Furthermore, adding enzymes did not result in an optimal change in starch structure, while lower gelatinization temperatures limited the starch swelling process due to the low amount of water absorbed, namely 30%.
For varying volumes of WF-LW, the error bars were 0.918 at pH 7.7 (1000 mL) and 1.341 at pH 6.3 (200 mL), respectively (). shows that there was no difference between pH values of 5 and 6.5. The highest glucose level, 24.9% v/v, was associated with a pH value of 7.1, while pH of 5.5 was obtained during the pretreatment process. The optimal pH for the glucoamylase enzyme ranges from 4 to 5, according to (Tutt et al., Citation2012), whereas (Sari, Sutiyono et al., Citation2016) and (Dubey et al., Citation2012) stated that the optimum pH for glucoamylase enzyme activity reached 4.5.
Figure 2. pH changes of solutions using varying WF-LW volumes. Notes: pH values and their errors are presented in the box.
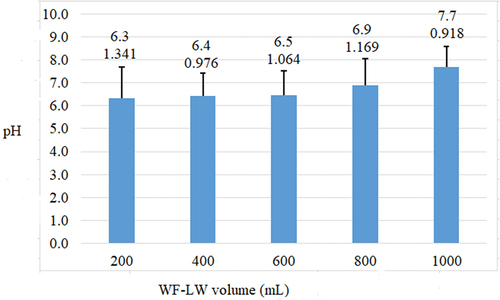
With the smallest error bar of 0.918 at pH 7.7, the experiment using 1000 ml of WF-LW and 5–25 mL HCl volume provided a yield of 91.8%, which meets the superior value of 80–100% according to SRM. This yield was more significant than those obtained at 200 mL, 400 mL, and 800 mL volumes. WF-LW had a close yield of 97.6% at a volume of 600 mL, but a pH of 6.4 was lower than average, namely 7. According to the optimization results, the best pH for hydrolysis is 8.85. Hence, the error bar of 0.918 and pH 7.7 affected bioethanol yield.
The volume of 200 mL and the addition of 5–25 mL HCL produced an average pH of 6.3 and an error bar of 1.341 during the hydrolysis, while the use of higher volumes between 400 and 1000 mL increased the average pH causing a fluctuation from 0.976 to 1.169. Based on optimization theory using SRM, error bars that meet the requirements range from 80% to 100% or 0.8–1.0. Hence, the average pH and the best error bars, namely 7.7 and 0.918, were selected to obtain optimal glucose and bioethanol results ().
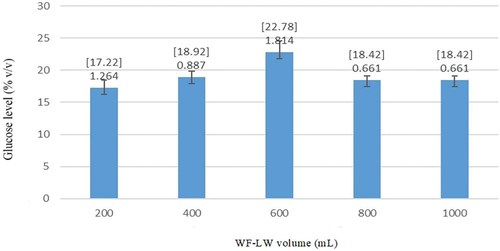
shows the average glucose levels generated from the experiments at varying volumes of WF-LW. The high glucose level was extracted from a volume of 600 mL, while the low level was obtained from 200 mL. This condition might be related to the activity of the enzyme and the pH of the solution.
Figure 3. Average glucose level obtained from pretreatment of WF-LW. Noted: numbers in the bracket represent average values along with their errors.
4.2. Optimized pH changes in the hydrolysis process
The effects of the WF-LW (X1) and HCl volume (X2) variables for the pretreatment process in a stirred tank on pH and yield responses were investigated. SRM determined the significance of the parameter regression coefficients. show plots of the response variables against selected X1 and X2 parameters in waste treatment. For optimum pH values of 8.85, 1165.69 mL of WF-LW, and 0.857 mL of HCl, the negative linear and quadratic effects of X1 and X2 on pH with Composite Desirability = 1 were very significant. In contrast, linear interactive results were found to be less critical. The optimized pH target of 8.5 in indicates that the SRM approach slightly increased the pH required for hydrolysis of WF-LW in an optimum volume of 1165.69 mL and the addition of 0.857864 mL HCL. Changes in pH solutions were then examined using the regression analysis [EquationEq. 7(7)
(7) and EquationEq. 8]
(8)
(8) :
Figure 4. The volume of WF-LW (mL) versus HCl volume influencing pH solution.
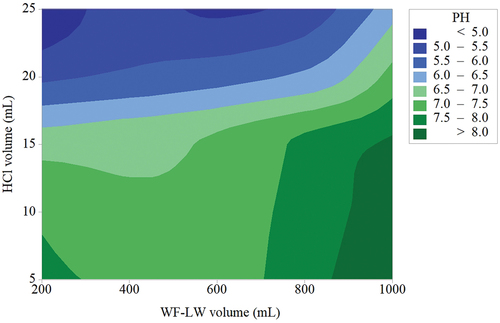
Figure 5. Surface characteristics of contour plot response between WF-LW and HCl volume influencing pH solution.
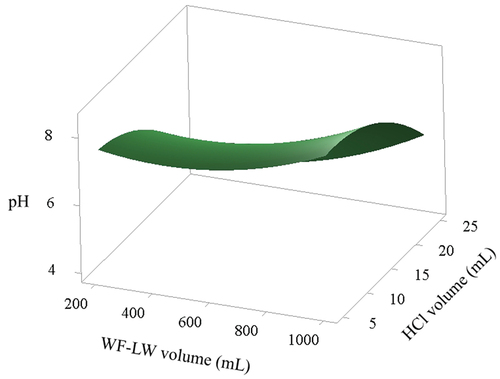
Table 2. SRM running for response optimization of pH solution
WF-LW at 1000 mL produced an average pH of 7.7 with the addition of 5–25 mL HCl, with an error bar of 0.918 and a yield of 91.8%, which meets the ideal value of 80–100%. WF-LW had a yield of 97.6% at 600 mL but a pH of 6.4, which is less than the standard value of 7. According to the optimization results, the best pH for hydrolysis and subsequent bioethanol production was 8.85. The low layer process, according to Wang et al. (Citation2017), followed the derivate set point, whereas Sari et al. (Citation2020) and Sari et al. (Citation2017) reported that the best pH for hydrolysis from bamboo was 4–4.5, which affected the yield of bioethanol, with the Response Surface method resembling the second-order polynomial model.
4.3. Effect of AE on yielding the glucose level from varying volumes of WF-LW
The effect of AE on the production of glucose levels from varying volumes of WF-LW is represented by the quadratic model in [EquationEq. 9(9)
(9) and EquationEq. 10]
(10)
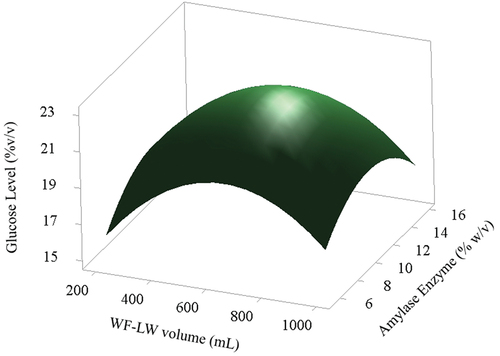
(10) . The linear and quadratic effects of AE and the different types of WF-LW were positive for all variables. Moreover, linear factors significantly affected the yields of glucose levels. show the influence of each variable on yield response. The response surface scheme for glucose levels produced at different volumes is shown in . The glucose levels ranged from 20 to 21% v/v, optimizing the highest level by setting the AE at 8 to 14% w/v with WF-LW volumes in the 400–800 mL range.
Figure 6. Surface characteristics for the effects of varying volumes of WF-LW (mL) on yields of glucose level.
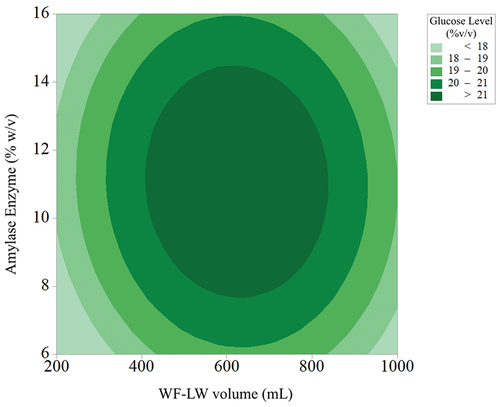
Figure 7. Response surface scheme of the effect of AE and WF-LW.
The feature of interest can be inferred later using regression algorithms from the ML (Machine Learning) field (Sergio et al., Citation2019). The control variables in the optimal control model are verified numerically by Matlab (2019) in the optimal control model (Muhammad et al., Citation2021). The linear representation of PDF and the model’s performance under various estimation methods were evaluated using a simulation study (Anum et al., Citation2021). In this study, the use of SRM in the regression model Equationequation (6)(6)
(6) , the equations obtained from the results of the study are Equationequations (9)
(9)
(9) and (Equation10
(10)
(10) ), with variable volume WF-LW (200–1000) mL, variable volume HCl (5–25) mL, and variable AE (6–16) % w/v, with WF-LW volume parameter condition 651.426 mL and AE level 11.642 % w/v, the obtained optimum glucose level was 21.5478% v/v.
Where:
X1 = WF-LW
X2 = AE
The response optimization using EquationEq. 10(10)
(10) was conducted in line with the optimum levels of the WF-LW (mL) and AE (%w/v) variables (). The CI was calculated to yield a glucose level of 21.55% v/v, while the responses were obtained at a 95% confidence level. Therefore, an optimized glucose level was achieved using the SRM method at a significance level of 0.05.
4.4. Effect of ME on yielding the glucose level from varying volumes of WF-LW
SRM also evaluated the effect of ME on glucose production at different volumes of WF-LW. The result can be predicted from the equations of (Sari & Dira, Citation2018) and (Dubey et al., Citation2012), which stated that the maximum glucose production was achieved at a value higher than 21% v/v. Furthermore, the linear effect of ME and type of WF-LW was also observed. The maltase factor linearly affected the yields of glucose levels. Any change in WF-LW volume, either decreasing or increasing from the lower target of maltose concentration, increased glucose production, as shown in . The results showed that ME ranging from 3.0% to 15.0% w/v gradually increased glucose production from volumes of WF-LW 200 to 600 mL with a maximum of 651.426 mL (). Moreover, the optimal response parameter of ME (7.37151% w/v) and WF-LW volume (651.426 mL) significantly yielded glucose levels of 21.34% v/v. The desirability function, namely 0.624970 of the SRM approach, suggested that ME had a less significant effect on glucose production (, ). The optimal yield response of 24.9% v/v for the fermented ME was noted in this study.
Figure 8. Surface characteristics for effects of ME addition on varying volumes of WF-LW (mL) on yields of glucose level.
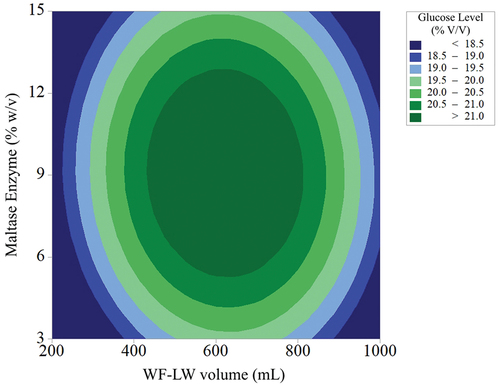
Figure 9. Response surface scheme of the effect of ME and WF-LW.
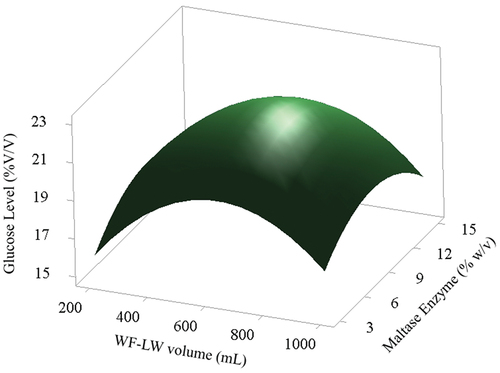
Table 3. SRM running for response optimization of glucose level with amylase enzyme
Table 4. SRM running for response optimization of glucose level with Maltase enzyme
As an alternative to the traditional WSRM (Wavelength Shift of the Resonant Mode) method, this sensor response analysis method for fluid characterization is based on RNPs (Resonant Nano-Pillars) transducer signals which are simplified using PCA (Principal Component Analysis). The feature of interest can be inferred later using regression algorithms from the ML (Machine Learning) field (Sergio et al., Citation2019). The control variables in the optimal control model are verified numerically by Matlab (2019) in the optimal control model (Muhammad et al., Citation2021). The linear representation of PDF and the model’s performance under various estimation methods were evaluated using a simulation study (Anum et al., Citation2021). In this study, the use of SRM in the regression model is Equationequation (6)(6)
(6) , the equations obtained from the results of the study are Equationequations (11)
(11)
(11) and (Equation12
(12)
(12) ), with variable volume WF-LW (200–1000) mL, variable volume HCl (5–25) mL, and variable ME (3–15) % w/v, with WF-LW volume parameter conditions 651.426 mL and ME content 7.3715% w/v obtained optimum glucose level 21.3372% v/v.
Where:
X1 = WF-LW volume
X2 = ME level
5. Conclusion
The optimization and pretreatment of WF-LW conducted in this study showed that HCL, AE, and ME affected the hydrolysis and fermentation processes to produce glucose-derived bioethanol. Based on the results, optimum glucose levels of 21.54% v/v and 21.33% v/v were obtained in the respective AE and ME. The domination of both enzymes was limited in the optimization process. Therefore, there is a need to develop wheat flour liquid waste to produce bioethanol. This study also contributed to the prospect of commercialization and standardization of the quality and production process of fermented WF-LW for improving the low-cost processing techniques currently being utilized among smallholder groups and households.
Further present experiments demonstrated that HCl, AE, and ME influenced the fermentation and hydrolysis processes to produce glucose-derived bioethanol by optimizing the pretreatment process of WF-LW. The optimum glucose levels for the hydrolysis process were 21.54% v/v and 21.33% v/v in the presence of AE and ME, respectively. Furthermore, the dominance of the two enzymes in the hydrolysis process was limited, and the optimization only used two parameters, namely effects of WF-LW and HCl-volumes on pH, while the error bar was also quantified. By optimizing SRM using three parameters made the optimal response reduced pH to 4.5 with a target of 8.5.
According to the Multiple Response Prediction, WF-LW is 1165.69 mL and HCl is 0.857864 mL. In the present study, it was proposed to cultivate AE and ME from indigenous cultures in Indonesia for the potential development of wheat flour liquid waste as bioethanol. The commercialization prospects, as well as the standardization of the quality and production process of WF-LW hydrolysis, may be improved by utilizing the low-cost technique currently used by small industrial groups such as restaurants and large industries such as PT. Indofood Sukses Makmur, Tbk.
Summary
The wheat flour liquid waste (WF-LW) may be chemically pre-treated and subsequent enzymatic hydrolysis for yielding glucose-derived bioethanol. The present study was undertaken to examine the effects of pH in the pre-treatment process, and the following hydrolysis of WF-LW in the presence of amylase and maltose enzymes. Optimization of pH and glucose-derived bioethanol using the Surface Response Method (SRM) yields optimum glucose levels of 21.54 (%v/v) and 21.33 (%v/v) for the hydrolysis process. Additionally, the domination of amylase and maltase enzymes in the hydrolysis process was found to be limited in the optimized process, have this evaluated for the potential development of WF-LW as potential waste as bioethanol. This study contributes to the prospect of commercialization and standardization of the quality and production process of hydrolysis WF-LW for improving the low-cost processing techniques currently being utilized among smallholder groups of restaurants and large industries of PT. Indofood Sukses Makmur, Tbk.
Acknowledgements
The author is grateful for the financial support through a grant from the Ministry of Education, Culture, Research and Technology, Indonesia, with Contract Number: 293/E4.1/AK.04.PT/2021
Disclosure statement
No potential conflict of interest was reported by the author(s).
Additional information
Funding
References
- Anum, S., Tabassum, L. S. A., Qasem, M., & Taseer, M. (2021). A new modified Kies Fréchet distribution: Applications of the mortality rate of Covid-19. Results in Physics, 28, 104638. https://doi.org/10.1016/j.rinp.2021.104638
- Balat, M., Balat, H., & Cahide, O. (2008). Progress in bioethanol processing. Progress in Energy and Combustion Science, 34(5), 551–17. https://doi.org/10.1016/j.pecs.2007.11.001
- Bensah, E. C., & Mensah, M. (2013). Chemical pretreatment methods for the production of cellulose ethanol: Technologies and innovations. International Journal of Chemical Engineering, 21, 269–276. https://doi.org/10.1155/2013/719607
- Demirbas, & Demirbas, A. (2008). A. Product from lignocellulosic material via degradation processes. Energy Sources, Part A: Recovery, Utilization, and Environmental Effects, 30(1), 27–37. https://doi.org/10.1080/00908310600626705
- Duan, W., Xiao, X., Dongyangfu, J., Meiliu, Y., Jin, L., Jin, L., & Jin, L. (2019). Neural dynamics for control of industrial agitator tank with rapid convergence and perturbations rejection. IEEE Access, 7, 102941–102950. 22 July 2009. https://ieeexplore.ieee.org/document/8768466
- Dubey, A. K., Gupta, P. K., Garg, N., & Naithani, S. (2012). Bioethanol production from waste paper acid pre-treated hydrolyzate with xylose-fermenting Pichia stipitis. Carbohydrate Polymers, 88(3), 825–829. https://doi.org/10.1016/j.carbpol.2012.01.004
- Karimi, K., Kheradmandinia, S., & Taherzadeh, M. J. (2006). Conversion of rice straw to sugars by dilute acid hydrolysis. Biomass & Bioenergy, 30(3), 247–253. https://doi.org/10.1016/j.biombioe.2005.11.015
- Kuhad, R. C., Gupta, R., Khasa, Y. P., & Singh, A. (2010). Bioethanol production from Lantana camara (red sage): Pretreatment, saccharification, and fermentation. Bioresource Technology, 101(21), 8348–8354. https://doi.org/10.1016/j.biortech.2010.06.043
- Kumar, A., Singh, L. K., & Ghose, S. (2009). Bioconversion of lignocellulosic fraction of water-hyacinth (Eichhornia Crassipes) hemicellulose acid hydrolysate to ethanol by pichia stipitis. Bioresource Technology, 100(13), 3293–3297. https://doi.org/10.1016/j.biortech.2009.02.023
- Limayem, A., & Ricke, S. C. (2012). Lignocellulosic biomass for bioethanol production: Current perspectives, potential issues, and future prospects. Progress in Energy and Combustion Science, 38(4), 449–457. https://doi.org/10.1016/j.pecs.2012.03.002
- Muhammad, Z., Thabet, A., & Fawad, N. (2021). Exponentiated transformation of Gumbel Type-II distribution for modeling COVID-19 data. Alexandria Engineering Journal, 60(1), 671–689. https://doi.org/10.1016/j.aej.2021.01.022
- Nathan, W. G., Rachel, A. H., Holly, K. S., & Lee, C. S. (2019). Engineering solventogenic clostridia for commercial production of bio-chemicals. Journal of the Institution of Engineering and Technology, 3(3), 41–45. https://doi.org/10.1016/j.copbio.2008.08.003
- Nibedita, S., Sumanta, K. G., Bannerjee, S., & Aikat, K. (2012). Bioethanol production from agricultural wastes: An overview. Renewable Energy, 37(1), 19–27. https://doi.org/10.1016/j.renene.2011.06.045
- Sari, N. K., Basuki, R., Setyono, A., Abdi, I. N., & Sutiyono, (2014). Simulation growth of microorganisms Saccharomyces cerevisiae with the fed-batch fermentation process. Proceedings Bisstech II 2014, UPN Veteran Jawa Timur and Stikom Bali, p. D1.09 http://eprints.upnjatim.ac.id/id/eprint/7304
- Sari, N. K., Sutiyono, S., Luluk, E., Dira, E., Wesen, P., & Tatik, S. H. (2016). Bioethanol production from liquid waste of rice flour with batch process. Proceeding MATEC Web of Conference, 58(1014), 2016. https://doi.org/10.1051/matecconf/20165801014
- Sari, N. K., Abdi, I. N., Wesen, P., & Dewati, R. (2016). Numerical of bioethanol production from liquid waste of rise flour by distillation process. Proceeding MATEC Web of Conference, 58(1014), 1-5. https://doi.org/10.1051/matecconf/20165801014
- Sari, N. K., Nico, Y., Tika, L., & Ernawati, D. (2017). Hydrolysis of cellulose from bamboo with biology process using enzyme. Journal Advance Science Letters, 23(12), 12235–12238. https://doi.org/10.1166/asl.2017.10610
- Sari, N. K., & Dira, E. (2018). Comparison production bioethanol from cellulose using batch distillation and flash distillation process. Journal of GEOMATE 2018, 15(50), 76–81. https://geomatejournal.com/geomate/article/view/956
- Sari, N. K., & Ernawati, D. (2019). Process fermentation of filtrate bamboo with saccharomyces cerevisiae and zymomonas mobilis. Journal of Physics. Conference Series, 1295(2019), 012033. https://doi.org/10.1088/1742-6596/1295/1/012033
- Sari, N. K., Purbasari, I., & Jariyah, J. (2020). Bioethanol optimization in hydrolysis and fermentation process with surface response method. IEEE Access, pp. 297–300, https://ieeexplore.ieee.org/document/9320981
- Sarkar, N., Ghosh, S. K., Bannerjee, S., & Aikat, K. (2006). Bioethanol production from agricultural wastes: An overview. Journal of Renewable Energy, 37(1), 19–27. https://doi.org/10.1016/j.renene.2011.06.045
- Selvakumar, P., Kavitha, S., & Sivashanmugam, P. (2019). Optimization of process parameters for efficient bioconversion of thermo-chemo pretreated Manihot esculenta Crantz YTP1 stem to ethanol. Waste Biomass Valorization, 10(8), 2177–2191.https://doi.org/10.1007/s12649-018-0244-7
- Selvakumar, P., Adane, A. A., Zelalem, T., Hunegnaw, B. M., Karthik, V., Kavitha, S., Jayakumar, M., Karmegam, N., Govarthanan, M., & Kim, W. (2022). Optimization of binary acids pretreatment of corncob biomass for enhanced recovery of cellulose to produce bioethanol. Fuel, 321, 124060. https://doi.org/10.1016/j.fuel.2022.124060
- Sergio, Q., Francisco, J. S., Lanza-Gutierrez, J. M., Sanza, F. J., Riesgo, T., & Holgado, M. (2019). A Novel data processing technique for expert resonant nano-pillars transducers: A case study measuring ethanol in water and wine liquid matrices. IEEE Access, 7, 129778–129788. http://dx.doi.org/10.1109/ACCESS.2019.2939576
- Teymouri, F., Peres, L. L., Alizadeh, D., & E, B. (2005). Optimization of the ammonia fiber explosion (AFEX) treatment parameters for enzymatic hydrolysis of corn stover. Journal of Bioresource Technology, 96(18), 2014–2018. https://doi.org/10.1016/j.biortech.2005.01.016
- Thangavelu, S. K., Ahmed, A. S., & Ani, F. N. (2014). Bioethanol production from sago pith waste using microwave hydrothermal hydrolysis accelerated by carbon dioxide. Journal of Applied Energy, 128, 277–283. https://doi.org/10.1016/j.apenergy.2014.04.076
- Tutt, M., Kikas, T., & Olt, J. (2012). Influence of different pretreatment methods on bioethanol production from wheat straw. Agronomy Research Biosystem Engineering, 1, 269–276. https://agronomy.emu.ee/vol10Spec1/p10s131.pdf
- Wang, Y., Jinna, L., & Huiyong, W. (2017). Model-based application of fuzzy control to a class of industrial process operation systems with uncertainty. IEEE Access, 5, 23351–23360. https://ieeexplore.ieee.org/stamp/stamp.jsp?arnumber=8089803