
 ?Mathematical formulae have been encoded as MathML and are displayed in this HTML version using MathJax in order to improve their display. Uncheck the box to turn MathJax off. This feature requires Javascript. Click on a formula to zoom.
Abstract
The emerging concerns towards sustainability have encouraged industrial stakeholders to get involved and cooperate to achieve a sustainable supply chain. This paper develops a coordination mechanism for a closed-loop supply chain, operating under several policies to control the carbon emission, namely a carbon tax regulation, government incentives policy, green technology investment, and energy-saving investment. The carbon tax regulation is implemented to lessen the emissions from the manufacturer’s activities. Whereas, to encourage the manufacturer to cut down the emission as well as to increase the product return and energy savings, the government provides incentives based on a target level. The system operates under a variable market demand which is affected by the retailer’s selling price, green technology, and energy-saving levels. The proposed problem is formulated under two different scenarios, which are the centralized model and the decentralized model. To improve the supply chain coordination, we also propose two different contracts, namely the green technology revenue-investment-sharing contract (GRIS contract) and the energy saving revenue-investment-sharing contract (ERIS contract). The system inflicted with two types of inspection error in classifying the returned products. The models are formulated mathematically and optimized using a proposed algorithm. The result shows that the centralized model performs better in maximizing the total profit compared to the decentralized model. The results also imply that the government incentives toward product returns, green technology, and energy-saving actually affect the optimal decision of the supply chain system. In addition, the proposed contracts are proven to provide win–win solutions and improve supply chain coordination.
1. Introduction
In recent years, the increasing environmental concerns such as pollution and resource scarcity have encouraged decision-makers to reuse products, cut down emissions, and manage energy consumption. According to Wang et al. (Citation2018) and Li et al. (Citation2018), companies can save 70% material, 60% energy and 50% cost, and reduce 80% air pollution by implementing a closed-loop supply chain (CLSC). A CLSC focuses on integrating forward flow and backward flow in a system made of some members. In the forward flow, companies convert raw materials into new products and in the backward flow, companies employ recovery processes, such as remanufacturing, refurbishing, and recycling, to convert used products into new products (Yuan et al., Citation2015). Fuji Xerox, IBM, Kodak, and IBM realize some economic and environmental benefits and achieve a good social reputation through CLSC management. It helps companies to balance the triple bottom line of economic, environmental, and social responsibilities, which become the key factor in attaining sustainable development (Kim et al., Citation2014).
As concerns about environmental conservation continue to rise, emission reduction has become an important issue since carbon dioxide is the main contributor to global warming. In this regard, governments in many countries set emission targets and use various types of policies to curb carbon emissions. Canada has a target to reduce emissions to below 2005 level by 2030. China, as the largest contributor of carbon emissions in the world, set a target to reduce emission growth by 2030 and tries to cut the emissions 64–70% below 2005 level. Some carbon policies, such as carbon tax, are also widely used in many countries, e.g.,, Sweden, India, Denmark, to achieve the emission reduction target. In addition, the growth of customers who are aware of low-carbon products significantly increase. Customers prefer to choose low-carbon products and are willing to pay higher prices (Liu et al., Citation2012; Stiglic et al., Citation2015). To comply with the carbon policy issued by regulators and the changes in customer behaviors, some companies employ green technology to reduce emissions (Bai et al., Citation2019, Citation2020; Yang et al., Citation2017). Marks and Spencer and Walmart are some examples that adopt green technology to cut emissions from their manufacturing process. Some scholars also considered that green technologies help companies to cut down carbon emissions. Bai et al. (Citation2019) proposed a cap-and-trade policy and green technology investment to reduce emissions in a two-stage supply chain system made of a manufacturer and two competing retailers. A revenue-sharing contract is utilized to increase the profit and coordinate the supply chain system. Later, Bai et al. (Citation2020) studied the impact of risk aversion on the supply chain coordination under green technology investment and carbon tax policy. Jauhari et al. (Citation2020) studied the effect of some coordination scenarios in a closed-loop supply chain system made of a manufacturer, a retailer, and a collector. The demand of customers is formulated as a function of green technology level, product quality, and product price. Zhang and Yousaf (Citation2020) considered a refinery-retailer supply chain system with green customer preferences and a two-part tariff contract. Sun et al. (Citation2020) constructed a Stackelberg game model of a supply chain system considering the lag time of emission reduction technologies and the low-carbon preferences of consumers. Xin et al. (Citation2019) constructed a mathematical model for the single and dual-supply chains with customers’ preferences and technological innovation.
The increasing environmental awareness related to energy shortages has pushed the governments in many countries to promote energy-efficient products to reduce household electrical energy consumption. In an attempt to increase the usage of the products, the governments are willing to provide subsidies and encourage the companies to produce more energy-efficient products. Norway and Sweden have charged a lower tax to energy-efficient products (Li & Li, Citation2017). Later, China provides subsidies for purchasing energy-efficient products, such as LCD TV, air conditioning, and automobiles (Shao et al., Citation2017). In addition to the government’s attention, customers’ awareness of products with lower energy consumption has also significantly increased. Customers are willing to pay for the products at higher prices (Moon et al., Citation2002). Thus, companies must enhance their product research and increase the efficiency of energy-consuming products. Xie (Citation2015) introduced a mathematical model for the supply chain and studied how the profit-sharing, one-time transfer, and wholesale price contracts influence the coordination of supply chain members. Xie (Citation2016) extended his previous model by considering two different competitive suppliers’ coordination policies. He showed that the sustainability of the supply chain can be significantly improved by a cooperative strategy. Finally, Xue et al. (Citation2019) focused on investigating how government subsidies can influence the energy conservation level, demand, and total profit.
Based on the background above, although CLSC has been extensively investigated in the literature, to the best of our knowledge no research has developed a CLSC model consisting of a manufacturer and a retailer, with green technology investment, inspection errors, energy-saving products, and government incentives. Therefore, in this study, we attempt to answer the following questions:
How does CLSC perform under centralized and decentralized scenarios?
How do government incentives affect CLSC performance?
Can a revenue and cost-sharing contract improve the green technology level, energy-saving level, and profit of the CLSC?
To answer the above questions, mathematical models for CLSC made of a manufacturer and a retailer are proposed. The inspection process done by the manufacturer to classify the quality of the used products is influenced by human errors. The manufacturing and remanufacturing processes in the manufacturer generate emissions and are restricted by a carbon tax policy. To comply with the emission policy issued by the government, the manufacturer invests in green technology to curb emissions. In addition, the manufacturer also invests in energy-saving to produce high energy-efficient products.
2. Literature review
Two streams of the literature related to the work presented in this paper: (a) Coordination in CLSC, and (b) CLSC with environmental consideration. The discussion of streams is provided in the following sub-sections.
2.1. Coordination in CLSC system
Without coordination, each party in CLSC will make its own decisions that optimize its respective objectives. Although individual decisions give a positive impact on individual performance, they can lead to poor CLSC performance. To avoid conflicts between parties and to improve the performance of CLSC, the decisions should be made carefully. In this regard, the employment of coordination contracts in CLSC is one of the effective ways to improve the system. This is because the parties’ objectives are aligned with the whole CLSC objective. There are several types of contracts that have been discussed in the literature to coordinate the forward supply chain, including revenue sharing (Bai et al., Citation2019, Citation2020), quantity discount (Nouri et al., Citation2021), cost-sharing (Koo, Citation2022), delay in payment (Marchi et al., Citation2021). illustrates the differences between the proposed model and the published models.
Table 1. Comparison between the proposed model and previous models
To show the benefit of coordination in reverse supply chain or CLSC, some scholars proposed some contract mechanisms to coordinate the supply chain members. For instance, Hosseini-Motlagh et al. (Citation2019) investigated the demand disruptions in the dual-channel reverse supply chain and employed a combined two-part tariff contract to coordinate the members. Hosseini-Motlagh et al. (Citation2020a) studied collection disruption management in CLSC and proposed a profit-sharing mechanism to improve channel coordination. Later, a compensation-based wholesale price contract is used by S.M. Hosseini-Motlagh et al. (Citation2020b) to coordinate CLSC’s members under a dual-function acquisition price. Hosseini-Motlagh et al. (Citation2022) developed a coordination model with product acquisition and collectors competition, and proposed a three-party two-part tariff mechanism to coordinate the members involved.
2.2. CLSC with environmental consideration
In the second stream, researchers have focused on developing strategies to reduce the impact of CLSC’s operations on environmental performance. To this end, extensive studies (e.g., De & Giri, Citation2020; Kazancoglu et al., Citation2022; Krug et al., Citation2020; Lotfi et al., Citation2021a; Mogale et al., Citation2022; Prakash et al., Citation2020; Shekarian et al., Citation2021) were done to investigate the influence of carbon reduction on CLSC’s performance. As concerns about global warming grow, some carbon regulations, such as carbon tax, strict carbon cap, and carbon cap-and-trade have been used to control emissions from the supply chain. For instance, Dou and Cao (Citation2020), Jauhari et al. (Citation2021), and Luo et al. (Citation2022) used a carbon tax regulation to control emissions from the CLSC’s operations. Yang et al. (Citation2021), Wang and Wu (Citation2021), and Cheng et al. (Citation2022) employed a carbon cap-and-trade regulation to lessen the emissions. In an effort to improve the sustainability performance of supply chain, several studies (e.g., Jauhari et al., Citation2020; Jauhari & Wangsa, Citation2022; Wu et al., Citation2019), adopted green technology investment to cut down the carbon emissions from supply chain and CLSC systems. They showed green technology adoption in manufacturing and remanufacturing processes can improve the sustainability level of the industries. Mostly, the green technology is used to minimize the emissions generated from production, rework, and storage activities. Furthermore, some scholars (e.g., Lotfi et al., Citation2021c, Citation2022a, Citation2021b) considered resilience in the sustainable supply chain system.
Energy scarcity and customer awareness on energy saving have prompted industries to make serious efforts to reduce energy consumption and make energy-efficient products. The influence of energy consumption on supply chain performance has been investigated by some scholars. For instance, Bazan et al. (Citation2017) explored the influence of energy usage on CLSC’s performance under various coordination mechanisms. Hosseini-Motlagh et al. (Citation2020c) explored the impact of energy-saving efforts on remanufacturing performance under the multiple-links contract. Soleimani et al. (Citation2022) addressed a four-stage CLSC system with disposal centres, number of job opportunities, and energy consumption. Lotfi et al. (Citation2022b) proposed a viable CLSC network with a resilience strategy and energy consumption constraints. Wang et al. (Citation2019) studied energy-efficient products in the textile supply chain taking into consideration the emission reduction efforts. Furthermore, the impact of governmental regulations on energy saving levels was studied by Xie (Citation2015) and Hafezalkotob (Citation2017).
2.3. Research gap and contributions
The research gap and the contributions of the proposed work are described as follows:
Different from the previous works (Bai et al., Citation2020; Hosseini-Motlagh et al., Citation2020a, Citation2022, Citation2019; Jauhari et al., Citation2020; Luo et al., Citation2022), which have used green investment to improve the sustainability performance of the investigated system, this research uses three investments, namely green technology investment, energy saving investment and take-back investment, to lessen the emissions generated, improve energy conservation and increase the number of collected products. To the best of our knowledge, this research is the first to investigate the influence of three investments on the CLSC coordination model.
Unlike most of the CLSC model (Hosseini-Motlagh et al., Citation2020a, Citation2022; Jauhari et al., Citation2020; Luo et al., Citation2022) which have adopted such investments to improve the sustainability performance of the system, our research also considers the employment of reward-penalty mechanism. This mechanism allows the government to give certain amount of money to the manufacturer as a reward if surpassed the given target and withdraw money as a penalty if it is not achieved. The investment policies that are applied simultaneously with the provision of rewards or penalties will provide a stronger impetus to manufacturers to improve the sustainability performance.
To be in line with the use of investments, our research proposes two types of revenue and investment-sharing contract (RIS), namely the green technology investment sharing contract (GRIS) and the energy saving investment sharing contract (ERIS), to coordinate the CLSC’s members. Although many scholars have used various contracts to improve the coordination of the supply chain, none have investigated the influence of the proposed contracts on CLSC performance.
Different from the previous CLSC models (e.g., Jauhari et al., Citation2021; Luo et al., Citation2022) which assumed that the inspection of returned products is always perfect, our research considers imperfect inspection. Here, we propose two types of inspection error, which are the type-1 error and the type-2 error. The type-1 error occurs when the inspector falsely classifies the recoverable as unrecoverable. Whereas, the type-2 error occurs when the inspector falsely classifies the unrecoverable as recoverable. To the best of our knowledge, this research is the first CLSC model to incorporate the inspection error aspect in classifying the returned products.
3. Problem statement
3.1. Problem statement
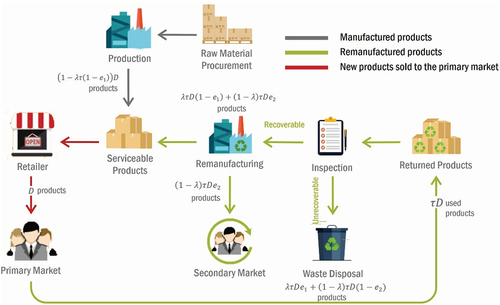
In this paper, the focus of the research is to explore the decision-making scheme for the cooperative energy-saving products and green technology investment decisions of the supply chain under government incentives and carbon tax policy. For simplicity, we describe a two-echelon CLSC that consists of a single manufacturer and a single retailer. In forward flow, manufacturer produces certain energy-saving products (e.g., energy-efficient television or washing machine) and sells them to the customers through the retailer. The size of the market demand depends on the product price, the level of green technology, and the level of energy conservation. Thus, in order to increase the demand and rewards given by the government, we assume the manufacturer invests in the level of energy-saving products. In reverse flow, the manufacturer collects used products from the end customers and then performs the inspection and sorting processes with respect to their quality. We classify the used products into two categories, which are recoverable and non-recoverable products. Those products that have not met the acceptable quality standard will be disposed of through the waste disposal process and the remaining products will be remanufactured and sold to the primary market along with the new products. We assume that the manufacturer invests in collection efforts to increase the quantity of returns, under premise that the manufacturer will get incentives by the government if met a certain target.
We consider two-way imperfect inspections, i.e., type-one inspection error falsely screening out a proportion of recoverable products and disposing them like non-recoverable and type-two inspection error of falsely not screening out a proportion of non-recoverable products, thereby passing them on to remanufacture process, resulting in defective or lower quality products. This type of product or any other product that has a lower quality level than the brand-new one is then sold to the secondary market for a certain amount of discount compared to newly produced or remanufactured product. Carbon emissions are generated during production processes (both regular and remanufacture). Under carbon-tax regulation, the government will put a certain amount of price per unit of carbon emitted during the production processes as an effort to reduce the use of fossil fuels and greenhouse gases. The government interventions also can be seen through the reward-penalty policy where the government will give a certain amount of money to the manufacturer as a reward if they successfully surpass the given target. Otherwise, the government will penalize the manufacturer. Therefore, in order to reduce carbon emissions and increase customer awareness of green products, the manufacturer invests in green technology level. The schematic diagram of the two-echelon supply chain operation is depicted by Figure .
Figure 1. Proposed CLSC model.
3.2. Notations and assumptions
The following notations are used to develop the proposed mathematical models:
Table
Table
The following assumptions are considered in developing our mathematical model:
The market demand
is linearly dependent on the selling price, green technology level, and the energy saving level
The remanufactured products have the same quality as brand-new units produced from raw materials. Therefore, it will be sold to the primary market at the same price, whereas, the remaining product who failed to meet the minimum quality of the new products are sold to the secondary market at a lower price,
The remanufacturing cost of product per unit is lower than the manufacturing cost,
The manufacturer is assumed to invest in green technology, collection efforts of used products, and energy saving. These investments are formulated as quadratic functions, i.e.,
The green technology invested cannot completely eliminate carbon emissions produced during production process, thus
3.3. The basic model
In this section, we construct a basic mathematical model for the proposed CLSC. Based on the above-mentioned descriptions, the inspection process is assumed to be imperfect, thus generating two types of errors. The type I error is for classifying recoverable products as unrecoverable and the type II error is for classifying unrecoverable products as recoverable. Therefore, we have four cases, that are: Case 1 recoverable products are categorized as unrecoverable, Case 2 recoverable products are categorized as recoverable, Case 3 unrecoverable products are categorized as recoverable, and Case 4 unrecoverable products are categorized as unrecoverable. The mathematical expressions for the number of products in each case are described as follows
Case 1: Case 3:
Case 2: Case 4:
This categorization is in line with the categorization carried out by many authors (e.g., Jauhari, Citation2016; Rizky et al., Citation2021; Saga et al., Citation2019) in the case of production errors and imperfect inspections. In our model, the recoverable products will be sent to remanufacturing and the unrecoverable products will be sent to waste disposal. Thus, the number of products generated from remanufacturing can be calculated by considering all the products categorized as recoverable (Case 2 and Case 3). To ensure the demand can be met by the manufacturer, the number of products produced through production must take into account the number of original recoverable products that are processed through remanufacturing (Case 2). The number of original unrecoverable products (Case 3) should be ignored because they will be sent to waste disposal at the end of the remanufacturing process. Based on the above explanation, we can easily derive the expressions for the number of products generated from remanufacturing and production, which are
Thus, the emissions from both production and remanufacturing can be determined by multiplying the emissions per unit product with the number of products processed in each process.
By determining the wholesale price , the green technology level
, the energy-saving level
, and the return rate of used products
, the manufacturer aims to increase his/her profit. Based on the previous assumptions, the manufacturer’s profit function can be obtained in equation (2).
The first term of the objective function (2) can be defined in two parts which represent revenue and cost of the manufacturer: 1) and
are the net benefit of producing and selling products in the primary and secondary market, respectively. 2)
,
, and
are the government reward-penalty from the energy-saving level, the green technology level, and the collection rate of used product. The other terms of the objective function (2) are as follows: 1) the manufacturing cost of new products and raw material purchasing cost
, 2) the remanufacturing cost of returned products
, 3) the disposal cost
, 4) the buy-back cost of returned products
, 5) the inspection cost of used products
, 6) the total carbon emissions cost
, and 7) the investment cost in green technology, collecting used product, and energy-saving,
,
, and
, respectively.
By determined selling price the retailer maximizes his profit, as expressed in Equationequation (3)
(3)
(3) .
The first term of the objective function (3) is the net benefit of selling products to the primary market whereas the second term is the purchasing cost of new products from the manufacturer
.
We define the following equations as a convenience for expressing mathematical models
From EquationEquations (4(4)
(4) –Equation5
(5)
(5) ), we can easily obtain,
In the following sections, we present the conditions under four different decision-making regimes. For representing the optimal values of centralized, decentralized, GRIS contract, and ERIS contract, we add “c”, “d”, “gris”, and “eris” superscript to the objective functions or respective variables. Proof for each of the theorems and propositions is given in the Appendix.
3.4. The centralized model
First, as the benchmark for a decentralized system, centralized decision-making is developed and implemented. The main objective of a centralized system is to maximize the total profit of the CLSC. Therefore, the retailer and the manufacturer are integrated as a whole system to make the decision of all decision variables. The objective of this supply chain system is to maximize the overall profit of the CLSC. Thus, from Equations (2)-(Equation3(3)
(3) ), the system’s corresponding total profit can be defined as follows.
By solving the first-order conditions necessary for objective function (8), the optimal solutions of centralized decision-making can be obtained. The optimal solutions are presented in Proposition 1.
Proposition 1. The total profit for the centralized CLSC is jointly concave in
,
,
, and
. Moreover, the corresponding optimal solutions are given by the following expressions r.
Proof. Please see Appendix A.
In order to ensure that the area of the objective function and the optimal solutions value are positive, we need to proof that the Hessian Matrix of the Equationequations (9)(9)
(9) -(Equation12
(12)
(12) ) is negative-definite and satisfies several conditions (e.g., see Appendix A). Furthermore, we assume that the collection effort investment parameter is sufficiently large (i.e.,
), so that the practical and feasible solutions for the return rate of used products can be assured, i.e.,
By substituting Equationequations (9)
(9)
(9) -(Equation12
(12)
(12) ) into equation (8), we can obtain the corresponding objective function of
.
3.5. The decentralized model
In a decentralized system, the manufacturer and the retailer make their own decisions separately according to the maximization of each player’s own interest. We use a Stackelberg game structure where the manufacturer acts as a leader and the retailer plays the role of the follower to present this behaviour. The retailer maximizes his profit by determining the selling price, as expressed in Equationequation (13)(13)
(13) .
The manufacturer seeks to maximize his profit by determining the wholesale price, the green technology level, the energy-saving level, and the return rate. By considering the retailer’s reaction functions, the manufacturer’s objective function can be obtained in equation (14).
Let ,
,
,
, and
be the optimal wholesale price, the selling price, the energy-saving level, and the return rate, respectively. We first use the backward sequential decision-making approach to analyze the optimal response function from Equationequation (13)
(13)
(13) and (14). In this way, Proposition 2 is attained.
Proposition 2. For the decentralized CLSC, the following holds.
The profit function of the retailer in the decentralized system
The profit function of the manufacturer in the decentralized system
Proof. Please see Appendix B.
In order to ensure that the area of the objective function and the optimal solutions value are positive, we need to prove that the Hessian Matrix of the Equationequations (15)(15)
(15) -(Equation19
(19)
(19) ) is negative-definite and satisfies several conditions (e.g., see Appendix A). We also assume that the parameter of investment collection effort is high enough (i.e.,
), to ensure a feasible and practical return rate solutions for used products, i.e.,
By substituting Equationequations (15)
(15)
(15) into Equationequation (13)
(13)
(13) and Equationequations (16)
(16)
(16) -(Equation19
(19)
(19) ) into equation (14), we can obtain the corresponding objective function of
and
, respectively. In the meanwhile, decentralized decision-making’s total profit is the sum of the profit of the supply chain participants and denoted by
. In addition, by comparing
and
, we have
>
. The manufacturer, as a leader, wants the retailer to cooperate in order to maximize the total profit of the system. However, with
>
, the retailer is likely to reject the cooperation because the decline in selling prices will lead to a reduced profit. The manufacturer negotiates with the retailer and provides the retailer with a certain amount of incentives to cooperate in this situation. Consequently, it is important to establish some effective contract mechanisms.
3.6. Coordination with contract mechanism
3.6.1. Green technology revenue investment sharing contract (GRIS contract)
The GRIS contract for CLSC coordination is commonly used and can be defined as follows. As the leader, the manufacturer first charges a lower unit wholesale price and pass a fraction of its revenue to encourage the cooperation with the retailer. In exchange, the retailer allocates the same fraction to the green technology investment cost. Sustainable investment is therefore consistent with the centralized system. The profits of the manufacturer and the retailer under GRIS contract can be expressed as follows.
Under this scenario, the manufacturer determines firstly the share of the investment in green technologies, and then the manufacturer decides the green technology level, wholesale price, energy-saving level, and the return rate. Finally, the retailer will decide the optimal selling price. Solving EquationEquation (20)(20)
(20) -(21), under such coordination contract, we obtain Proposition 3.
Proposition 3. The GRIS arrangement would lead to coordination under carbon tax regulation as ,
, and
Moreover, the corresponding wholesale price and green technology level are.
Proof. Please see Appendix C.
In the GRIS contract, we have the green technology level equal to the centralized system (i.e., , by comparing Equation (23) and (Equation10
(10)
(10) ). In addition, Proposition 3 implies that the optimal decisions of the retailer and of the manufacturer are perfectly coordinated and consistent with those of the centralized system. Furthermore, for both the manufacturer and the retailer, the GRIS contract may be applied only if their profits are equal to or greater than the profits of the decentralized system. We, therefore, have the conclusion as follows.
Proposition 4. The CLSC members accept the GRIS contract if holds the following.
The GRIS contract is accepted by the retailer and the manufacturer if and only if
and
(2)
Proof. Please see Appendix C.
Proposition 4 provides both the manufacturer and the retailer with upper and lower limits of profit when an agreement is reached.
3.6.2. Energy saving revenue-investment-sharing contract (ERIS contract)
In the ERIS contract, the manufacturer first charges a lower unit wholesale price and passes a fraction of its revenue to encourage the retailer to cooperate. In exchange, the retailer allocates the same fraction to the energy-saving investment cost. Sustainable investment is therefore consistent with the centralized system. The profits of the manufacturer and the retailer under ERIS contract can be expressed as follows.
We can obtain the optimal wholesale price and energy-saving level under such coordination with the optimal selling price in the ERIS contract is equal to that in the decentralized scenario, i.e., , as presented in Proposition 5.
Proposition 5. The ERIS arrangement would lead to coordination under carbon tax regulation as ,
., and
Moreover, the corresponding wholesale price and green technology level are.
Proof. Please see Appendix D.
In the ERIS contract, we have the energy-saving level equal to the centralized system (i.e., , by comparing EquationEquation (28)
(28)
(28) and (Equation11
(11)
(11) ). In addition, Proposition 5 implies that the optimal decisions of the retailer and of the manufacturer both can be perfectly coordinated and consistent with those of the centralized system. Furthermore, for both the players, the ERIS contract may be applied only if their profits are equal to or greater than the profits of the decentralized decision-making system. We, therefore, have the conclusion as follows.
Proposition 6. The CLSC members accept the ERIS contract if holds the following.
The ERIS contract is accepted by the retailer and the manufacturer if and only if
and
Proof. Please see Appendix C. Proposition 6 provides both the manufacturer and the retailer with upper and lower limits of profit when an agreement is reached.
4. Result
4.1. Numerical example
In this section, to illustrate the above theoretical results, we use a numerical example and further examine the influence of several key parameters on the CLSC coordination. This method compares the effects of equilibrium of a green CLSC with four scenarios (centralized, decentralized and two sharing contracts). We suppose that = 40,
= 60,
= 30,
= 5,
= 20,
= 5. We use
= 57,
= 42,
= 0.75,
= 0.60,
= 20,
= 2.5 and also use
= 10,
= 12,
= 8,
= 0.2,
= 15,
= 5. The basic demand
= 120, with
= 0.10,
= 0.85, and
= 0.5,
= 0.85. The rest of the variables are
= 0.5
,
= 6000,
= 50,
=0.02,
=0.02. With these given data, we obtain the following computational results as shown in .
Table 2. The optimization result for the given numerical example
shows that under the centralized system, the optimal profit is greater than that of the decentralized system. The cooperation between manufacturer and retailer results in a 54.5% increase in the total profit of the CLSC. Moreover, most of the decision variables under a centralized scenario also much higher than the decentralized. By moving from decentralized scenario to centralized scenario, the green technology level, the energy-saving level, and the return rate increase by 136.2%, 136.9%, and 117.2%, respectively. Thus, we can conclude that cooperation between manufacturer and retailer under centralized decision-making will lead to a double marginal effect in the system.
4.2. Discussions
As shown in , the centralized model actually gives higher ETP (33,877.6) than the decentralized one (21,925.5). However, the result in shows that the centralized decision-making actually ends up in a lower retailer’s selling price (pr* 842.83) than the decentralized one (pr*
1,058.49). This kind of coordination may not be preferable by the retailer, since the retailer will end up in a lower profit. In order to keep the centralized coordination running profitable for both players, the manufacturer may then provide the retailer with a certain scheme of cooperation as we propose in the GRIS and ERIS contracts.
Table 3. The optimization result for the given numerical example under ERIS and GRIS contracts
summarizes the result of the two proposed RIS contracts. RIS (Revenue-Investment Sharing) contract is the combination of the centralized and decentralized policy. When the RIS contract is implemented, the system can obtain a win–win solution where both players experience higher profits compared to the decentralized policy. From the results shown in , we observed that when cooperating under the ERIS contract, the system can obtain a better solution for E = 0.25 and
E = 0.35. For
E = 0.15, the outcome may not be profitable for the retailer since he will experience a lower profit (compared to the decentralized solution). Whereas, for
E = 0.45, the RIS contract also will not provide a win–win solution since the manufacturer experiences a decrease in profit compared to the decentralized solution.
In addition, the GRIS contract will provide a win–win solution for both players when the value of E is set between 0.25, 0.35, or 0.45. These will increase the profits of both retailer and manufacturer. On the other hand, for
E = 0.15, the GRIS contract will not provide a win–win solution for the system. Although the manufacturer achieves a considerable increase in profit, the cooperation contract will not be profitable for the retailer. These findings give us insight that the proposed RIS contracts, both ERIS and GRIS contracts, have proven to provide better outcomes to the supply chain system. However, the parameter of revenue and cost sharing fraction (θ) needs to be set at a certain level to ensure that a win–win solution is achieved and both players receive an increase in profit.
4.3. Sensitivity analysis
In this section, we perform a sensitivity analysis to examine the behaviour of the decision variables and total profits by varying several parameters with the remaining being constant. Therefore, the following observations are made from comparative results depicted in Figures . Figure shows the influence of return rate incentive (Iτ) on the decision variables and total profit of the CLSC. As Iτ increase, the whole system profit and all the decision variables except return rate (τ) remain almost unchanged. In a real system, when the government gives a higher incentive for the return rate, the manufacturer will increase its collection effort to gain more used products from the customer. Also shown in Figure , we observed that the centralized decision-making scenario offers the greatest return rate than the other structure.
Figure 2. The impact of the return rate incentive on the decision variables and supply chain profit.
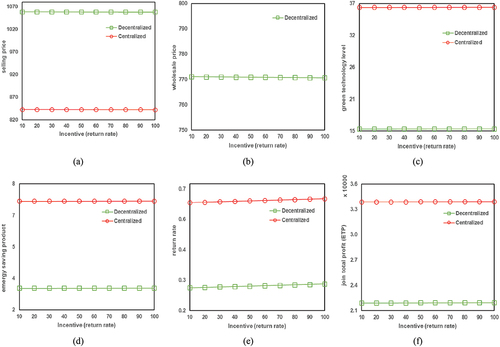
Figure 3. The impact of the green technology level incentive on the decision variables and supply chain profit.
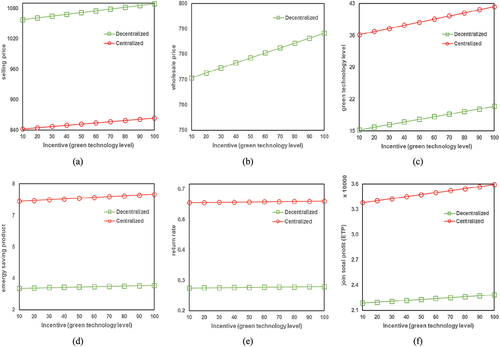
Figure 4. The impact of the energy-saving product incentive on the decision variables and supply chain profit.
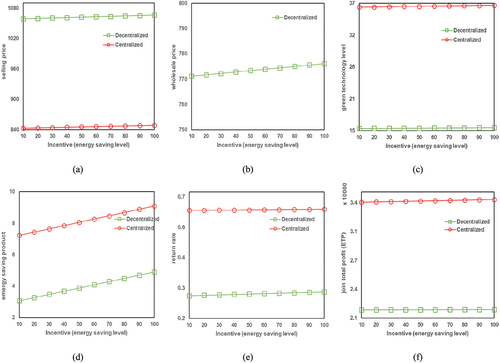
Figure 5. The impact of the carbon tax on the decision variables and supply chain profit.
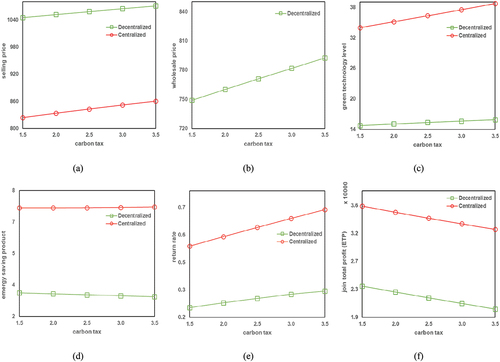
Figure 6. The computational results for the decentralized supply chain with GRIS and ERIS contract.
shows that the government subsidies on green technology levels have a major impact on the overall profit of the supply chain. High government incentive leads to higher total profit of the supply chain. When the government subsidy for green technology (Is) increases, in order to obtain further incentives, the manufacturer would increase the green technology level and at the same time increasing the market demand. In order to increase it, the manufacturer needs to make a higher investment on the green technology level which also increases the wholesale price. Consequently, a higher wholesale price also increases the selling price of the retailer in order to maintain its profit. Although the energy product level and the return rate slightly increase, we understand that Is does not have a great impact on these variables. Under centralized decision-making, the level of green technology and total profit are also higher, and increases at the same rate in both decision-making forms. Moreover, the whole profit of the supply chain can be increased by the manufacturer and the retailer by using RIS contract that coordinates the profit-sharing of each supply chain player.
When the incentive for the energy-saving product (IE) increases, the energy-saving product level, wholesale price, and the selling price increase, while the green technology level and the return rate remain unchanged. An increase in IE also leads to an insignificant increase in the supply chain total profit. A large amount of energy-saving product incentive urges the manufacturer to increase its energy-saving product investment and wholesale price to increase its energy-saving product level and gain more subsidies. The retailer also adjusts its selling price against the manufacturer’s wholesale price. Simultaneously, along with the increase of the energy-saving product level, the market demand also increases. This implies that the energy-saving incentives play a positive role in the supply chain. Moreover, the energy-saving level is greatest under the centralized scenario. The influence of IE on decision variables and the total profit of the supply chain is shown in Figure .
When we analyze the effect of the carbon tax (cx) on the proposed model, we observe that it has a significant effect on the system’s optimal solution. As carbon tax increases, the selling price, the wholesale price, the green technology level, and the return rate increase, while the energy-saving level decrease slightly. Increasing the carbon tax urges the manufacturer to invest more in green technology level to decrease the carbon emissions emitted from the production process. An increase in carbon tax also encourages the manufacturer to use more used items than producing new products from raw materials. This leads to an increase in the wholesale price and selling price, respectively. However, the manufacturer needs to pay each unit of the remaining carbon emissions emitted therefore causing a decrease in the manufacturer’s profit and total profit of the supply chain accordingly. The influence of cx on decision variables and the total profit of the supply chain is shown in Figure .
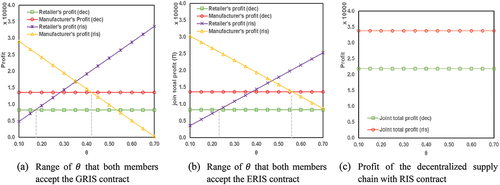
The influence on equilibrium outcomes to manufacturer and retailer profits by the contract parameter is seen in Figure . As shown in Figure , the manufacturer’s contract coordination decreases with increasing θ whereas the retailer’s contract coordination increases instead. The gray lines indicate the positions of A and B represent the lines on which the value surface intersects. In Figure we observe that the manufacturer’s profit under the RIS contract is higher than decentralized decision-making when the value of θ is greater than 0.42, whereas the retailer’s profit is less than the decentralized scenario when the value of θ close to 0.18. Therefore, we suggest that the RIS ratio for both the manufacturer and retailer should be in the range of [0.18, 0.42] to accept the sharing contract. Our analysis also suggested that in Figure the RIS contract provides a higher profit for the manufacturer than the decentralized decision-making when the value of θ is greater than 0.56, while the retailer’s profit is less than the decentralized scenario when the value of θ close to 0.23. Therefore, we suggest that the RIS ratio for both the manufacturer and retailer should be in the range of [0.23, 0.56] to accept the sharing contract.
5. Managerial insights and practical implications
This study presents some important insights on managing the coordination between parties in CLSC system. We incorporated important factors that can be found in real system such as carbon emissions, green technology, energy saving, collection efforts, inspection errors and remanufacturing. In particular, the developed model considers sustainability investment, which is closely related to efforts to reduce emissions, save energy and reuse products. The proposed model can help the managers to determine the most suitable coordination mechanism for CLSC such that the total profit is maximized. Our findings indicate that the centralized policy results in higher total profit than the decentralized policy. Under centralized policy, the parties in CLSC share information required to manage supply chain. In practice, it is not easy to take a central action to encourage the parties to agree with the centralized policy. Thus, here we propose two types of revenue and investment-sharing contract to coordinate the CLSC. The GRIS contract assists managers to determine the feasible proportion of the surplus profit sharing in a condition where the retailer agrees to take part in the green technology investment. The ERIS contract provides a guidance for managers to share the surplus profit in a condition when the retailer agrees to take part in the energy saving investment. With the proposed contracts, the total profit obtained by each party can be greater than the total profit of a decentralized policy. In addition to being able to improve the total profit of decentralized policy, the proposed contract is also able to improve the sustainable performance of the supply chain. This can be seen from the increase in the green level, product saving level, and the rate of return of used products. Our findings show that the involvement of the retailer in the sustainable investment made by the manufacturer will have a positive impact on the economic performance, which is indicated by an increase in profits. This can happen because the manufacturer will provide a lower price as compensation for the retailer’s involvement in the investment.
The model also assists the managers to make an effective plan for their manufacturing system, especially when dealing with imperfect inspection process. Where there is a risk of error in categorizing used products, the managers need to carefully determine the remanufacturing and regular production capacity required to meet demand. To reduce the errors, the investment on inspection may be required to improve the capability of inspector to classify the products. In addition, the number of used products that must be collected from the market needs to be determined carefully so that shortages of materials for remanufacturing can be avoided. In this condition, investment in collection efforts is needed to manage the number of products collected. In the efforts to collect the product from the market, the managers need to pay more attention to control the quality of the used products. When the quality is low, it may not be possible to remanufacture which leads to a higher waste disposal cost.
Our findings also reveal that the government interventions on manufacturer investments give significant improvement on the sustainability level and total profit of the supply chain. The incentives encouraged manufacturers to increase the green level, energy saving level, and reuse level of the manufacturing system. Since each industry has different capabilities and limits, the government needs to be careful in determining the amount of incentives and target levels. For example, large carbon emitting industries, with limited financial budgets, need to receive greater priority and supports than industries without financial constraints. In the early stages of implementing the incentive policy, the target set does not need to be so high, in order to attract industrial companies to engage in such investments. Furthermore, our results show that the carbon tax policy gives significant impact on the prices, green technology level, return rate, and the system’s total profit. Seeing the magnitude of the impact caused by these tax changes, managers need to carefully adjust the operational decisions to maximize the CLSC performance. The results also prove that the implementation of a carbon tax has a positive impact on CLSC’s sustainability performance, in the form of reducing emissions and increasing remanufactured products.
6. Conclusions and outlook
This paper contributes to the current CLSC literature by (a) investigating the effects of green technology investment, take-back investment and energy saving investment on CLSC performance, (b) incorporating government interventions, in terms of incentives policy and carbon tax regulation, in CLSC involved of manufacturer and retailer (c) proposing GRIS and ERIS contracts as mechanism to coordinate the parties in CLSC. We also examine the influence of inspection errors on the remanufacturing, production and waste disposal processes. The objective of the proposed model is to obtain the optimal retail price, wholesale price, collection rate, green level and energy saving level such that the total profit of CLSC can be maximized. The solutions obtained are compared under three scenarios, which are centralized policy, decentralized policy, and coordination scenarios. The important findings are described as follows:
We observed that the centralized decision-making can better-maximizing decision variables and the total profit for energy-saving products than a decentralized system. However, the retail price in decentralized decision-making was so much higher. Hence, the RIS contract improved the supply chain and lead to an increase in profit and lower carbon emissions.
When perfect coordination is obtained by the RIS contract, the contract parameter ranges can be derived. This to guarantee that the contract is beneficial for both players and accepting the cooperation.
The implementation of two RIS contracts depends on the conditions. GRIS contract is better utilized when the influence of carbon emissions footprint on the market demand, the carbon tax, and the carbon emissions incentives are relatively high. Whereas, an ERIS contract improves the profitability of the supply chain better when the consumer awareness of the energy-saving products and energy-saving incentives are high enough.
An increase in the incentives either in green technology level, energy-saving level, or return rate not only increases the profit of the supply chain but also facilitates the enhancement of green technologies, energy-saving product, and recycle process, respectively.
Since the manufacturer is the main carbon producer, an increase in carbon tax decreases the manufacturer ‘s profit and lowers the total profits of the supply chain. Thus, encourage the manufacturer to minimize his/her carbon footprint, but on the other hand, too high a carbon tax also results in the detainment of manufacturers to invest more in green technologies innovation.
There are some important aspects of the research remain for future research. Our research did not consider the influence of the contract coordination on the supply chain under competitive conditions, so future research should consider a situation where two or more manufacturers and retailers are competing. This study presumed that both players know all information. However, in a real system, there is some information that the other party did not learn, such as market conditions whereas the manufacturer had less information than the retailer. Therefore, it will be interesting to consider how asymmetric information influence decision-making. Furthermore, in order to create real-life conditions, the future study can be done by considering some important aspects, such as uncertainty, risks and imperfect production.
Disclosure statement
No potential conflict of interest was reported by the authors.
Additional information
Funding
References
- Bai, Q., Gong, Y., Jin, M., & Xu, X. (2019). Effects of carbon emission reduction on supply chain coordination with vendor-managed deteriorating product inventory. International Journal of Production Economics, 208, 83–30. https://doi.org/10.1016/j.ijpe.2018.11.008
- Bai, Q., Xu, J., & Chauhan, S. (2020). Effects of sustainability investment and risk aversion on a two-stage supply chain coordination under a carbon tax policy. Computers & Industrial Engineering, 142, 106324. https://doi.org/10.1016/j.cie.2020.106324
- Bazan, E., Jaber, M. Y., & Zanoni, S. (2017). Carbon emissions and energy effects on a two-level manufacturer-retailer closed-loop supply chain model with remanufacturing subject to different coordination mechanisms. International Journal of Production Economics, 183, 394–408. https://doi.org/10.1016/j.ijpe.2016.07.009
- Cheng, P., Ji, G., Zhang, G., & Shi, Y. (2022). A closed-loop supply chain network considering consumer’s low carbon preference and carbon tax under the cap-and-trade regulation. Sustainable Production and Consumption, 29, 614–635. https://doi.org/10.1016/j.spc.2021.11.006
- De, M., & Giri, B. C. (2020). Modelling a closed-loop supply chain with a heterogeneous fleet under carbon emission reduction policy. Transportation Research Part E: Logistics and Transportation Review, 133, 101813. https://doi.org/10.1016/j.tre.2019.11.007
- Dou, G., & Cao, K. (2020). A joint analysis of environmental and economic performances of closed-loop supply chains under carbon tax regulation. Computers & Industrial Engineering, 146, 106624. https://doi.org/10.1016/j.cie.2020.106624
- Hafezalkotob, A. (2017). Competition, cooperation, and coopetition of green supply chains under regulations on energy saving levels. Transportation Research Part E: Logistics and Transportation Review, 97, 228–250. https://doi.org/10.1016/j.tre.2016.11.004
- Hosseini-Motlagh, S. M., Ebrahimi, S., & Zirakpourdehkordi, R. (2020b). Coordination of dual-function acquisition price and corporate social responsibility in a sustainable closed-loop supply chain. Journal of Cleaner Production, 251, 119629. https://doi.org/10.1016/j.jclepro.2019.119629
- Hosseini-Motlagh, S.-M., Johari, M., Ebrahimi, S., & Rogetzer, P. (2020c). Competitive channels coordination in a closed-loop supply chain based on energy-saving effort and cost-tariff contract. Computers & Industrial Engineering, 149, 106763. https://doi.org/10.1016/j.cie.2020.106763
- Hosseini-Motlagh, S.-M., Nami, N., & Farshadfar, Z. (2020a). Collection disruption management and channel coordination in a socially concerned closed-loop supply chain: A game theory approach. Journal of Cleaner Production, 276, 124173. https://doi.org/10.1016/j.jclepro.2020.124173
- Hosseini-Motlagh, S.-M., Nematollahi, M., & Ebrahimi, S. (2022). Tri-party reverse supply chain coordination with competitive product acquisition process. Journal of the Operational Research Society, 73(2), 382–393. https://doi.org/10.1080/01605682.2020.1824550
- Hosseini-Motlagh, S.-M., Nouri-Harzfili, M., Choi, T. M., & Ebrahimi, S. (2019). Reverse supply chain systems optimization with dual channel and demand disruptions: Sustainability, CSR investment and pricing coordination. Information Sciences, 503, 606–634. https://doi.org/10.1016/j.ins.2019.07.021
- Jauhari, W. A. (2016). Integrated vendor-buyer model with defective items, inspection error and stochastic demand. International Journal of Mathematics in Operational Research, 8(3), 342–359. https://doi.org/10.1504/IJMOR.2016.075520
- Jauhari, W. A., Adam, N. A. F. P., Rosyidi, C. N. R., Pujawan, I. N. P., & Shah, N. H. (2020). A closed-loop supply chain model with rework, waste disposal, and carbon emissions. Operations Research Perspectives, 7, 100155. https://doi.org/10.1016/j.orp.2020.100155
- Jauhari, W. A., Pujawan, I. N., & Suef, M. (2021). A closed-loop supply chain inventory model with stochastic demand, hybrid production, carbon emissions, and take-back incentives. Journal of Cleaner Production, 320, 128835. https://doi.org/10.1016/j.jclepro.2021.128835
- Jauhari, W. A., & Wangsa, I. D. (2022). A manufacturer-retailer inventory model with remanufacturing, stochastic demand, and green investments. Process Integration and Optimization for Sustainability, 6(2), 253–273. https://doi.org/10.1007/s41660-021-00208-0
- Kazancoglu, Y., Yuksel, D., Sezer, M. D., Mangla, S. K., & Hua, L. (2022). A green dual-channel closed-loop supply chain network design model. Journal of Cleaner Production, 332, 130062. https://doi.org/10.1016/j.jclepro.2021.130062
- Kim, T., Glock, C. H., & Kwon, Y. (2014). A closed-loop supply chain for deteriorating products under stochastic container return times. Omega, 43, 30–40. https://doi.org/10.1016/j.omega.2013.06.002
- Koo, P.-H. (2022). A capacity cost-sharing contract for a two-stage supply chain with a risk-averse supplier under a bargaining power. Sustainability, 14(4), 2279. https://doi.org/10.3390/su14042279
- Krug, Z., Guillaume, R., & Battaïa, O. (2020). Exploring the opportunities in establishing a closed-loop supply chain under uncertainty. International Journal of Production Research, 59(5), 1606–1625. https://doi.org/10.1080/00207543.2020.1808259
- Li, X., & Li, Y. J. (2017). On green market segmentation under subsidy regulation. Supply Chain Management, 22(3), 284–294. https://doi.org/10.1108/SCM-11-2015-0425
- Li, B., Wang, Z., Wang, Y., Tang, J., Zhu, X., & Liu, Z. (2018). The effect of introducing upgraded remanufacturing strategy on OEM’s decision. Sustainability, 10(3), 828. https://doi.org/10.3390/su10030828
- Liu, Z., Anderson, T. D., & Cruz, J. M. (2012). Consumer environmental awareness and competition in two-stage supply chains. European Journal of Operational Research, 218(3), 602–613. https://doi.org/10.1016/j.ejor.2011.11.027
- Lotfi, R., Kargar, B., Hoseini, S. H., Nazari, S., Safavi, S., & Weber, G. W. (2021c). Resilience and sustainable supply chain network design by considering renewable energy. International Journal of Energy Research, 45(12), 17749–17766. https://doi.org/10.1002/er.6943
- Lotfi, R., Kargar, B., Rajabzadeh, M., Hesabi, F., & Ozceylan, E. (2022a). Hybrid fuzzy and data-driven robust optimization for resilience and sustainable health care supply chain with vendor-managed inventory approach. International Journal of Fuzzy Systems, 24(2), 1216–1231. https://doi.org/10.1007/s40815-021-01209-4
- Lotfi, R., Nazarpour, H., Gharehbaghi, A., Sarkhosh, S. M. H., & Khanbaba, A. (2022b). Viable closed-loop supply chain network by considering robustness and risk as a circular economy. Environmental Science and Pollution Research. https://doi.org/10.1007/s11356-022-20713-0
- Lotfi, R., Safavi, S., Gharehbaghi, A., Ghaboulian Zare, S., Hazrati, R., & Weber, G. W. (2021b). Viable supply chain network design by considering blockchain technology and cryptocurrency. Mathematical Problems in Engineering, 7347389. https://doi.org/10.1155/2021/7347389
- Lotfi, R., Sheikhi, Z., Amra, M., AliBakhshi, M., & Weber, G. W. (2021a). Robust optimization of risk-aware, resilient and sustainable closed-loop supply chain network design with Lagrange relaxation and fix-and-optimize. International Journal of Logistics Research and Applications, 1–41. https://doi.org/10.1080/13675567.2021.2017418
- Luo, R., Zhou, L., Song, Y., & Fan, T. (2022). Evaluating the impact of carbon tax policy on manufacturing and remanufacturing decisions in a closed-loop supply chain. International Journal of Production Economics, 245, 108408. https://doi.org/10.1016/j.ijpe.2022.108408
- Marchi, B., Zanoni, S., & Jaber, M. Y. (2021). Credit-dependent demand in a vendor-buyer model with a two-level delay-in-payments contract under a consignment-stock policy agreement. Applied Mathematical Modelling, 99, 585–605. https://doi.org/10.1016/j.apm.2021.07.002
- Mogale, D. G., De, A., Ghadge, A., & Aktas, E. (2022). Multi-objective modelling of sustainable closed-loop supply chain network with price-sensitive demand and consumer’s incentives. Computers & Industrial Engineering, 168, 108105. https://doi.org/10.1016/j.cie.2022.108105
- Moon, W., Florkowski, W. J., Bruckner, B., & Schonhof, I. (2002). Willingness to pay for environmental practices: Implications for eco-labeling. Land Economics, 78(78), 88–102. https://doi.org/10.2307/3146925
- Nouri, M., Hosseini-Motlagh, S. M., & Nematollahi, M. (2021). Proposing a discount policy for two-level supply chain coordination with periodic review replenishment and promotional efforts decisions. Operational Research, 21(1), 365–398. https://doi.org/10.1007/s12351-018-0434-x
- Prakash, S., Kumar, S., Soni, G., Jain, V., & Rathore, A. P. S. (2020). Closed-loop supply chain network design and modelling under risks and demand uncertainty: An integrated robust optimization approach. Annals of Operations Research, 290(1–2), 837–864. https://doi.org/10.1007/s10479-018-2902-3
- Rizky, N., Wangsa, I. D., Jauhari, W. A., & Wee, H. M. (2021). Managing a sustainable integrated inventory model for imperfect production process with type one and type two errors. Clean Technologies and Environmental Policy, 23(9), 2697–2712. https://doi.org/10.1007/s10098-021-02194-w
- Saga, R. S., Jauhari, W. A., Laksono, P. W., & Dwicahyani, A. R. (2019). Investigating carbon emissions in a production-inventory model under imperfect production, inspection errors and service-level constraint. International Journal of Logistics Systems and Management, 34(1), 29–55. https://doi.org/10.1504/IJLSM.2019.102062
- Shao, L. L., Yang, J., & Zhang, M. (2017). Subsidy scheme or price discount scheme? Mass adoption of electric vehicles under different market structures. European Journal of Operational Research, 262(3), 1181–1195. https://doi.org/10.1016/j.ejor.2017.04.030
- Shekarian, E., Marandi, A., & Majava, J. (2021). Dual-channel remanufacturing closed-loop supply chains under carbon footprint and collection competition. Sustainable Production and Consumption, 28, 1050–1075. https://doi.org/10.1016/j.spc.2021.06.028
- Soleimani, H., Chhetri, P., Fathollahi-Fard, A. M., Mirzapour Al-e-Hashem, S. M. J., & Shahparvari, S. (2022). Sustainable closed-loop supply chain with energy efficiency: Lagrangian relaxation, reformulations and heuristics. Annals Operations Research. https://doi.org/10.1007/s10479-022-04661-z
- Stiglic, M., Agatz, N., Savelsbergh, M., & Gradisar, M. (2015). The benefits of meeting pointing points in ride-sharing systems. Transportation Research Part B, 82, 36–53. https://doi.org/10.1016/j.trb.2015.07.025
- Sun, L., Cao, X., Alharthi, M., Zhang, J., Taghizadeh-Hesary, F., & Mohsin, M. (2020). Carbon emission transfer strategies in supply chain with lag time of emission reduction technologies and low-carbon preference of consumers. Journal of Cleaner Production, 264, 121664. https://doi.org/10.1016/j.jclepro.2020.121664
- Wang, Z., Li, B., Zhu, X., Xin, B., & Wang, Y. (2018). The impact of donation subsidy of remanufactured products on Manufacturer’s pricing-production decisions and performances. Journal of Cleaner Production, 202, 892–903. https://doi.org/10.1016/j.jclepro.2018.08.223
- Wang, Z., & Wu, Q. (2021). Carbon emission reduction and product collection decisions in the closed-loop supply chain with cap-and-trade regulation. International Journal of Production Research, 59(14), 4359–4383. https://doi.org/10.1080/00207543.2020.1762943
- Wang, X., Zhu, C., & Yuan, Y. (2019). Decision of energy-saving and emission-reduction in textile industry based on supply chain. Journal of Textile Research, 40(1), 166–174. https://doi.org/10.13475/j.fzxb.20180305309
- Wu, H., Xu, B., & Zhang, D. (2019). Closed-loop supply chain network equilibrium model with subsidy on green supply chain technology investment. Sustainability, 11(16), 4403. https://doi.org/10.3390/su11164403
- Xie, G. (2015). Modelling decision processes of a green supply chain with regulation on energy saving level. Computers & Operations Research, 54, 266–273. https://doi.org/10.1016/j.cor.2013.11.020
- Xie, G. (2016). Cooperative strategies for sustainability in a decentralized supply chain with competing suppliers. Journal of Cleaner Production, 113, 807–821. https://doi.org/10.1016/j.jclepro.2015.11.013
- Xin, S., Zhou, Y., Zhu, X., Li, L., & Chen, X. (2019). Optimal decisions for carbon emission reduction through technological innovation in a hybrid-channel supply chain with consumers’ channel preferences. Discrete Dynamics in Nature and Society, 4729358. https://doi.org/10.1155/2019/4729358
- Xue, J., Gong, R., Zhao, L., Ji, X., & Xu, Y. (2019). A green supply-chain decision model for energy-saving products that accounts for government subsidies. Sustainability, 11(2209), 2209. https://doi.org/10.3390/su11082209
- Yang, Y., Goodarzi, S., Bozorgi, A., & Fahimnia, B. (2021). Carbon cap-and-trade schemes in closed-loop supply chains: Why firms do not comply? Transportation Research Part E: Logistics and Transportation Review, 156, 102486. https://doi.org/10.1016/j.tre.2021.102486
- Yang, L., Zhang, Q., & Ji, J. (2017). Pricing and carbon emission reduction decisions in supply chains with vertical and horizontal cooperation. International Journal of Production Economics, 191, 286–297. https://doi.org/10.1016/j.ijpe.2017.06.021
- Yuan, K. F., Ma, S. H., Gao, Y., & Gao, Y. (2015). Inventory decision-making models for a closed-loop supply chain system with different decision-making structures. International Journal of Production Research, 53(1), 183–219. https://doi.org/10.1080/00207543.2014.946160
- Zhang, X., & Yousaf, H. M. A. U. (2020). Green supply chain coordination considering government intervention, green investment, and customer green preferences in the petroleum industry. Journal of Cleaner Production, 246, 118984. https://doi.org/10.1016/j.jclepro.2019.118984
Appendix A
Substituting ,
,
, and
into Eq. (
), and after simplification, we have
where,
Taking the first partial derivatives of with respect to
,
,
, and
, we have
respectively. Taking the second partial derivatives of with respect to
,
,
, and
, we further have,
,
,
,
,
,
,
,
,
, and
. Let
be the Hessian matrix of
. We obtain
To ensure is jointly concave in
,
,
, and
, we check that,
The Hessian matrix is definitely negative under the above conditions and the optimal decision can be obtained through solving the first-order derivatives of Eq. (ETP) with respect to ,
,
, and
. Next, we solve the optimal selling price, green technology level, energy-saving level, and return rate from
,
,
, and
. From Eq. (A.2), (A.3), (A.4), and (A.5), Proposition 1 is obtained. Moreover, to ensure
, we solve
to yield the following expression:
Appendix B
Using the backward sequence of decisions, we first evaluate the retailer’s optimum decision and then derive the manufacturer’s equilibrium approaches. Using ,
,
, and
, we express Eq. (ETPr) as
For any values of ,
,
, and
, we take the first partial derivatives of
with respect to
, and have
Taking the second partial derivatives of with respect to
, we obtain that if
the total profit of the retailer in the decentralized system is a joint concave function of
.
Solving , we have the optimal selling price as
Substituting Eq. (B.3) into Eq (ETPm), we have the total profit of the manufacturer in the decentralized system as
From Eq. (B.4), we easily determine the optimal wholesale price, green technology level, energy-saving level, and collection rate. The first-order derivatives of Eq. (B.4) with respect to ,
,
, and
are
respectively.
Taking the second partial derivatives of with respect to
,
,
, and
, we further have,
,
,
,
,
,
,
,
,
, and
. Let
be the Hessian matrix of
. We obtain
To ensure is jointly concave in
,
,
, and
, we check that,
By setting the first-order derivatives equal to zero, from Eq. (B.5), (B.6), (B.7), and (B.8), we obtain the optimal ,
,
, and
and by substituting them into previous equations (Eq. B.4), Proposition (2) is obtained. Moreover, to ensure
, we solve
to yield the following expression:
Appendix C
Substituting ,
,
, and
into Eq. (
), to simplify it, we have
The first-order condition yield
Taking the second partial derivatives of with respect to
, we have
. This implies that
is jointly concave in
. Using coordination
, from Eq (Prc) and EquationEq. (C.2
(C.2)
(C.2) ), we have
The supply chain accepts the ERIS contract only when the profit of each member is greater or equal to that of the decentralized scheme, i.e., and
.
Appendix D
Rearranging Eq. () we have
The first-order condition yield
Taking the second partial derivatives of with respect to
, we have
. This implies that
is jointly concave in
. Using coordination
, from Eq (Prc) and EquationEq. (D.2
(D.2)
(D.2) ), we have
The supply chain accepts the ERIS contract only when the profit of each member is greater or equal to that of the decentralized scheme, i.e., and
.