
 ?Mathematical formulae have been encoded as MathML and are displayed in this HTML version using MathJax in order to improve their display. Uncheck the box to turn MathJax off. This feature requires Javascript. Click on a formula to zoom.
Abstract
Productivity has a significant impact on the success of a highway construction project. Furthermore, time and cost predictions are primarily based on previous productivity. Thus, reasonably accurate productivity forecasting is required to plan highway construction projects successfully. Predicting the productivity of construction operations, on the other hand, is difficult. Due to dynamic variations in productivity throughout construction, frequent and consistent time basis productivity forecasting is crucial for effective highway construction management. This study aimed to identify and examine the impact of critical factors on the productivity rate of highway construction earthwork activities. Given the dynamic and context-dependent nature of productivity, the study analyzed extensive literature and employed multiple embedded case studies to address the study’s stated aims. Based on cross-case and statistical analysis, it was found that the critical factors influencing soft excavation productivity rate were allowable working space or clearance width, working hours, and weather conditions (temperature, atmospheric pressure, and rainfall). In the case of hard excavation, the critical factors influencing productivity rate were terrain type, clearance width, working hours, and weather conditions (temperature and cloud cover).
1. Introduction
Construction productivity has a wide range of applications, each having different meanings and definitions within different contexts (Gundecha, Citation2012; Tsehayae, Citation2015). This is mainly because the development of this concept has gone through various processes in other industries (Hajikazemi et al., Citation2017). In the construction industry, productivity is mainly referred to as “labour productivity.” This is defined as units of work placed or produced per manhour (Halligan et al., Citation1994).
Poor construction productivity is one of the most daunting problems for the success of construction projects (Aoun, Citation2013); this will aggravate developing countries like Ethiopia, where there are scarce resources. Ensuring high productivity also improves economic well-being (Aoun, Citation2013). As a result, staying on track and enhancing productivity rates become critical to ensuring a project’s success. However, before improving productivity, one must first have a clear and reasonably accurate record of present productivity rate by collecting as-built productivity rate data from recently completed and ongoing projects so that to estimate reasonably accurate productivity rates, productivity affecting factors and their related impacts on productivity, which will aid in the development of reasonably accurate productivity rate models for future projects (Aoun, Citation2013; Flaten, Citation2015; Jiang & Wu, Citation2004; Woldesenbet, Citation2010).
The most reasonable and reliable production rates of highway activities will approach to the reality in determining the most probable construction duration. A realistic estimate improves management efficiency, reduces project completion delays, minimizes claims and disputes, reduces traffic disturbance to the public, and lowers overall project cost. In Ethiopia, there has been limited research into the factors that influence the productivity rates of highway construction activities. The Addis Abeba Roads Authority’s current standard productivity rate document does not consider the influence of productivity rate-controlling factors or provide tailored productivity rates for different site conditions. This is evidenced by a variation in the data with the actual production rate. As a result, it was astute at identifying the critical factors influencing the productivity rate of earthwork activities and studying their relationship with productivity rates so that schedulers and engineers could build a relatively realistic project duration. With this in mind, the study set out to investigate the relationships between factors influencing productivity rates and highway earthwork productivity rate; with the ultimate goal of assisting engineers in efficiently and effectively planning, executing, and managing highway projects in the context of project contract time determination by establishing a clear relationship between productivity rates and the dominant factors influencing; so that they takeover consideration of factors in their productivity estimations.
Researchers have long been concerned about the issues associated with increased productivity. Identifying and assessing the factors that affect productivity have long been critical concerns for project managers seeking to boost productivity in the construction industry (Mengistu et al., Citation2016). According to how one utilizes it, labour can be seen as both risk and opportunity (Hanna, 2011). It becomes an essential input throughout the production phase, accounting for between 20% and 50% of the entire project cost (Holt et al., Citation1998; Holt et al., Citation1997). In developing countries where a high amount of labor-intensive construction is customary, low productivity has been one of the reasons causing high labour costs compared to the construction costs. According to Alemu’s (Citation2006) research in Ethiopia, the average time spent on productive labor is just 56%, implying that 44% of the time is squandered on non-productive activity. A study conducted in the United States that calculated the average ratio of labor cost per mile over construction cost per mile discovered that labor accounts for around 20% of total construction costs for highway projects (Aoun, Citation2013). Based on the findings of Aoun (Citation2013) and Alemu (Citation2006), it is sensible to conclude that by outlining and identifying the factors that drive the productivity rate of highway earthwork activities, one may significantly reduce the cost of projects and attain a reasonable length of the project. In general, it is critical to control the productivity elements that contribute to the integrated components of production to reap the benefits of any building project. Moreover, the accuracy of productivity rate measurement is highly related to how successfully one identifies and uses the critical factors affecting the productivity rate.
Highway construction is one of the largest sectors of the construction industry. They are outdoor construction operations involving various activities heavily affected by various operational and environmental conditions. Working conditions in a highway construction site are very different from those in the manufacturing industry. Contrary to the manufacturing industry, in highway construction, it is widely recognized that productivity rates are affected by many factors. Such as weather, project size and type, geographical location, site conditions, terrain type, influence of the learning curve, urban or rural setting, worksite constraints, skills of the construction crew, equipment efficiency and workability condition of materials, competency in supervision, completeness of working drawings, communication between construction parties, change orders, late payments, management (poor or exemplary), labour organizations. Such factors either speed up or slow down the productivity of an activity. However, project managers and schedulers typically rely on previous productivity rate charts as their primary source to estimate productivity rates. The main limitation of these approaches is that they are not data-driven and subjective; additionally, the relative nature of labour productivity to the unique project factors and site conditions cannot be considered quantitatively in such estimations. In general, one must measure after clearly understanding and identifying parameters that affect productivity (Dozzi & AbouRizk, Citation1993; Kisi, Citation2015).
Ethiopia’s construction industry is plagued by delays and cost overruns, with low labor productivity being a key culprit (Mengistu et al., Citation2016; Zewdu & Aregaw, Citation2015). Poor productivity data can also mean the difference between a company submitting a winning bid and losing a job to a competent cheaper bidder. Furthermore, low productivity will lead to poor performance and an inability to meet contractual obligations. This causes inconvenient delays for the public, raises concerns about roadway safety, raises costs for the owner, taxpayers, and contractors, and jeopardizes the company’s competitiveness for future projects (Flaten, Citation2015).
Nevertheless, several works of literature noted the importance of the estimation of reasonably accurate productivity rates (Aoun, Citation2013; Flaten, Citation2015; Jiang & Wu, Citation2004; Woldesenbet, Citation2010), limited research exists to provide concrete empirical data on productivity levels within construction projects (Aoun, Citation2013; Flaten, Citation2015; Kisi, Citation2015; Woldesenbet, Citation2010). This calls for more empirical research on real-life cases to build a solid foundation for further research within this field. Particularly in Ethiopia, the study could not find previous research studies on productivity rate estimation. Accordingly, this study stands to fill this gap. It should be remarked that the level of productivity is context-dependent and varies across different countries and different types of projects. Consequently, it is essential to consider this when measuring and comparing productivity levels.
Previous research has attempted to identify and account for the range of factors that affect construction productivity performance. For example, (Kisi, Citation2015) reviewed and selected sixty-one (61) factors that affect construction productivity from four top engineering and management-focused journalsFootnote1 from 1985–2015; among them, 14 factors were selected and studied as the top factors that affect the productivity rates of construction activities. They were technical factors, management factors, site conditions, environmental conditions, scheduling issues, coordination issues, change orders, project characteristics, labor characteristics, external conditions, non-productive activities, unavailability of suitable equipment, material factors, and safety factors. The study (Woldesenbet, Citation2010) also identified the significant factors affecting highway construction activities. Based on the statistical analysis, it was concluded that the significant factors that affect the productivity rate of highway construction activities were weather conditions, the geographic location of highway projects, traffic condition; the quantity of work; and soil type for earthwork activities. In addition, the type of route, number of lanes, and type of roadway were significant factors affecting production rates.
2. Research methods
The way a researcher approaches the study design is influenced heavily by the assumptions and basic belief systems that represent the underlying positions (Shkedi, Citation2005). The research primarily reflects the utilitarian/pragmaticFootnote2 standpoint. The researcher believes that objective experiments and quantitative measures best address the problem in this study. A pragmatic standpoint positioning response to the research questions and belief of objectivity posed an embedded multiple-case approach to conducting research.
For the aim outlined in this study, an embeddedFootnote3 multiple case study design offered the opportunity to explore the nature of productivity rates through a deductive,Footnote4 post-positivismFootnote5 paradigm lens while also applying a quantitative researching approaches to collect potential factors affecting productivity rate and interpret the results (establish a statistical relationship).
A carefully established rationale guided the selection of multiple embedded case study design, the fact that this study (a) required a holistic case study, this means undivided attention should be given for selected cases or sites, (b) involved more than one bounded case which means the need for to study multiple cases or sites, (c) qualified as being explanatory in approach which makes case study approach preferable and (d) sought to understand the relationships between factors and productivity rates, which is embedded phenomenon; this means the fact that the presence of multivariate factors that affect production rates.
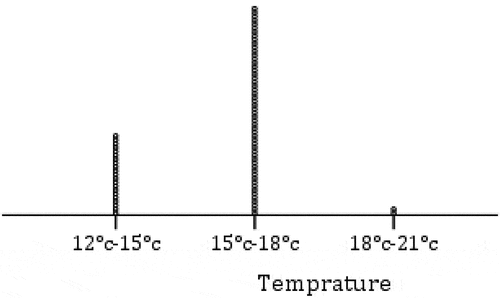
Descriptive statistics were also employed to analyze central tendencies and summarize data such as mean, sum, counts, and frequency of variables. Variables are classified into a continuous (also called a quantitative variable) and nominal variable (also called a qualitative variable). For instance, temperature, annual average daily traffic (AADT), and production rate are continuous variables in this study as they take quantitative form. In contrast, the type of soil, seasonal changes, type of roadway, type of route, and the number of lanes are categorical. In contrast, the type of roadway is considered nominal. It takes the form of either concrete, asphalt, or a combination of concrete and asphalt.
2.1. The case study protocol: planning for data collection
A data collection protocol plan was developed to ensure the consistency, effectiveness, and validity of the data collected. Upon finalizing the data process and tools, a pseudo-code data collection effort was carried out to test the process and tools. Further adjustments to the process and tools are also considered in the pseudo-code pilot research to improve the effectiveness of data collection. A data collection protocol was followed for field-level observation and data collection for all variables identified from the literature review and suspected as critical factors.
2.1.1. Historical highway project data
Once the significant highway activities and factors are identified, a collection of productivity rate data of these activities was made through selected highway projects, either ongoing or recently completed highway projects (historical records), specifically Daily WorkReports (DWRs). The DWRs was reviewed line by line to determine the quantity of work and duration for the selected controlling highway activities. Consequently, weather factors like daily average temperature, rainfall amount, the width of clearance, and working hours were also identified manually.
2.1.2. Observations
In this study, the observation was utilized to confirm the DWRs and identify significant parameters influencing productivity rates. The detached, objective observation technique was the favored observation technique in the positivistic quantitative research approach. The rationale behind the utilization of objective guided observation was guided by the fact that it increases the validity of the data by limiting the influence of Social Desirability BiasFootnote6 and assumptions.
2.2. Data collection and analysis method
Expert knowledge and experience in construction activities, combined with historical data and detailed work studies, can be used to estimate productivity rates (Portas & AbouRizk, Citation1997). However, experience and knowledge usually reside with the estimator, who may not thoroughly understand the work and may not identify the controlling factors influencing productivity. Furthermore, the accuracy and dependability of this method are influenced by personal bias and can be highly subjective (Malisiovas, Citation2010). This makes the expert-driven predation technique unappropriated to the set forth belief, post-positivist.
Even though works of literature employed the artificial neural network technique for the prediction of productivity rates in a highway construction activity (Sonmez & Rowings, Citation1998; Portas & AbouRizk, Citation1997; Cheng & Titterington, Citation1994; Karshenas & Feng, Citation1992), this method doesn’t sufficiently incorporate the effect of the learning curve and the time factor in predicting productivity of ongoing operations by analyzing productivity’s dynamic and stochastic behavior (Hwang & Liu, Citation2010). And the other aspect is the size and quality of available data, which usually limit the effectiveness of the neural network approach. In addition, the practical application of neural networks is limited to actual construction activities. Hence, this technique is not suited for this study due to its drawbacks.
According to (Aoun, Citation2013; Woldesenbet, Citation2010; Jiang & Wu, Citation2007; Chong, Citation2005; Smith, Citation1999), the most commonly used analytical technique is statistical studies to determine the relevance of numerous factors that influence production rates. The statistical method is appropriate for quantitative factor analysis, fitting the optimal curve that fits the data and presenting the correlation between components in a mathematical model. Statistical methods include linear and nonlinear regression analysis, frequency plot, ANOVA, t-tests, and multiple regression modelling, which are used to determine & quantify the relationship between productivity rate and drivers in developing a model for highway construction activities or pay items.
Previous research also demonstrates how various researchers attempted to associate these factors with highway construction activities and used a variety of scientific methodologies to determine the production rates of these activities. Statistical methods are the most extensively utilized and consistent strategy in establishing production rates of highway construction operations among all scientific tools or methodologies used in determining production rates. Furthermore, statistical methods are more practical and applicable (Aoun, Citation2013; Woldesenbet, Citation2010; Jiang & Wu, Citation2007; Chong, Citation2005; Smith, Citation1999). Although simulation and other scientific approaches have been employed since the 1980s, they have been limited to cyclic construction activities and work tasks. outlines the scientific procedures or methodologies that have been utilized to determine production rates over the last five decades. As a result, this study used statistical approaches as a data analysis strategy.
Table 1. Scientific tools used in studying production rate of highway activities
2.3. Data analysis protocol
Once the data have been collected, it is helpful to produce a diagram or graph of those data—a “scatter plot” of the raw data. Such plots will aid in indicating the existence of the data distribution and the relationships between them, allowing suitable statistical techniques to be applied (Fellows & Liu, Citation2015). Therefore, in this research, the collected data were described with a box plot and scatter plot to visually represent the relationship between variables after classifying each factor into their respective categories and subdivisions.
2.3.1. Outlier data points detection protocol
Before analyzing the collected data, it is prudent to examine the reliability of the data itself. Therefore, excluding the outlier data points from the further analysis is unquestionable. Hence, procedures were followed to test and ban the outlier data points from the collected data set.
The procedures to identify and flag the outliers from the parent data set (Rp) were based on the Mahalanobis distance.Footnote7 The parent distribution data set has a mean element in the parent data set µ ∈ Rp and the covariance matrix Σ ∈ R p × p. Given a point x ∈ Rp, the square of the Mahalanobis distance (from x to the parent distribution) is:
After calculating the Mahalanobis distance of the total data set to maximize the accuracy of identifying outlier data points from the parent data set, a comparison of Mahalanobis with a chi-square distribution with the same degree of freedom was compared. The degree of freedom referred to and was found by the number of predictors of the linear regression analysis.
3. Analysis of the significance of factors
At this stage, the study quantified the significance of the candidate factors (identified critical factors). Before analyzing the significance, the researcher must know what kind of tests to consider. Those identified critical factors found to have no apparent relationship with the observed Production Rates were excluded from further analysis. Two analysis approaches were used for further significance analysis for those critical factors related to productivity rates.
The statistical t-test (pooled t-test) or ANOVA was used for categorical variables to test the difference in mean production rates after the descriptive analysis of factors is demonstrated with the help of box-plotting.
Regression analysis was used for continuous variables to explore the relationship between drivers and production rates after a descriptive analysis of factors is demonstrated with the help of scattered plot diagrams.
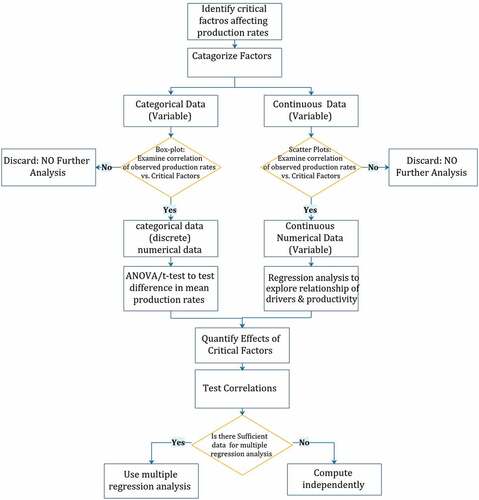
The quantitative effects of critical factors are now quantified. Besides, the correlations between critical factors of each controlling activity item were computed and later used as a reference for estimating the effects of multiple drivers. Multiple regression analysis was used for further investigation and interaction effects of multiple drivers if data is sufficient. Otherwise, the correlation was used as a basis for independent estimation after calculating the combined effect on productivity rate estimation. The flow chart in shows how the importance of productivity rate affecting factor analysis was determined.
Figure 1. Flow chart of factor analysis.
3.1. Case description
3.1.1. Case study I
The project is in the southeastern region of Addis Ababa within the Akaki—Kality Sub-city. The project is in the main entrance and exit of the city towards the southern part of Ethiopia, especially for freight transport from Djibouti. The road is a primary arterial street (PAS) located in a densely populated urban area.
3.2. Topography, climate, and geology
The project’s overall topography can be described as flat terrain with elevations ranging from 2185 m to 2060 m above sea level. A weathered volcanic rock underlies the project site. The surrounding rock formation is primarily made up of basaltic and trachybasalt, which are generated from a volcano and intrusive rocks metamorphosed to varying degrees. The soil is a lacustrine expansive black cotton soil.
According to meteorological rainfall and temperature data, the average minimum and maximum atmospheric temperatures are 9°C and 24°C, respectively. There are three months of heavy rain from June to mid-September, with an annual rainfall of more than 1000 mm.
3.2.1. Case study II
The project is located in Addis Abeba’s northeastern region, within the Bole Sub-city. The project is located in and is defined by a densely populated urban area.
3.3. Topography, climate, and geology
The project’s overall geography is described as flat terrain with elevations ranging from 2000 m to 2600 m above sea level. The project location is built on weathered volcanic rock. The rock formations surrounding the project area are mostly made of basaltic and trachybasalt produced from a volcano and intrusive rocks metamorphosed to varying degrees. The soil type is lacustrine expansive black cotton soil.
The mean minimum temperature varies from 10οc to 15°C, and the mean maximum temperature ranges from 20°C to 25°C. Three months of high rainfall from June to mid-September is encountered with a mean annual rainfall of 1000 mm.
3.3.1. Case study III
The project is located in Addis Abeba’s northeastern section, within the Bole Sub-city. The project is located in and is defined by a densely populated urban area.
3.4. Topography, climate, and geology
The overall topography of the project may be characterized by flat terrain with an elevation ranges from 2000 m to 2600 m above sea level. A weathered volcanic rock underlies the project site. The rock formation around the project area is mainly composed of basaltic and trachybasalt, derived from a volcano and intrusive rocks that have been metamorphosed to various degrees. Soil formation is lacustrine expansive black cotton soil.
The mean minimum temperature varies from 10°C to 15°C, and the mean maximum temperature varies from 20°C to 25°C. The area receives a mean annual rainfall of 1000 mm.
3.5. Topography, climate, and geology
The overall topography of the project may be characterized by flat terrain with an elevation ranges from 2000 m to 2600 m above sea level. A weathered volcanic rock underlies the project site. The rock formation around the project area is mainly composed of basaltic and trachybasalt, derived from a volcano and intrusive rocks that have been metamorphosed to various degrees. Soil formation is lacustrine expansive black cotton soil.
The mean minimum temperature varies from 10°C to 15°C, and the mean maximum temperature ranges from 20°C to 25°C. The area receives a mean annual rainfall of 1000 mm.
3.6. Case study-I finding narratives
3.6.1. Hard (rock) excavation
The full data correlation between the dependent variable (productivity rate) and the independent factors is shown in . The correlation table shows that none of the characteristics studied qualified as essential.
Table 2. Correlation table for hard (rock) excavation
3.6.2. Soft excavation
The study collected 172 productivity data points from daily work reports recorded on daily basics and eliminated 14 outliers as indicated earlier on the outlier data point detection technique. The scatter plot diagrams shown in the case I finding narratives were created from a daily recorded work report, with each unit representing an hourly output rate. Pearson correlations of 158 data points revealed that the duration of working hours and breadth of clearance are the only key criteria that have a significant link with the productivity rate of soft excavation of highway construction, as shown in .
Table 3. Correlation table for soft excavation
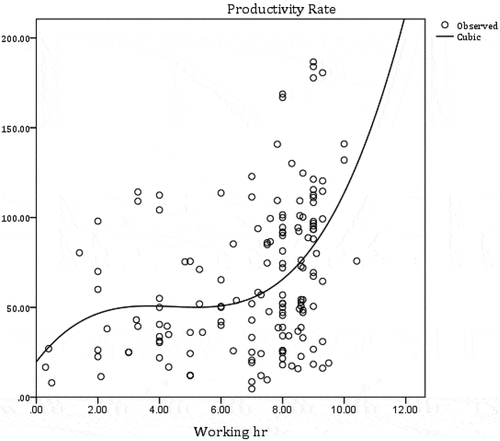
3.6.2.1. The impact of working hours on soft excavation productivity rate
The scatter plot diagram in was created using 158 productivity rate data points from a daily work report; the productivity rate of soft excavation climbs dramatically as the working hour increases during the first three hours, followed by a relatively stable rate until 7.5 hours. Then there is a significant increase in construction work, which ranges from 7.5 to 10.5 hours. This pattern can be explained by the fact that operations can be faster in the morning with fresh energy, followed by tiredness after 3 hours of labor, and then regains momentum after the break to complete the started task. Similar findings were found, with a 10% to 15% fall in productivity rates as working hours increased (Thomas & Raynar, Citation1997).
Figure 2. Effect of a working hour against productivity rate (soft excavation).
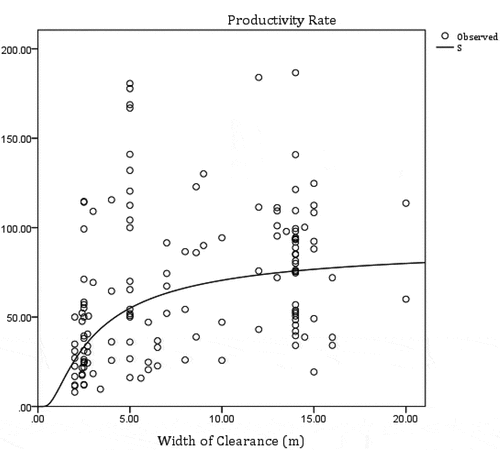
3.6.2.2. Effect of the width of clearance on the productivity rate of soft excavation
shows that as the allowable working width of clearance in a unit meter grows, so does the productivity rate of soft excavation. This is because larger working areas allow operators to work more efficiently, allowing them to traverse and operate machines more safely and efficiently when executing a soft excavation. This study verifies prior research findings (Nasirzadeh & Nojedehi, Citation2013) and (Ovarian & Popescu, Citation2001) that productivity drops with higher congestion or less permissible working space. Nonetheless, the general trend line of productivity rate increasing as working space in meters grows, as shown in below, is comparable; this is owing to the fact that other significant factors are also affecting the production rate at the same time. It is also possible that the most convenient method of navigating and operating equipment was established, allowing the excavation equipment to operate more safely and quickly.
Figure 3. Effect of allowable width of clearance on productivity rate (soft excavation).
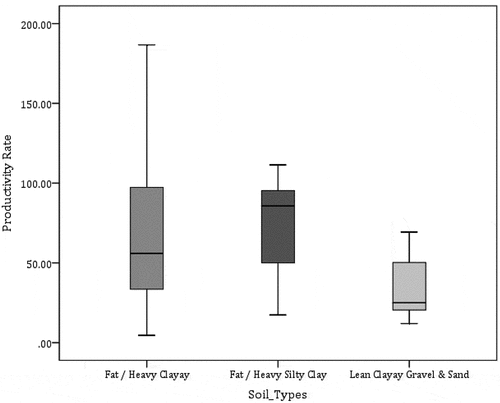
3.6.2.3. Effect of soil type on productivity rate of soft excavation
The Pearson correlation test and the whisker plotting diagram were used to analyze the effect of soil type on the productivity rate of soft excavation in highway construction. The ANOVA test yielded a significance level of 0.23, showing a significant link between soil type and productivity rate.
When the excavated soil type was lean clayey gravel & sand, the production rate increased. It was also lower when the soil type was fat or hard silty clay. illustrates the study’s graphical depiction. This conclusion contradicts the findings of (Woldesenbet, Citation2010). This can be explained by other factors predominantly influencing the soft excavation output rate.
Figure 4. Effect of soil type against productivity rate (soft excavation).
3.7. Case study II findings narrative
3.7.1. Hard (rock) excavation
The study gathered 177 productivity data points from daily work reports recorded on daily basics and excluded 11 outliers. The scatter plot diagrams demonstrated on case II finding narratives were also derived from a daily recorded work report, each assigned an hourly output rate unit. According to the correlation , the clearance width, gust wind, cloud cover, and atmospheric air pressure are critical factors influencing highway hard (rock) excavation.
Table 4. Correlation table for hard (rock) excavation
As the width of clearance or permissible working space increases, so does the productivity rate of hard (rock) excavation for highway construction. This finding supports prior research, such as that of (Nasirzadeh & Nojedehi, Citation2013) and (Oglesby et al., Citation1989), which indicated that productivity decreases as working space is reduced.
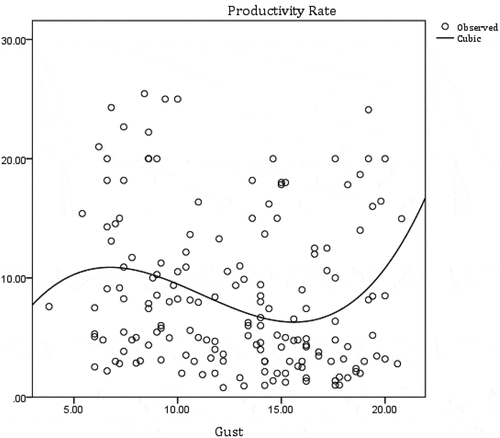
3.7.1.1. The effect of gust wind on the productivity rate on hard (rock) excavation
depicts the influence of gust wind (km/hr) on production rate; productivity rises first, then gradually drops until it rises again after around 15.5 km/hr. This can be explained by workers trying to protect themselves from a strong wind, which reduced production. The fact that the largest recorded amount of gust air was 21 km/hr, which is ideal, may explain why productivity has grown once more. This finding defies logical facts as well as prior research by (Nasirzadeh & Nojedehi, Citation2013) and (Oglesby et al., Citation1989). Consequently, it was concluded that either other relevant factors were having a greater impact than the blowing wind, or the limited number of data available for analysis was insufficient. As a result, no generalizations could be made for this factor.
Figure 5. Effect of a gust on productivity rate hard (rock) excavation).
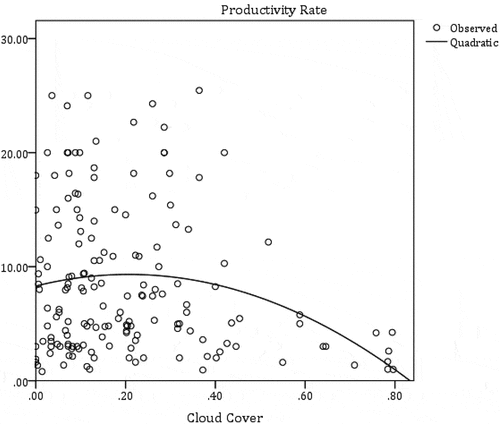
3.7.1.2. The effect of cloud cover on the productivity rate on hard (rock) excavation
Rock excavation productivity and cloud cover are inversely related. The fact was investigated in terms of visibility in kilometers; it is clear that when cloud cover intensifies, visibility drops and hard excavation output rates decrease. The visibility data was provided by the Ethiopian metrology agency, which was synchronized and checked using online metrological data and weather records. As illustrated in , as the proportion of cloud cover increases, visibility diminishes, affecting the workforce directly. Previous research (Nasirzadeh & Nojedehi, Citation2013; Oglesby et al., Citation1989) demonstrated how poor weather conditions affect productivity rate.
Figure 6. Effect of Cloud cover on productivity rate hard (rock) excavation).
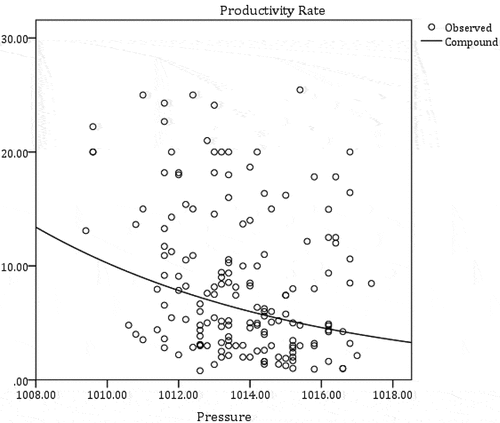
3.7.1.3. The effect of cloud cover on the productivity rate on hard (rock) excavation
According to the regression analysis in , a rise in atmospheric air pressure has a negative impact on hard (rock) excavation productivity. Nature can demonstrate this by arguing that bad weather reduces efficiency. Previous research (Nasirzadeh & Nojedehi, Citation2013; Oglesby et al., Citation1989) found similar results.
Figure 7. Effect of pressure on productivity rate hard (rock) excavation).
3.7.2. Soft excavation
The scatter plot diagrams shown on case III finding narratives were derived from a daily recorded work report, with each assigned an hourly output rate unit; shows the correlation between the dependent variable (productivity rate) and the independent variables chosen from the literature review. According to the table, the working hour, clearance distance, gust wind, cloud cover, and rainfall are the essential parameters that influence soft excavation of highway operations.
Table 5. Correlation table for soft excavation
Season was identified as a crucially impacting factor with a significance level of −0.55 in the correlation testing technique for nominal data types (T-test and spearman). However, the correlation testing approach revealed no significant link between the dependent and independent variables for the soil type factor. .
Another highway operation considered in this study was soft excavation during highway construction. According to the data, productivity increases when the working hour, width of clearance, or permissible working area, and gust rise. On the other hand, the productivity trend has decreased as cloud cover and rainfall have increased. This thesis is related to prior works of literature such as (Nasirzadeh & Nojedehi, Citation2013; Oglesby et al., Citation1989).
3.7.2.1. Effect of soil water content on productivity rate of soft excavation
Another aspect that exhibited a clear association with the productivity rate of soft excavation was the groundwater table level. shows that using T-test testing, the variable seasonal shift establishes a strong association between the seasonal and productivity rate of soft excavation of highway construction activities. The productivity rate was higher when the soil composition was fat or heavy silty clay, fat or heavy clay, and lean clayey gravel & sand. illustrates the study’s graphical depiction.
Figure 8. Effect of seasonal change against productivity rate (soft excavation).
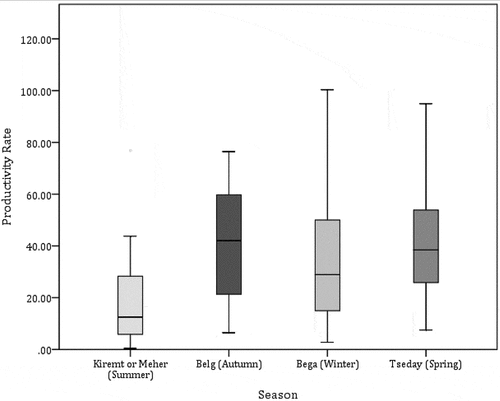
Table 6. A T-test on seasonal change with a productivity rate
shows that the maximum productivity rate was observed when the season was Belg (autumn). At the same period, productivity was lowest during the Kiremt or Meher seasons (summer). According to the analysis (summer), the productivity rate can vary up to 29.48 m3/hr when the season changes from Belg (fall) to Kiremt or Meher, according to the analysis (summer). This is explained by the impact of Kiremt (summer), which is marked by excessive rain.
3.8. Case study III findings narrative
3.8.1. Hard (rock) excavation
The scatter plot diagrams shown in the case III finding narratives were also created from a daily recorded work report, with each unit representing an hourly output rate. Working hours, temperature, and gust wind were found as significant elements impacting hard (rock) excavation of highway operations by the correlation between the productivity rate and the independent variables, as shown in .
Table 7. Correlation table for hard (rock) excavation
3.8.1.1. Effect of working hours and temperature on productivity rate of hard (rock) excavation
The productivity rate of hard (rock) excavation increased as the working hour rose by 27.64 percent up to roughly 3.5 hr. and then decreased by 15.24 percent between 3.5 hr and 8.5 hr before increasing by 3.77 percent. This trend could be explained by the fact that the process is faster in the morning with fresh vitality, followed by tiredness after several hours of work. This pattern contrasts with the findings of Case Study 1. This could be explained by factors other than working hours influencing output rates. Case studies in this result, on the other hand, demonstrate replication with the study (JD Borcherding & Alarcón, Citation1991; Thomas & Raynar, Citation1997).
Hard (rock) excavation productivity rose as temperature increased, according to the scattered plot figure in . The power regression equation reveals a 36.61 % increase in production when the temperature rises by 1°C. Previous research has indicated that the productivity rate falls as the temperature goes above a particular threshold. The productivity trend line against temperature factor shows an increase, as illustrated in , because the maximum temperature reported in the study data points was 18.2°C. This is further supported by the clustered scatter plot diagram demonstrated in . In , the trend of productivity rate peaks at temperatures about 15 °C—18 °C and gradually drops as the temperature rises. When the temperature falls below 15°C, it is possible to conclude that temperature has an effect on the productivity rate of highway excavation; however, it is prudent to consider other variables in conjunction with this variable, and the highest reported temperature level from a Pearson correlation test was 18.2 °C.
Figure 9. Effect of temperature on productivity rate hard (rock) excavation).
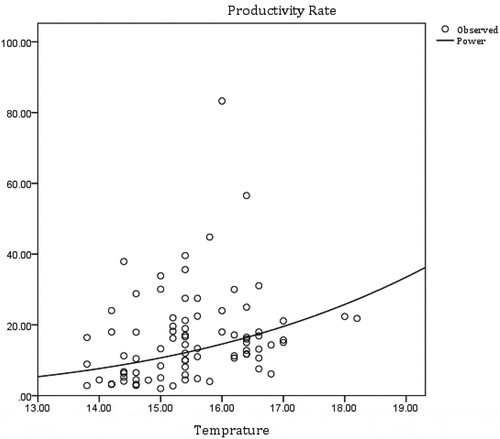
Figure 10. Grouped scatter plot of production rates.
3.8.2. Soft excavation
The important factors that were shown to have a substantial link are explained further below. The correlation between the dependent variable (productivity rate) and the independent factors chosen from the literature review is shown in below. According to the investigation results, the temperature was the only critical element affecting the soft excavation of highway activity.
Table 8. Correlation table for soft excavation
3.8.2.1. Effect of contractor type on productivity rate of soft excavation
A t-test was used to compare the means to see if there is a significant difference in production rates due to variances in the contractor’s manner of operation. According to the findings, as indicated in , the impact of variable contractor type is closely connected with highway hard (rock) excavation productivity rate. The impact of variable contractor type was also discovered to have a clear association with highway soft excavation productivity rate.
Table 9. T-test of productivity rate with contractor type for hard & soft excavation
On hard (rock) excavation, Contractor Type A has the highest productivity rate of the three contractors surveyed; however, this is not the case when soft excavation is considered. The same holds true for contractor type c, which ranks second in hard (rock) excavation but last in soft excavation. This could be due to approach or a contractor’s expertise in similar tasks. The survey found that the contractor’s production rate varied based on the operation.
In general, the study finds a substantial association between production rate and contractor type for both soft and hard highway earthwork excavation. The contractor’s output was inconsistent in terms of productivity rate for distinct operations. During the research of (Woldesenbet, Citation2010), this type of observation was made.
3.8.2.2. Effect of terrain type on productivity rate
A T-test comparing the mean production rates on the different types of terrain type was undertaken to study the effect of terrain type on the productivity rate of highway excavation. With a significance level of .000, the results revealed a high link between soft excavation and hard (rock) excavation productivity rate. Furthermore, as shown in , a bar chart comparison of different terrain types and the productivity rate of soft and hard (rock) excavation suggests that the productivity rate is more likely to increase in flat terrain type settings.
Figure 11. Comparison of production rate Vs. terrain type (hard excavation).
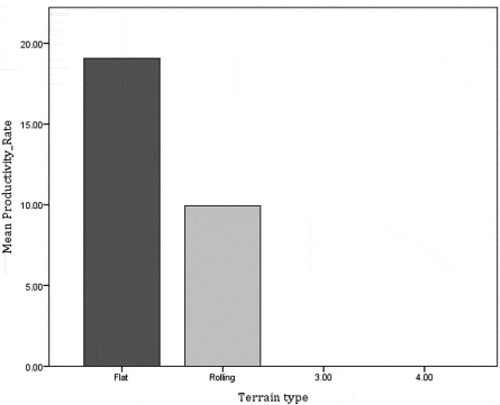
Figure 12. Comparison of production rate Vs.
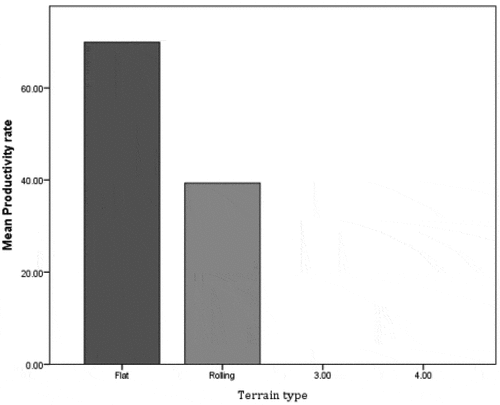
terrain type (soft excavation)
4. Summary of findings
According to the research of Healy and Perry (Citation2000), the quality requirements or validity for a post-positivist research paradigm include ensuring dependability, external and internal validity. In line with the positivist research tradition, validity has come to refer to the correspondence between empirical “facts” (evidence) and theoretical conceptions (Riege, Citation2003). Three types of validity criteria that are frequently used (Roland & Olaf, Citation2002): reliability, which ensures that correct operational measures for the concepts in use have been established so that another researcher can go in and repeat the case study; internal validity, which ensures that proper causal relationships have been established; and external validity, which demonstrates that the domain to which a study’s findings belong can be generalized.
Nonetheless, incorporating such validity criteria is essential; combining these validity criteria has been difficult (Bonoma, Citation1985; Dubois & Gadde, Citation2014). For instance, Bonoma (Citation1985) points to the trade-off that has to be made between internal validity, or “data integrity,” and external validity, as the closer the researcher gets to the subject of the study, the more difficult it becomes to compare data across categories.
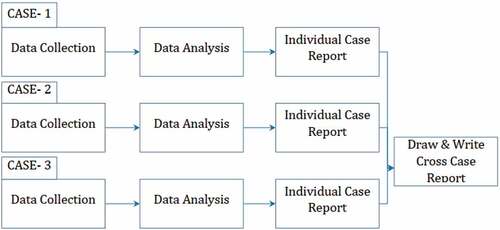
Following the preceding reasoning, this study independently used a within-level analysis in each case. Then the cross-case analysis phase was considered, as shown in below. The researcher seeks to build abstractions across cases (Merriam, Citation1998) and “a general explanation that fits each of the individual cases, even though the cases will vary in their details” (Yin, Citation1994). Hence, the study confirms the summaries of the findings through reliability, internal and external validity. A causal relationship between components and productivity rate has been established for the internal validity of the case study in order to construct an explanatory report and see if the cases corroborate with each other. Besides, to address the reliability of the findings, the study employed a carefully designed methodology, data from multiple sources (DWRs, SPDs—standard productivity rate document, and observations), and outlier data detection and elimination methods based on Mahalanobis distance as discussed in the research methods. And finally, a comparison of the case studies with themselves in a cross-case analysis manner and comparison against previous studies have been conducted to meet the external validity (generalization to the theory) of the case study as shown below.
Figure 13. Case study reporting.
4.1. Effect of the width of clearance on productivity rate
The factor width of clearance or allowable working space, according to Pearson correlation, has a significant impact on the productivity rate of highway earthwork activities. Working space has a beneficial effect on highway excavation productivity; as working space grows, so does the productivity rate for all case studies on both soft and hard (rock) excavation of highway construction. This was explained by the fact that when an operator’s allowable working space is enlarged, it allows them to maneuver and operate equipment more efficiently.
Based on prior research understandings like (Nasirzadeh & Nojedehi, Citation2013) and (Oglesby et al., Citation1989), the productivity rate decreases when the authorized working space is reduced. Similarly, based on the findings of this study’s case studies, it is feasible to deduce that the width of clearance or permissible working space directly affects the productivity rate of highway soft and hard (rock) excavation. As a result, the findings of this study verified current theory and indicated a replication within cases and with theory.
4.2. Effect of a working hour on productivity rate
Pearson correlation testing of case study I soft excavation and case study III hard (rock) excavation showed a strong correlation between working hours and productivity. However, an insignificant correlation was observed on a case study I hard (rock) excavation, case study II hard (rock) and soft excavation, and case study III soft excavation; this could be attributed to limited data points used for analysis.
The productivity rate of soft excavation showed varied trends based on the investigation of Case Study I. Similarly, the findings of Case Study III hard (rock) excavation revealed different trends in productivity rate, which could be explained by the fact that operation could be faster in the morning with new energy, followed by fatigue after working 3 hours, and then regains momentum after the break to finish the task started.
On the contrary, in case study II, soft excavation and hard (rock) excavation of case study III showed a negative effect, i.e., as the working hour increases, the productivity rate decreases. Previous research on working hours and productivity rates has demonstrated that as the working hours exceed 50 hours per week, the productivity rate deteriorates and indicates a loss of 10% to 15% efficiency (Thomas & Raynar, Citation1997). In the late 1960s, Weldon McGlaun discovered that production declined significantly during the first week of scheduled overtime. Week after week, productivity has been falling. After seven weeks of working 50 hours per week, the weekly output was comparable to when the workers worked 40 hours per week. By the ninth week of scheduled overtime, the weekly output for a 60-hour workweek was the same as working only 40 hours per week.
Some of the case considered in this study shows an increase of productivity rate this is because, on average, the measured working hour per week was 42 hours which did not surpass the maximum time where a substantial amount of productivity loss is observed (50 − 60 working hours per week) as compared with previous research. As a result, the analysis was unable to generalize the theory. Although the study did not generalize the theory, the statistical analysis proved that working hours have a considerable effect on productivity and lengthy working time showed a loss of productivity in case study II and case study III, as discussed earlier. Therefore, it is sensible to conclude that this study corroborates existing knowledge or theory.
4.3. Effect of weather on productivity rate
For all of the case studies examined in this study, the productivity rate declines in value as cloud cover increases or (as visibility decreases). Other variable analysis shows that as humidity increases, the value of the production rate drops for all case studies studied in this study. Previous study has demonstrated that poor weather conditions reduce productivity (Nasirzadeh & Nojedehi, Citation2013; Oglesby et al., Citation1989). The same is true with rainfall. .
4.4. Effect of temperature on productivity rate
The effect of temperature on productivity rate revealed a significant correlation in case study III hard (rock) and soft excavation. This could be attributed to the recorded temperature amount in a due phase of construction being optimum and did not affect working conditions that much.
In case III, when soft excavation compared with hard (rock) excavation showed different results, this could be attributed to other factors that were affecting productivity predominantly than temperature does. This can be explained further because the optimum temperature was recorded (on average, the temperature record ranges from 15–18°C).
4.5. Effect of cloud cover on productivity rate
The influence of cloud cover on the productivity rate of highway earthwork activities in Case Study II hard (rock) and soft excavation was discovered using Pearson correlation testing. This was explained by the minimal quantity of cloud cover in case studies I and III.
The volume of cloud cover has an indirect effect on the productivity rate of highway earthwork activities. This means that when the cloud cover or visibility decreases, the productivity rate increases. This outcome is consistent with earlier predictions of declining productivity rates as visibility decreases.
4.6. Effect of a gust wind on productivity rate
Through Pearson correlation testing, the effect of gust revealed a correlation on productivity rate of highway earthwork activities in case study II hard (rock) and soft excavation and in case study III hard (rock) excavation.
From the analysis finds, gust showed three trends in case study II and showed improvement in productivity rate in case study II soft excavation and case study III hard (rock) excavation; this finding doesn’t corroborate existing theories of adversarial weather conditions affect productivity rate. This investigation may be attributed to the fact that the optimum amount of gust air is recorded in due construction. As a result, it is difficult to generalize that the productivity rate improves as gust increases.
4.7. Effect of rainfall on productivity rate
In Case Study II soft excavation, the Pearson correlation productivity rate of highway earthwork operations revealed a substantial link with rainfall amount. However, rainfall amounts were not highly correlated impacting elements in case studies I and III; this could be attributable to the case sites.
According to the investigation findings, rainfall and precipitation amount have a negative association; this can be explained by the fact that as the moisture of the working site grows, so will site operating activities and maneuvering.
4.8. Effect of soil type on productivity rate
The correlation between the productivity rate of highway activities and soil type was shown to be strong using analysis of variance testing. This was demonstrated by the discovery of soft excavation in Case Study I. It was discovered that when the soil type was fat-heavy clay, the productivity rate increased. In contrast, the productivity was the lowest when the soil type was lean clay gravel and sand. This result contradicts the CAT performance guidelines as well as earlier research such as analyses of (Woldesenbet, Citation2010). This could be attributable to various factors that significantly impact the production pace of soft highway excavation.
4.9. Effect of seasonal change on productivity rate
The effect of seasonal variation sowed a correlation with production rate in Case Study II soft excavation based on t-test correlation testing. According to this analysis, when the season was Belg, the productivity rate was higher. When the season was Kiremt, the productivity rate was lower.
4.10. Effect of terrain type on productivity rate
From a conducted analysis of the T-test for the case studies, the difference in terrain type showed a correlation with the productivity rate of highway construction earthwork activities. From the analysis, it was able to notice a visible difference in production rate among different terrain-type settings. According to the investigation findings, the productivity rate for soft and hard (rock) excavations is more likely to rise in flat terrain type settings.
4.11. Effect of contractor type on productivity rate
A T-test analysis for the case studies selected Contractor type showed a correlation with the productivity rate of highway construction earthwork activities. The research showed a visible difference in production rate among the contractors, and inconsistencies of production rate were observed for different activities in a given contractor. This could be ascribed to methodology or the specialization of contractor types on certain activities.
5. Conclusions
According to the statistical research, the key elements influencing soft excavation production rates were permitted working space or Width of Clearance, Temperature, Pressure, Working Hour, and Rainfall. In the case of hard (rock) excavation, the main elements influencing productivity rate were terrain type, width of clearance, working hours, temperature, and cloud cover.
According to the findings of this study, the assessment of the productivity rate should use an objective lens of measurement because it contains enough influencing factors to confuse expert judgment.
When evaluating the production rates of roadway activities, engineers and schedulers need take numerous elements into account. Engineers and schedulers can utilize the established predictive model to track progress and develop future estimate and bidding rules.
The reports mentioned above and documentation are meaningless unless accurate daily work reports are accounted for such type of research works. As a result, to maintain a consistent measure of actual production rates, the daily work reporting system should be uniform and incorporate as many variables as possible.
Based on the findings of this study, it is advised that the identified significantly influencing natural variables be taken into account while drafting or modifying the SPD document.
Disclosure statement
No potential conflict of interest was reported by the author(s).
Additional information
Funding
Notes
1. Journal of Construction Engineering and Management, Journal of Management in Engineering, Journal of Civil Engineering Management, and Construction Management and Economics.
2. Pragmatism is a school of thought that believes the function of thought is tool for prediction, action, and problem solving and not to describe, represent, or mirror reality.
3. Embedded case studies involve more than one unit, or object, of analysis and usually are not limited to qualitative analysis alone. The multiplicity of evidence is investigated at least partly in subunits, which focus on different salient aspects of the case. In this study, the subunits of study are the factors that affect productivity
4. deductive reasoning occurs within the boundaries of existing knowledge (Fellows & Liu, Citation2015)
5. Post-positivism at the ontological level it is critical realism and reality but only imperfectly and probabilistically apprehend-able. At the epistemological level, it is modified objectivist and find probable truth.
6. Social desirability bias (SDB) arises because respondents like to appear to be other than they are. This can occur consciously, because respondents want to manage the impression that they are giving of themselves in terms of social responsibility, or subconsciously, because they believe themselves to be other than they are, possibly a form of denial. (Brace, Citation2008; Sudman & Bradburn, Citation1982)
7. The Mahalanobis distance is a measure of the distance between a point P and a distribution D
References
- Alemu, T. (2006). Measurement of Labor Productivity In Construction Projects: MSc thesis. Addis Ababa.
- Aoun, D. G. Developing Highway Construction Production Rates of Wisconsin Department of Transportation: Unpublished MSc Thesis: The University of Wisconsin-Madison, 2013.
- Bonoma, T. V. (1985). Case research in marketing: Opportunities, problems and a process. Journal of Marketing Research, 22(2), 199–29. https://doi.org/10.1177/002224378502200209
- Borcherding, J. D., & Alarcón, L. F. (1991, January). Quantitative effects on construction productivity. The Construction Lawyer, 11(1), 36–48.
- Brace, I. (2008). Questionnaire Design: How to Plan, Structure and Write Survey Material for Effective Market Research (second edition ed.). London& Philadelphia: The Market Research Society.
- Cheng, B., & Titterington, D. M. (1994). Neural Networks: A Review from a Statistical Perspective. Statistical Science, 4(1), 2–54.
- Chong, W. K. Construction Production Rate Information System For Highway Projects unpublished Ph.D. thesis the university of Texas at Austin, 2005.
- Dozzi, S., & AbouRizk, S. (1993). Productivity in construction. ©National Research Council Canada.
- Dubois, A., & Gadde, L. E. (2014). Systematic combining – A decade later. Journal of Business Research, 67(6), 1277–1284. https://doi.org/10.1016/j.jbusres.2013.03.036
- Fellows, R., & Liu, A. (2015). Research methods for construction (4th ed.). Blackwell Publishing Ltd.
- Flaten, B. T. (2015). Predicting production rates in the wisconsin highway construction industry using computer tools. The University of Wisconsin-madison.
- Gundecha, M. M. 2012. Study Of Factors Affecting Labor Productivity At A Building Construction Project In The USA: web survey. MSc thesis. North Dakota state university major department of construction management and engineering.
- Hajikazemi, S., Andersen, B., & Langlo, J. A. (2017). Analyzing electrical installation labor productivity through work sampling. International Journal of Productivity and Performance Management, 66(4), 539–553. http://dx.doi.org/10.1108/IJPPM-06-2016-0122
- Halligan, D. W., Demsetz, L. A., Brown, J. D., & Pace, C. B. (1994). Action-response model and loss of productivity in construction. Journal of Construction Engineering and Management, 120(1), 47–64. https://doi.org/10.1061/(ASCE)0733-9364(1994)120:1(47)
- Healy, M., & Perry, C. (2000). Comprehensive criteria to judge validity and reliability of qualitative research within the realism paradigm. Qualitative Market Research: An International Journal, 3(3), 118–126. https://doi.org/10.1108/13522750010333861
- Holt, G. D., Harris, F. C., Zakeri, M., & Olomolaiye, P. (1997). Factors Affecting the Motivation of Iranian Construction Operatives. Building and Environment, 32, 161–167. https://doi.org/10.1016/S0360-1323(96)00044-3
- Holt, G., Kaming, P., Kometa, S., & Olomolaiye, P. (1998). Severity Diagnosis of Productivity Problems a Reliability Analysis. International Journal of Project Management, 16, 107–113.
- Hwang, S., & Liu, L. (2010). Contemporaneous Time Series and Forecasting Methodologies for Predicting Short-Term Productivity. Journal of Construction Engineering and Management, 136(9), 1047–1055.
- Jiang, Y., & Wu, H. (2004). Determination of indot highway construction production rates and estimation of contract times 1994. Purdue University.
- Jiang, Y., & Wu, H. (2007). Production Rates of Highway Construction Activities. Int. J. Constr. Educ, 3(2), 81–98.
- Karshenas, S., & Feng, X. (1992). Application Of Neural Networks In Earthmoving Equipment Production Estimating. New York, proc., 8th conf. Computing in civil engineering asce.
- Kisi, K. P. Estimation Of Optimal Productivity In Labor-Intensive Construction Operations. Ph.D. thesis, The University of Nebraska-lincoln, 2015.
- Malisiovas, A. (2010). Construction Productivity: From Measurement to Improvement. Greece: Advancing Project Management For The 21st Century.
- Mengistu, M., Quezon, E. T., & Kebede, G. (2016). Assessment of factors affecting labor productivity on road construction projects in Oromia region, bale zone. International Journal of Scientific & Engineering Research, 7(11), 899–910. https://www.researchgate.net/publication/317661502_Assessment_of_Factors_Affecting_Labor_Productivity_on_Road_Construction_Projects_in_Oromia_Region_Bale_Zone
- Merriam, S. (1998). Qualitative research and case study applications in education. Jossey-bass.
- Nasirzadeh, F., & Nojedehi, P. (2013). Dynamic modeling of labor productivity in construction projects. International Journal of Project Management, 31(6), 903–911. https://doi.org/10.1016/j.ijproman.2012.11.003
- Oglesby, C. H., Parker, H. W., & Howell, G. A. (1989). Productivity improvement in construction. McGraw-hill publishing inc.
- Ovarian, N., & Popescu, C. M. (2001). Field factors affecting masonry productivity.
- Portas, J., & AbouRizk, S. (1997). A Neural Network Model for Estimating Construction Productivity. Journal of Construction Engineering and Management, 123, 399–410.
- Riege, A. M. (2003). Validity and reliability tests in case study research: A literature review with ‘hands-on’ applications From each research phase. Qualitative Market Research: An International Journal, 6(2), 75–86. https://doi.org/10.1108/13522750310470055
- Roland, W. S., & Olaf, T. (2002). Embedded case study methods: Integrating quantitative and qualitative. Sage Publications, Inc.
- Shkedi, A. (2005). Multiple Case Narrative: A Qualitative Approach To Studying Multiple Populations. John Benjamins North America publishing company.
- Smith, S. D. (1999). Earthmoving productivity estimation using linear. Journal of Construction Engineering and Management, 125(3), 133–141. https://doi.org/10.1061/(ASCE)0733-9364(1999)125:3(133)
- Sonmez, R., & Rowings, J. E. (1998). Construction Labor Productivity Modeling with Neural Networks. Journal of Construction Engineering and Management, 124(6), 498–504.
- Sudman, S., & Bradburn, N. (1982). Asking Questions: A Practical Guide to Questionnaire Design. San Francisco, California: Jossey-Bass.
- Thomas, H., & Raynar, K. (1997). Scheduled overtime and labor productivity: quantitative analysis. Journal of Construction Engineering and Management, 123(2), 181–188. https://doi.org/10.1061/(ASCE)0733-9364(1997)123:2(181)
- Tsehayae, A. A. 2015. Developing And Optimizing Context-Specific And Universal Construction Labor Productivity Models [ Ph.D. thesis]. University of Alberta.
- Woldesenbet, A. K. (2010). Estimation models for production rates of highway construction activities. Oklahoma State University.
- Yin, R. K. (1994). Case Study Research Design And Methods. 2nd ed. Applied SocialResearch Methods Series Ed, 5 . Sage. https://iwansuharyanto.files.wordpress.com/2013/04/robert_k-_yin_case_study_research_design_and_mebookfi-org.pdf
- Zewdu, Z. T., & Aregaw, G. T. (2015). Causes of contractor cost overrun in construction projects: The case of the Ethiopian construction sector. International Journal of Business and Economics Research, 4(4), 180–191. https://doi.org/10.11648/j.ijber.20150404.11