
Abstract
This research assesses the variation dynamics of contaminant loading in surface water and its effect on water treatment. A comparative analysis of the variations in physicochemical parameters of raw water quality and corresponding treated water was carried out using descriptive statistics, matrix correlation, and PCA multivariate statistical techniques. Monthly Panel/historical data between 2002 and 2016 from Ghana Water Company Limited (GWCL) treatment works (Adam Clark treatment plant) at Weija and physicochemical analysis of raw and treated water using plant simulation (Jar test) were employed. The highest variability was observed for colour, conductivity, and nutrient (COV;>40%), whilst pH, turbidity, alkalinity, and temperature had moderate variability (COV;<15%). Both natural and anthropogenic activities have a significant deterioration effect (p < 0.01) on the quality of the Weija lack, particularly anthropogenic activities (r = 0.491). Seasonal variation also affects the raw water quality. Consequently, the variations in the water quality parameters have a significant influence on the cost of the production of portable water. The results from this research should guide the Water Resources Commission on the remedial measures to be adopted to curtail the incessant pollution loading on surface water.
1. Introduction
The rate of population growth worldwide, coupled with diversified uses of surface water such as industrial, commercial, irrigation, and domestic purposes, has brought adverse effects on surface water quality and quantity (Khatri, Citation2016; Edokpayi, et al., Citation2017a; Assegide et al., Citation2022). In the tropics and developing countries, water bodies are being polluted and difficult to remediate due to extreme reliability, over-exploitation, and poor management policy in place of a rapidly growing city population and weak institutional capacity (Faye, Citation2021; Chamara et al., Citation2017; Cheng et al., Citation2018). The pollution of water bodies through point and non-point source discharges contributes immensely to the deterioration of water quality resulting from anthropogenic and natural processes (Adejumoke., I et al., Citation2018; Barakat et al., Citation2016). The problem, therefore, exists where surface water quality changes are erratic and cyclical, especially for most tropical and developing countries resulting from diffuse and pollution point sources. Extensive research has been conducted on the quality of surface water variability across the world. Oliveira (Citation2019), researched the temporal and spatial effects of surface water quality and ascribed the contamination of surface water to anthropogenic activities and natural occurrences. The variation in surface water quality has culminated in the rise in costs and changes in protocols for treating water for consumption by consumers. Some physicochemical factors, such as pH and alkalinity of raw water, influence the water treatment process. Furthermore, nutrient-related compounds (nitrates, ammonia, and phosphate) directly affect the optimal conditions of drinking water treatment. Again, raw water quality changes have challenged most treatment works in attaining treatment efficiency (Bashir et al., Citation2020; Sasakova et al., Citation2018). Much particulate matter of organic and inorganic compounds of suspended, colloidal, or dissolved form in raw water influences the coagulation-flocculation process of water treatment. Particularly, inorganic compounds such as silicate, pH, alkalinity, and temperature are key parameters that adversely affect the treatment of water. The use of a corresponding high coagulant dose for treatment performance contributes to the increase in residual contaminant, which poses a public health risk to consumers of drinking water. Aluminium metal residuals have been studied epidemiologically and implicated in the pathogenesis of Alzheimer’s disease (Singh et al., Citation2018; Van et al., Citation2021).
Efficient use of water sources in water treatment facilities requires clear knowledge about the surface water quality and its variability since water quality parameter loadings on the surface water and their interactive effects influence water treatment (World Health Organisation, Citation2019). Weija lake in Ghana is no exception. There have been continuous variations in both the physical and chemical properties of the Weija lake because of various anthropogenic activities and climate change. Seasonal variations in natural processes and anthropogenic activities such as rainfall and nutrient load affect the quality of the Weija lake, this has resulted in changes in the chemical heterogeneity and varied complex characteristics of the lake. The Weija lake serves as a reservoir (impounded water) for the treatment and supply of potable water to more than 1 million people within its catchment. It also serves as a source of water for the irrigation of farmlands, and a section of it has been dammed to generate hydroelectric power. The annual inflow of water into the Weija lake is estimated at 248Mm3/year (679,000 m3/d) (Tagoe et. al., Citation2017). Due to the varied use of the Weija lake, it has been subjected to contamination mostly by domestic waste discharge, industrial effluent flow, and agricultural leachates run-off. Nutrient load from waste effluents dominates the contaminant load, resulting from the lake catchment (Antwi-Agyakwa, Citation2016). The Weija Lake in Ghana is affected by the physically and chemically heterogeneous nature of the water body (Sprimont et al., Citation2017). Many crystalline rocks, comprising five formations of Birimian, Granites, the Togo series, Dahomeyan, and Accraian, underlie the river basin. Apart from Accraian, s the rest are Precambrian. The dominant soils are ochrosols, with patches of gleisols and lithosols. The primary aim of the Weija reservoir was for domestic drinking and industrial purposes as well as irrigating the farmlands. The Adam Clark treatment plant at Weija Systems was designed to produce 190,932 m3/day; however, against the backdrop of continuous deterioration of the surface water, it currently produces 162,898.42 m3/day (Abbey, Citation2016).
Several studies have been conducted on the changes in surface water quality and their effects on the treatment efficiency (Barakat et al., Citation2016; Su et al., Citation2017); however, not few studies have been conducted on the frequency and pattern of water quality deterioration and the interactive effects of chemicals on treatment. Also, the temporal variations of the chemical constituent in composition and concentration to pollution have not been exhaustively studied. Several researchers have studied most water quality variations using the multivariate statistical approach, which provides a better understanding of water quality and aquatic water sources due to their ability to handle and treat a large volume of data. The scientific literature indicates the use of different statistical techniques, including Cluster Analysis (CA), Principal Component Analysis (PCA), Factor Analysis (FA) and differential analysis (DA). Their capabilities differ from the use of the data. They can determine the variations in the surface water quality and identify possible water pollution sources and their contaminant load (Barakat et al., Citation2016). In Ghana, the assessment of river water quality as conducted by several researchers is on a comparing of the measured values of particular parameters with threshold values defined in the National and international standards and guidelines (Tagoe & Mantey, Citation2017). However, the spatial and temporal trends of water quality parameters and their sources in several surface rivers and lakes over the past decades showing the deterioration of water quality due to point and non-point source pollution resulting from anthropogenic activities and natural processes are a grey area that needs to be researched into.
Raw water deterioration of the surface water at Weija is significant due to the rise of physical and chemical constituents resulting from natural and more recently anthropogenic activities. The deteriorating raw water quality results in a more coagulant dose for water treatment using the Jar test at the Adam Clark Water Treatment Plant (WTP). The consumption of a high amount of alum coagulant at the WTP leads to increased treatment costs and residual aluminium contaminant in the treated water, which has a potential public health risk. Therefore, the WTP must adjust the treatment processes frequently to accommodate changes in the raw water quality due to run-off induced excess contaminant load.
This study determines variations in raw water quality and corresponding treated water quality using descriptive statistics. To achieve the aim of this research, the study seeks to; assess fluctuations in raw water quality parameters over the years (2002–2016), investigate the contribution of water quality parameters and their variable-loading effects on the surface water quality, and evaluate the impact of surface water quality on treatment water quality residuals.
2. Materials and method
2.1. Study area
The Weija Treatment Plant is in the southern part of Ghana and is operated by the Ghana Water Company Limited. The Weija Treatment complex houses three conventional plants, namely, Candy, Bamag, and Adam Clark, with different designed capacities. The Adam Clark plant, also known as the Canadian plant, is the largest, and produces about 70% of the entire volume from the Weija system. The Adam Clarke treatment plant is located 1.52 km from the Weija Dam with a design capacity of 190,932 m3/day and takes its abstracted raw water from the Weija lake through a DN 900 mm (46”) Ductile iron pipe The Weija Lake (reservoir) supplies raw water for abstraction for use the three plants. The Weija reservoir is in the western part of the Greater Accra region, at the Ga South Municipality (Weija-Gbawe Municipal Assembly) and lies between 5°33ʹ0” N and 5°40ʹ0” N and 0°20ʹ0” W and 0°24ʹ0” W geographic coordinates. The reservoir is approximately 14.0 km long, 2.2 km wide, and 5 m depth and covers an area of 38.0 Km2 with an effective storage capacity of 113.0Mm3 and 143.0Mm3 as designed capacity. The approximated surface elevation is 14.37 Km reaching 15.24 km at maximum elevation.
The catchment area of the reservoir/Lake is estimated to be 31 Mm2 and lies in the coastal savanna agro-ecological zone with bi-modal dry and wet seasons. The wet season has low peaks from August to October, and maximum peaks from May to July. The dry period picks up between January and March and with the highest conditions in April. The catchment features low running topography and isolated ridges of 365-ft high from a low level of 65 ft above sea level. Many crystalline rocks, comprising five formations of Birimian, Granites, Togo series, Dahomeyan, and Accraian, underlie the river basin. Apart from Accraian, s the rest are Precambrian. The dominant soils are ochrosols, with patches of gleisols and lithosols. (Kuma & Ashley, Citation2008). The Weija lake, which is an impoundment of the Densu river has a discharge of 1.4 Mm3/day and a safe yield potential of 227,765 m3/day (Kuma & Ashley, Citation2008). The quality of the Densu River, on the other hand, has been compromised by anthropogenic activities in the riparian communities, whose catchment is dominated by Built-up areas on the ridges and agricultural purposes (Tagoe & Mantey, Citation2017). These riparian communities in the Densu Basin have a population density of 240 persons per km2, which is considerably higher than the national average of about 100 persons per km2, thereby promoting competitive demand for the resource for agriculture, and portable use and the resultant waste generated. This has left the river in a critical situation, rendering it inadequate to support current demand needs and any major future expansion (Abbey, Citation2013).
Aluminium sulphate is the coagulant chemical chosen and is dosed as dry feed after the aerator as a static mixer at the start of the mixing chamber through a maze of a channel for rapid mixing. The flow is then split into six clarifiers for clarification and from where settled sludge is then recycled by the sludge thickener, and the supernatant is sent for flocculation. At normal, hydraulic loading of each Coagulation-Flocculation and clarification system is 1397 m3/h. The plant-designed capacity is 204,545 m3/day; however, treatment challenges have resulted in a reduced production capacity of 169,898.42 m3/day.
2.2. Data collection and analysis
Panel/historical data from Ghana Water Company Limited (GWCL) treatment works (Adam Clark treatment plant) at Weija between 2002 and 2016 were collected and used. The data comprise a full physical and chemical analysis of raw and treated water and plant simulation (Jar test) data. Daily physicochemical and coagulation data were obtained as a secondary data from the plant. The chemical parameters, including calcium, sodium, chloride, sulphate, iron, phosphate, nitrate, ammonium, and conductivity were measured in the laboratory, while the physical components including temperature, pH, turbidity and color were measured in situ. In all, 5124 of raw water samples were analysed for physico-chemical parameters once daily for 14 years. The 6-h operational test carried out daily by the Jar test apparatus collected 10,080 samples for the study and was analyzed spectrophotometrically, titrimetrically, and electrometrically. The in-feed raw water volumes, jar test efficiency readings, the treated water quality, and the optimum dose readings were also obtained from the daily standard bench sheet provided at the facility (AWWA, Citation1995).
Rainfall data were obtained from the Ghana Meteorological Service Department for the period 2002 to 2016 for both Weija and Nsawam Service Stations, and these had some gaps.
The research used LANDSAT imagery data from the United States Geological Survey (USGS), and ERDAS from 2002 to 2017. SPSS was applied to assess the variability of the quality parameters over the 14 years (2002–2016) period. Evaluation of the extensive water quality dataset was subjected to a multivariate statistical technique through PCA and Pearson correlational statistical computation using Microsoft 2010 and IBM SPSS 20. Dataset analysis was conducted with the Pearson correlation to evaluate the relationship between water quality variables (Barakat et al., Citation2016b). A correlation coefficient of nearly −1 or one means a strong positive or negative relationship between two variables. Its value closer to zero means no linear relationship between them at a significant level; of p < 0.05. However, it is noted that with a large dataset, low strength of correlation, for example, r < 0.05 can be highly statistically significant at p < 0.01. On the PCA application, the data were further checked for normality by conducting the Kaiser–Meyer Olkin (KMO) measure with a KMO index closer to 1 (0.708). This index should be greater than 0.5 for a satisfactory factor analysis. The varimax rotation was used to maximize the variance of the squared loadings. The Z-scale standardization with mean and variance of zero and one was used to minimize the influence of difference on the variance of variables and to adjust for the disparity in the variables’ sizes and measurement units.
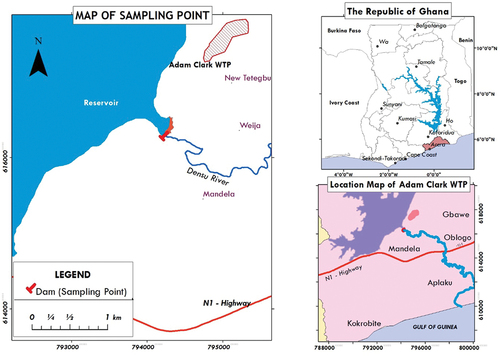
shows the map location of the Weija Dam and Adam Clark Water Treatment Plant in Weija, Ghana. The Adam Clark treatment plant is located 1.52 km from the Weija Dam with a design capacity of 190,932 m3/day and takes its abstracted raw water from the Weija lake through a DN 900 mm (46”) Ductile iron pipe The Weija Lake (reservoir) supplies raw water for abstraction for use by the plant. The Weija reservoir is in the western part of the Greater Accra region, at the Ga South Municipality (Weija-Gbawe Municipal Assembly) and lies between 5°33ʹ0” N and 5°40ʹ0” N and 0°20ʹ0” W and 0°24ʹ0” W geographic coordinates (Anon et al.,2016). The reservoir is approximately 14.0 km long, 2.2 km wide, and 5 m depth and covers an area of 38.0 km2 with an effective storage capacity of 113.0Mm3 and 143.0Mm3 as designed capacity.
Figure 1. Map location of Weija dam and Adam Clark Water Treatment Plant (WTP), Ghana.
3. Quality control and quality assurance
Strict Quality Control (QC) and Quality Assurance (QA) protocols were observed in terms of precision, accuracy, and representativeness. All instruments used in this study were calibrated and validated using the specificity method described using the Standard Methods for the Examination of Water and Wastewater (APHA, Citation2017). The glassware used in this study were soaked in 10% HNO3 overnight and washed with deionized water several times and dried before using them. De-ionized organic-free water samples were used as blanks. The in-feed raw water volumes, jar test efficiency readings, the treated water quality, and the optimum dose readings were also obtained from the daily standard bench sheet provided at the facility (AWWA, Citation1995). They were extracted and analyzed in the same way as the real samples. Triplicate samples were collected.
4. Results
4.1. Physicochemical parameters in the raw water
presents the physicochemical parameters of the water samples from Weija Lake. There were significant (p ≤ 0.05) variations in the raw water quality parameters of the Weija lake. The highest variability was observed for colour, conductivity and nutrient (COV;>40%), whilst pH, turbidity, alkalinity and temperature recorded moderate to lower variability (COV;<15%). The measured turbidity and color ranged between 5.28 and 45.00NTU and 21–252 Pt.Co, respectively, which exceeded the WHO threshold limit. Several studies conducted on the Weija lake (Dinku, Citation2015; Quarcoopome & Asmah, Citation2018) had average turbidity and color values of 10.00NTU and 15. 00Pt.Co, which correspond to the values recorded in this research. The electrical conductivity (EC) recorded a gradual variation between 149.00 and 606 µS/cm with a variability coefficient above 40%. Parameters relating to nutrient matter showed considerable variability (CV = 0.1–1.46 mg/L) with nitrate exhibiting extreme variability. Nutrient loads typically of nitrate concentrations ranged from 0.01 to 11.88 mg/L and a high t-value (t = 11.52) indicated large differences between the lower mean lower value and the maximum value. In this study, it was noted that pH, temperature, and alkalinity have modal and mean values of 7.5pH, 24.5 C and 106.5 mg/L with minimal variability over the period.
Table 1. Statistical descriptive for the parameters analyzed for Weija Lake in Accra, Ghana (2002–2016)
4.2. Correlation analysis in the raw water
illustrates the relationship between water quality parameters and their significant impact on each other. Temperature correlates significantly (p < 0.05) with Dissolved Oxygen (D.O) (r = 0.194) and as well as conductivity (r = 0.207). Thus, the temperature rise may have a corresponding increase in D.O and conductivity. Similarly, the colour has significant (p < 0.01) positive correlation with turbidity, alkalinity, ammonia, nitrate and rainfall (r = 0.594, 0.254, 0.288, 0.237, and 0.480) and vice versa. This suggests that the increase in the colour levels in the raw water causes the levels of turbidity, alkalinity, ammonia, and nitrate to rise. There is a positive correlation between turbidity and conductivity (r = 0.271). Higher turbidity may result in a corresponding rise in conductivity in the raw water.
Table 2. Correlation matrix of raw water quality parameters analysed (2002–2016)
4.3. Effect of seasonal variation on the raw water quality
indicates the effects of seasonal variation (wet and dry seasons) on the water quality characteristics in the reservoir. Color, turbidity, and nitrate recorded significant seasonal changes in the raw water. All recorded higher values in the wet season than in the dry season. This may be attributed to the erosion of different materials from various land use activity sites into the lake because of high rainfall intensities. The levels of alkalinity, pH, DO and phosphate did not experience any significant seasonal changes. The changes in alkalinity levels in raw water affect the pH since the changes in season did not affect the alkalinity, it stands to reason why the pH did not experience a significant change in the raw water (Haghiri et al., Citation2017).
Table 3. Seasonal impact on raw water quality characteristics
4.4. Pollution sources of raw water quality
presents the relationship between water quality and sources of pollution (Natural and anthropogenic activities). The table indicates that both the natural conditions and anthropogenic activities impact significantly (p < 0.01) on the water quality of Weija lake. The extent of raw water pollution arising from natural conditions (r = 0.339) is minimal compared to that from anthropogenic activities (r = 0.491). Natural conditions such as precipitation, evapotranspiration, and hydrological factors do not affect raw water quality. Some of the anthropogenic activities such as activities of illegal mining, industrial effluent, and the use of agricultural inputs like fertilizers and pesticides, greatly impact the raw water quality.
Table 4. Seasonal and anthropogenic effect on surface water quality
4.5. Principal component analysis of pollution loading in the raw water
The Principal Component Analysis (PCA) is used to comprehensively evaluate the water quality based on the pollution loading parameters and to analyze the sources of water pollution. All five principal components extracted have eigenvalues greater than 1 and give a 62.77% cumulative percentage of the total variance of the water quality variables between the years 2002 to 2016. shows that PC1 has the highest variance of 20.51% to the cumulative percentage. This component is characterized by a strongly favorable loading for nitrate (0.735), Ammonia-N (0.732), and conductance (0.679), indicating a high nutrient load in the raw water. The loading variance for nitrogen and ammonia without phosphate indicates a strong and positive nutrient loading in the Weija lake (Abbott et al., Citation2018)
Table 5. Principal component loading of 13 experimental variables
PC2 justified 11.91% of the total variance and had strong positive loading for calcium (0.732), chloride (0.726), and manganese (0.698) as these indicate ionic conductance of the variables. The variable loading for alkalinity (0.817), colour (0.698), and turbidity (0.633) contributes to the third component PC3 (Aesthetics) with a percentage of the variance of 11.91%. PC4 has a strong positive loading for temperature, 0.82 and conductance 0.59 and a negative loading for Phosphate −0.45. Component five (natural component) constitutes 7.80% of the cumulative variance, which has a strong positive loading for pH (0.799), phosphate (0.38) and alkalinity (0.33), and a negative loading for calcium (−0.32) and iron (−0.45).
4.6. Land use, land cover changes within the Weija catchment (2002–2017)
shows the land use land cover classification for 2002 and 2017 from the Landsat ETM+ imagery. The catchment area depicts that a large portion of the cover has shrub and bareland of 1059.6 km2 (40.0%), whilst Forest and farmlands accounted for 842.4 Km2 (31.8%) and 539.20 Km2 (20.4%) respectively, in 2002. Fifteen years on (2017), land use activity shifted toward the state of being shrub/bare land 1082.9 Km2 (41%) and increasing settlement activities 666.5 Km2 (25%) with depleting forest cover of 746.8 Km2 (28.2%) (). The land use activity drifting into settlement increased by 72.262%, and grassland cover also increased by 2.152% (). The decrease in forest cover with a corresponding increase in settlement attests to anthropogenic activities such as illegal mining, which consequently increases the pollution loadings in the surface water.
Figure 2. Proportional distribution of land cover classes in Weija catchment (2002–2017).
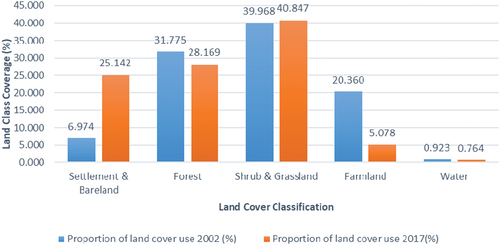
Figure 3. (a)Land use land cover classification for 2002. (b) Land use land cover classification for 2017.
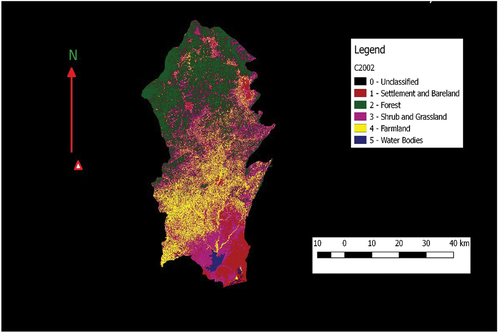
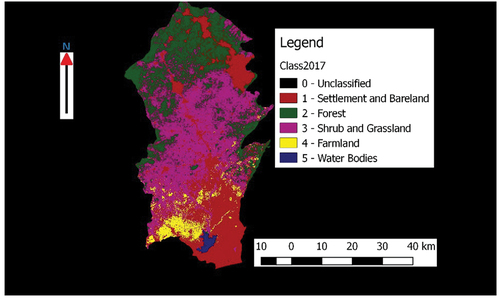
Table 6. Regression analysis of coagulation treatment on key contaminant removal
4.7. Comparative analysis of raw water and treated water parameters
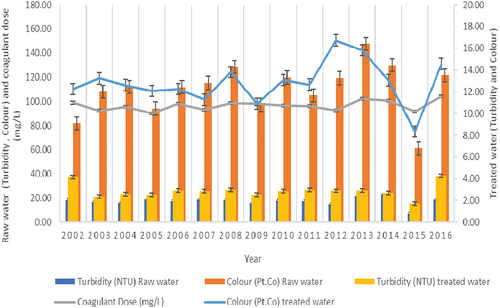
.shows a comparative analysis of raw water and treated water characteristics between the period 2002- and 2016. The figure shows increasing levels of raw water turbidity (15.5NTU) and color (108. 0Pt.Co) in the raw water in 2004 and 23.07NTU, 114. 02Pt.Co in 2014. The quantity of coagulant required to treat the increasing levels of turbidity and color also increased from 96.0 mg/L in 2004 to 101.00 mg/L in 2014. The corresponding levels of turbidity and color in the treated water were 2.58 NTU, 12. 6Pt.Co in 2004 and 2.69NTU, 13. 05Pt.Co in 2014. This trend indicates increasing deterioration of water bodies as a contaminant load of turbidity and colour increases with the years. This is an alarming situation that will negatively impact the cost of water treatment.
Figure 4. Comparable raw water and treated water characteristics in treatment (2002–2016).
shows the types and quantities of chemicals used in treating the contaminants according to seasonal variations between 2005 and 2015. The quantity of alum dosed for the seasonal month of 2015 (98.62 mg/L) was higher than that required for 2005 (83.83 mg/L) for average turbidity levels of 24.0NTU and 19.5NTU respectively. Notably, the quantity of coagulant required for contaminant removal was lower in May and September 2015 than that in 2005. The quantity of residual aluminum used as an indicator to measure the efficiency of coagulation increases as the coagulant-dose increases. The residual values required in 2015 and 2005 during wet (June) and dry (May) seasons were 100 mg/L/ 0.31 mg/L al3+; 80 mg/L/ 0.21 mg/L al3+ and 110.34 mg/L/ 0.36 mg/L al3+ and 75 mg/L /0.26 mg/L al3+ respectively. These values exceeded 0.1–0.2 mg/L, which are the guideline levels of residual aluminium.
Figure 5. Seasonal and temporal treatment Chemical use variations on contaminant removal (2005, 2015).
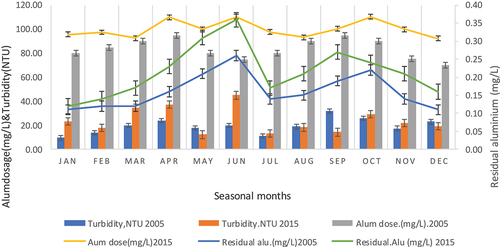
Table 7.0 indicates treated water quality and the relational effect on raw water quality conditions during treatment. Regression analysis () shows that there are positive correlations between the raw water pH and alkalinity load on Turbidity/colour removal (R2 = 0.4853, 0.3831, p < 0.01). In contrast, there was a low correlation between raw water pH and alkalinity during coagulation and aluminium residual (R2 = 0.0304, p > 0.01).
Table 7. The change detection of land cover use in the Weija catchment (2002 and 2017)
5. Discussions
The study presents significant (p ≤ 0.05) variations in the raw water quality parameters of the Weija lake. The highest variability was observed for colour, conductivity and parameters related to nutrients (COV;>40%), while parameters of pH, turbidity, alkalinity, and temperature have moderate variability (COV;<15%). The mean concentrations of nitrate measured were low levels of 1.68 mg/L but remained significant (p < 0.05) with values of 0.01–11.8 mg/L. Color and turbidity concentrations showed a wide range between 21.0 and 252Pt.Co and 5.3–45.0NTU indicating that the surface water lake had moderately to highly polluted quality over the years. The turbidity and color with high standard deviations indicate that the data are spread widely due to the presence of temporal variations likely brought about by natural and anthropogenic pollution sources. Color in surface water is generally the result of suspended and dissolved particles. Color is also influenced by the presence of heavy metals such as iron. The high turbidity levels in the lake is an indication that there was a lot of particulate matter such as clay and silt, fine organic and inorganic matter. The high turbidity levels are mostly caused by anthropogenic activities such as illegal mining, agriculture, and other human activities around the catchment of the lake. The measured turbidity level showed a significant (p < 0.01) positive correlation with colour (r = 0.594) and this also correlates with rainy seasons (r = 0.480) characterized by floods and high-flow regimes carrying silt-laden runoff into the water body. Thus, the increase in the turbidity levels of the lake would cause the colour to deteriorate, as indicated by Amfo-Out. The NO3− concentration showed a significant positive correlation with color (r = 0.237), turbidity (r = 0.323), NH3-N (r = 0.415), conductivity (r = 0.304) with a significant correlation recorded in the rainy season. This confirms that NO3− concentrations are due to leachates from agricultural land and domestic discharge with concurrent high ion dissolution in the water body. The maximum level of nitrate recorded (11.88 mg/L), which exceeded the WHO tolerable limits, gives cause for concern. This because high nitrate levels indicate bacterial contamination, which may lead to an infection known as methaemoglobinaem, as a because of blood lacks the ability to carry sufficient oxygen to the other body cells. The highest mean values of the raw water characterized colour (200. 7Pt.Co), turbidity (26.5NTU) and nitrate (4.82) were recorded in June at the peak of the rainy season in Ghana. The dry season showed a significant relationship with parameter values of turbidity, colour and nitrate, showing its impact on the levels of water body chemicals being supported by the high modal value of pH (7.6) than in the wet season. The levels of physical and nutrient-loaded parameters of the water body showed a significant increase due to seasonal variations, which indicates high variability over the period constituting over 80% of the surface water quality change in the water body. Apart from 2004 and ten years later in 2014, the surface water suffered a severe deterioration with maximum turbidity and colour reaching 45.0NTU and 252. 0Pt.Co from the mean value of 17.9NTU and 106. 4Pt.Co, respectively. Similarly, nutrient load and ionic conductance increased in the same year with maximum values of 11.8 mg/L from a mean value of 1.68 mg/L for nitrates and 607.0 µS/cm from an average of 203.8 µS/cm, respectively, which collaborates with similar studies conducted by Khatri and Tyagi, Citation2015 on lake Kenji in Kenya. The wide turbidity and colour values recorded can be attributed to increased surface run-off soil laden flow from a highly encroached catchment of the reservoir, particularly crop, and fish farming, which contributes to the deterioration of the water body (Masindi, 2018). The difference between the minimum and maximum colour, as indicated by the results, could be that the water body is mainly influenced by particulate matter, dissolved ions, and organic matter. Comparatively, the colour of tropical water resources and urban running waters where there are no effects of human activities on the surface water is less than 86.0 Pt.Co and lower than the average value of 106.0Pt.Co indicated in the study, thus confirming increased anthropogenic activities within the catchment of the Weija lake. (Ansah et al., 2018; Khatri and Tyagi, Citation2015). The period 2002–2016 indicates an increasing trend of raw water turbidity and colour over ten years’ values of 15.5NTU, 108. 0Pt.Co (2004) and 23.07NTU, 114. 02Pt.Co (2014) showed a corresponding increase in treated water quality for turbidity and colour with values of 2.58 NTU, 12. 6Pt.Co (2004) and 2.69NTU, 13. 05Pt.Co (2014). This trend culminated in increasing chemical usage to 96.0 mg/L in 2004 and 101.00 mg/L in 2014. This is an indication of the increasing deterioration of the water body over the years as turbidity and colour levels rise above acceptable freshwater limits (Khatri and Tyagi, Citation2015). Evaluating the temporal impact of raw water characteristics on treated water quality confirmed that heterogeneous chemical constituents have a greater influence on the treated water contaminant concentration. The raw water turbidity values for the years 2002 to 2015 in the same month indicate a corresponding increase in alum consumption and residual aluminium deposits after treatment. For instance, turbidity values recorded 24.0NTU (2015) and 19.5NTU (2005) in June showed a corresponding increase in alum chemical use of 110 mg/L (2015) and 75 mg/L (2005) alongside aluminium residual load after treatment values of 0.36 mg/L (2015) and 0.26 mg/L (2005). a sharp contrast with turbidity of 18.0NTU and 12.2NTU (2005 and 2015) and alum treatment chemical used 95 mg/L and 110 mg/L in May and the phenomenon was repeated in September indicating peculiar raw water characteristics influenced by the heterogeneous condition of chemicals contributed mainly by increasing the nitrate concentration in the water body through pollution from 2002 to 2016. Evaluating the effect of raw water characteristics on contaminant removal under treatment conditions using regression analysis. The outcome of multivariate regression analysis indicates that pH, alkalinity, and optimum dose had a significant effect on turbidity and color as indicators of treatment efficiency, judging by the r-square values of 0.48 and 0.38, respectively. However, these influencing factors do not affect the aluminium content of treated water, r-square value of 0.03. This is consistent with the findings from the study by Adejumoke., I et al. (Citation2018), which show that as water quality deteriorates, increasing the alum dosages result in a buildup of residual aluminum (Tambo & Kamei, Citation1998; Letterman and American Water Works Association., 1999; León-Luque et al., Citation2016). The surface water quality variables exhibited significant (p < 0.05) variability between 2002 and 2015 (CV = 0.389–0.417; p ≤ 0.05).
Increased nutrient loads, particularly nitrate concentrations as shown in the results, are probably migrating leachates from agricultural and domestic discharges (Smith & Schindler, Citation2009). Notably, pH, temperature, and alkalinity have modal and mean values that showed minimal variability over the period. Parameters relating to nutrient matter showed considerable deviations (SD = 0.26–1.99 mg/L), SD as indicated in the results with nitrate exhibiting extreme deviation. The variability was larger for nutrient-related parameters than for most chemical and physical constituents, which are greatly influenced by seasonal variation, anthropogenic and natural conditions. The discharge of nutrients, which continues, results in the violation of quantitative and regulation conditions. The loading variance for nitrate and ammonia is strong and positive and presents a unique observation in the Weija reservoir without phosphate (Abbott et al., Citation2018; Ansah et al., 2018). This observation reflects the increasing anthropogenic activities through point, and non-point sources leached or transported from agricultural lands and domestic waste discharge and complex nitrification processes in the lake, which contributes significantly to the deterioration of the water body (Edokpayi et al., Citation2017a). Ionic conductance is also influenced by carrying a load of dissolved ions associated with waste discharge (Tagoe & Mantey, Citation2017). This ionic dominance is a strong indication of the characteristics of the silicified limestone geology of the underlying bed. Increasing domestic waste discharge contributes to the ionic conductance of the water quality in the reservoir. All three variables are strongly positive and significant, influenced by high run-off events when leaching and transporting compounds from land-use cover degradation and waste discharge. The findings support the colour composition being true colour as agreed by iron and manganese not prominence in these loading variables. The high loading colour and turbidity are associated with silt-laden compounds and are organic in origin. The high loading variability of alkalinity reflects that the geology of the area is dominated by limestone (Kuma & Ashley, Citation2008; Tagoe & Mantey, Citation2017).
PCA identifies the potential contaminant source resulting from the factor loadings of the water quality parameters indicated by the five principal components extracted. The varimax rotation conducted has eigenvalues greater than 1 and gives a 62.77% cumulative percentage of the total variance of the water quality variables between the years 2002 and 2016. The nutrient-related characteristics contribute significantly to having the highest variable loading with a percentage of variance value of 20.5, followed by ionic conductance factors with 13.9% of the variance. This indicates that contaminants are due from mixed sources including natural processes and anthropogenic activities. The cause of the water quality variations is chiefly associated with contamination from non-point sources because of urban waste discharge (PC1, PC2, and PC5 factors), erosion and weathering loaded silt (PC3) and natural conditions (PC4). An average large portion of the land (2,651.16sq.km) as the catchment was studied for encroachment and cover changes between 2002 and 2017. The Catchment area depicted a large cover portion dominated by forest 842.4sqm (31.78%) and grassland of 1059.6 km2 (39.97%), with the rest, settlement, farmlands, and water covering 184. 89 km2 (6.97%), 539,78 km2 (20.36%), and 24.47 km2 (0.90%) respectively, showing in 2002. In 2017, the cover change shows increased coverage of the settlement and bare land, 666.55 km2 (25.14%) while, forest, farmland and water justify coverage of 746. 8 km2 (28.17%), 134.64 km2 (5.08%) and 20.26 km2 (0.76%), respectively. The land conversion to settlement has increased by 72.26% and negatively impacted the decline in cover change on farmlands (5.08%), forests (28.17%), and water (20.80%), respectively. A high rate of vegetation loss and a decline in the water reservoir’s volume could be attributed to population growth and socio-economic activities within the catchment. The potential impact of population growth and domestic and industrial waste resulting from anthropogenic activities will have a consequential effect on raw water quality. (Tagoe & Mantey, Citation2017; Weeks et al., Citation2016). Effects of anthropogenic activities and natural processes on the quality of surface water suggest that pollution is significantly (p,0.01) and caused by mixed sources of natural and anthropogenic activities on the water quality deterioration in the Weija reservoir. Natural conditions impact on a lesser extent (r = 0.339) compared with anthropogenic activities (r = 0.491; Barakat et al., Citation2016; Vega et al., Citation1998).
A high rate of vegetation loss and a decline in the water reservoir’s volume could be attributed to population growth and socio-economic activities within the catchment. The potential impact of population growth and domestic and industrial waste resulting from anthropogenic activities will have a consequential effect on raw water quality (Antwi-Agyakwa, Citation2016; Tagoe & Mantey, Citation2017; Weeks et al., Citation2016). This trend indicates increasing deterioration of water bodies as the contaminant load of turbidity and colour increases with the years. This is an alarming situation when an increasing load of the contaminant shows a rising pollution rate and will negatively affect the corresponding treated water. The rising chemical components and concentrations could be a result from the increasing impact of the anthropogenic and natural processes occurring in the reservoir catchment (Khatri and Tyagi, Citation2015).
6. Conclusion
This study sought to determine variations in raw water quality and corresponding treated water quality using descriptive statistics, matrix correlation, and PCA multivariate statistical techniques. To achieve the aim of this research, the study sought to; assess fluctuations in raw water quality parameters over the years (2002–2016), investigate the contribution of water quality parameters and their variable-loading effects on the surface water quality and evaluate the impact of surface water quality on treatment water quality residuals. The results from the study showed that the variability of water parameter is high (CV, <40%) and significant (p,0.05) for colour, turbidity, conductivity, and nutrient-related compounds.
The study using (PCA) identified nutrient load (20.5%) and ionic conductance (13.9%) to highly influence the deterioration of the surface water quality with a cumulative percentage of variance of 62.7% at an eigenvalue greater than 1. The PCA technique helped in identifying the sources causing the degradation of the water quality, which is mainly related to mixed sources of anthropogenic activities and natural processes. The PCA suggests that urban waste discharge (PC1, PC2, and PC5 factors), erosion and weathering (PC3), and natural conditions (PC4) are the determinants of the deterioration of the surface water quality.
The effects of anthropogenic activities and natural processes suggest that pollution to the surface water is significant (p < 0.05) and caused by non-point and point sources. Comparatively, anthropogenic activities (r = 0.49) impact more than natural processes (r = 0.34) to the deterioration. The study shows that the temporal impact of raw water characteristics on treated water contaminant removal is significant (p < 0.05) over the period from 2002 to 2016. Turbidity values in 2014 compared to 2004 increased by 48.8% with a corresponding increase in 4.26% of residual turbidity after treatment, which was confirmed by 46.7% increase in alum coagulant consumption.
This study was limited to the historical data from the GWCL; hence, a recommendation is therefore made for further studies to be conducted on the in situ method for reducing the pollution loadings in the Weija dam as a means of reducing production costs.
Availability of data and materials
The dataset generated and/or analyzed during the current study is available from the corresponding author on reasonable request.
Author’s Contributions
Hansen Mensah-Akutteh: Conceptualized the research topic, developed the objectives and methodology of the research and participated in the data collection and analysis.
Richard Buamah: He carried out both the laboratory and Field Investigation as well as the Data Curation of the research work.
Samuel Wiafe: He carried out laboratory work and assisted in the writing of the manuscript
Kwabena Biritwum Nyarko: He participated in the writing of the manuscript (Original Draft Preparation) as well as reviewed and edited the manuscript.
Acknowledgements
We acknowledge the immense contribution by the Regional Water and Environmental Sanitation Centre, Kumasi (RWESCK) for making available to us all necessary resources and permit rendered to us to conduct this essential research.
Disclosure statement
No potential conflict of interest was reported by the author(s).
Additional information
Funding
References
- Abbey, F. M. (2016). Assessing existing water demand and supply patterns and reuse options as additional sources of water in the greater accra metropolitan area (GAMA). Master of Science Thesis, 10357606(11), 203. http://197.255.68.203/handle/123456789/5580
- Abbey, E. R., & Liu, S. Y. (2013). BN isosteres of indole. Organic & Biomolecular Chemistry, 11(13), 2060–18.
- Abbott, B. W., Moatar, F., Gauthier, O., Fovet, O., Antoine, V., & Ragueneau, O. (2018). Trends and seasonality of river nutrients in agricultural catchments: 18years of weekly citizen science in France. Science of the Total Environment, 624(7), 845–858. PMID: 29274609. https://doi.org/10.1016/j.scitotenv.2017.12.176
- Adejumoke., I, A., O., A, B., Abimbola., P, O., A., A, T., O., D, A., & Toyin., A, O. (2018) Water pollution: effects, prevention, and climatic impact Ed. Water challenges of an urbanizing world (pp. 64–76). IntechOpen. https://doi.org/10.5772/intechopen.72018
- American Public Health Association. (2017). Guideline for Prevention, Detection. Evaluation and Management of Water/wastewater, 71(6), E13–E15.
- Antwi-Agyakwa, K. T. (2016). Assessing the Effect of Land Use Land Cover Change on Weija Catchment (Doctoral Thesis). Adwinsa Publications. http://hdl.handle.net/123456789/6718
- Assegide, E., Tena, A., Dile Yihun, T., Bayabil Haimanote, Tessema, B., & Zeleke, G. (2022). A synthesis of surface water quality in awash basin. Ethiopia Frontiers in Water, 4(9), 107–113. https://www.frontiersin.org/article/10.3389/frwa.2022.782124.DOI=10.3389/frwa.2022.782124
- AWWA. (1995). Cynotoxins in drinking water: Occurrence case studies and Approaches to Regulations. The Annual Standard Report, 13(1), 61–63.
- Barakat, A., El Baghdadi, M., Rais, J., Aghezzaf, B., & Slassi, M. (2016). Assessment of spatial and seasonal water quality variation of the oum er rabia river (Morocco) using multivariate statistical techniques. International Soil and Water Conservation Research, 4(4), 284–292. https://doi.org/10.1016/j.iswcr.2016.11.002
- Bashir, I., Lone, F. A., Bhat, R. A., Mir, S. A., Dar, Z. A., & Dar, S. A. (2020). Concerns and threats of contamination to aquatic ecosystems. Bioremediation and Biotechnology: Sustainable Approaches to Pollution Degradation, 6(5), 1–26. https://doi.org/10.1007/978-3-030-35691-0_1
- Chamara, B. S., Marambe, B., & Chauhan, B. S. (2017). Management of Cleome rutidosperma DC.Using high crop density in dry-seeded rice. Crop Protection, 95, 120–128. https://doi.org/10.1016/j.cropro.2016.08.009
- Cheng, P., Li, X., Su, J., & S, H. (2018). Recent water quality trends in a typical semi-arid river with a sharp decrease in streamflow and construction of sewage treatment plants. Environmental Research Letters, 13(1), 014026. https://doi.org/10.1088/1748–9326/aa9df2
- Dinku, D. E. (2015). Assessment of the levels of heavy metals in sediments, water and fish from the Weija Dam. University of Ghana. http://ugspace.ug.edu.gh
- Edokpayi, J. N., Odiyo, J. O., & Durowoju, O. S. (2017a). Impact of wastewater on surface water quality in developing countries: A case study of South Africa. Journal of Water Quality. InTech, 4(7), 207–215. https://doi.org/10.5772/66561
- Faye, C. (2021). Water resources and their management in an increasing urban demography: The case of Dakar City in Senegal. P. T. Chandrasekaran, M. S. Javaid, & A. SadiqEds. Resources of water (pp. 116–121). IWA. https://doi.org/10.5772/intechopen.90218
- Haghiri, S., Moharramzadeh, S., & Daghighi, A. (2017). Optimum coagulant forecasting with modeling the jar test experiments using ANN. Drinking-Water Engineering and Science Discussions, 9(6), 1–12. https://doi.org/10.1007/s11434-010-0087-5
- Khatri, N., & Tyagi, S. (2015). The influence of natural and anthropogenic factors on the surface and groundwater quality in rural and urban areas. Frontiers in Life Science, 8(1), 23–39. https://doi.org/10.1080/21553769.2014.933716
- Khatri, A., Wang, J., & Pendergast, A. M. (2016). Multifunctional Abl Kinases in health and disease. Journal of Cell Science, 129(1), 9–16. https://doi.org/10.1242/jcs.175521
- Kuma, J. S., & Ashley, D. N. (2008). Runoff estimates into the Weija reservoir and its implications for water supply to Accra, Ghana. Journal of Urban and Environmental Engineering, 2(2), 33–40. https://doi.org/10.4090/juee.2008.v2n2.033040
- León-Luque, A. J., Barajas, C. L., & Peña-Guzmán, C. A. (2016). Determination of the optimal dosage of aluminum sulfate in the coagulation-flocculation process using an artificial neural network. International Journal of Environmental Science and Development, 7(5), 346–350. https://doi.org/10.7763/ijesd.2016.7.797
- Oliveira, J. C. D. (2019). Spatial-temporal analysis of the surface water quality of the Pará river basin through statistical techniques. Revista, Ambiente & Água, 14(1), 304–316. https://doi.org/10.4136/1980–993
- OMS (2007). Water Treatment: Who seminar pack for drinking-water quality. http://www.who.int/water_sanitation_health/dwq/S12.pdf?ua=1
- Quarcoopome, T., & Asmah, R. (2018). Potential fish yield and physico-chemical characteristics of the Weija reservoir in Ghana. Ghana Journal of Agricultural Science, 53 28. 10.4314/gjas.v53i1.3. https://doi.org/10.4314/gjas.v53i1.3
- Sasakova, N., Gregova, G., Takacova, D., Mojzisova, J., Papajova, I., Venglovsky, J., Szaboova, T., & Kovacova, S. (2018). Pollution of surface and ground water by sources related to agricultural activities. Frontiers in Sustainable Food Systems, 11(4), 78–91. https://doi.org/10.3389/fsufs.2018.00042
- Singh, N. A., Bhardwaj, V., Ravi, C., Ramesh, N., Mandal, A. K. A., & Khan, Z. A. (2018). EGCG nanoparticles attenuate aluminum chloride induced neurobehavioral deficits, beta-amyloid and tau pathology in a rat model of alzheimer’s disease. Frontiers in Aging Neuroscience, 10(6), 56–69. https://doi.org/10.3389/fnagi.2018.00244
- Smith, V. H., & Schindler, D. W. (2009). Eutrophication science: Where do we go from here? Trends in Ecology and Evolution, 24(4), 201–207. https://doi.org/10.1016/j.tree.2008.11.009
- Sprimont, P. G., Ricci, D., & Nicastro, L. (2017). New web technologies for astronomy. Revista Mexicana de Astronomia y Astrofisica: Serie de Conferencias, 45(8), 75–78. https://doi.org/10.4090/jute.2008.v2n2.033040
- Su, Z., Liu, T., Yu, W., Li, X., & Graham, N. J. D. (2017). Coagulation of surface water: Observations on the significance of biopolymers. Water Research, 126, 41–55. https://doi.org/10.1016/j.watres.2017.09.022
- Tagoe, N. D., & Mantey, S. A. V. I. O. U. R. (2017). Mapping the effects of anthropogenic activities in the catchment of weija reservoir using remote sensing techniques. Ghana Mining Journal, 17(2), 98–116. https://doi.org/10.4314/gm.v17i2.2
- Tambo, N., & Kamei, T. (1998). Coagulation and flocculation on water quality matrix. Water Science and Technology, 37(10), 31–41. https://doi.org/10.1016/S0273-1223(98)00304–7
- Van, N., Nagarajkumar, Y., Birkett, N. J., Lindsay, J., Turner, M. C., Willhite, C., & Krewski, D. (2021). Association between aluminium in drinking water and incident Alzheimer’s disease in the Canadian study of health and aging cohort. NeuroToxicology, 83(16), 101–113. https://doi.org/10.1016/j.neuro.2020.04.002
- Vega, M., Pardo, R., Barrado, E., & Deban, L. (1998). Assessment of seasonal and polluting effects on the quality of river water by exploratory data analysis. Water Research, 32(12), 3581–3592. https://doi.org/10.1016/S0043-1354(98)00138–9
- Weeks, J. R., Stow, D. A., & an, L. (2016). Demographics, health drivers, and impacts on land-cover and land-use Change in Ghana. Reference Module in Earth Systems and Environmental Sciences, 11(7), 203–216. http://dx.doi.org/10.1016/B978-0-12-409548-9.10426-9
- World Health Organisation. (2019). Trends in maternal mortality 2000-2017: Estimates by WHO. UNICEF, Word Bank Group and the United Nations Population Division.