
Abstract
The lack of understanding of course expectations and student anxieties in a Data Analytics course creates a significant gap in the practice of teaching and learning the course. This study investigated course expectations and anxieties of college students in Data Analytics courses offered over three semesters. A total of 2,893-word essays from 91 students were analyzed using text mining methods to achieve this goal. It was discovered that students understood the course but only associated its application to the field of business. Using hierarchical cluster analysis, students’ course expectations were classified into three themes: the goal of data analytics; the skills that would be acquired in the course; and the application of data analytics. Sentiment analysis disclosed that the students had apprehensions about the course because of its complex, meticulous, and mathematical nature. There were more positive than negative notions about the course. Implications of the findings and future work are offered.
1. Introduction
Expectations are “personal beliefs about occurrences that may take place in the future” (Casad, Citation2007, p. 327). Expectations affect how people think, feel, and behave (Casad, Citation2007). Considering the consequences of expectations, these are investigated in an educational context (e.g., Özer, Citation2018) because students’ expectations of the course can influence their reactions to the course (Soler et al., Citation2021). It is important to understand students’ course expectations to maximize students’ learning, satisfaction, course success, and retention (Badawy et al., Citation2013). Managing course expectations promotes course transparency (Badawy et al., Citation2013), which, in turn, could avoid course frustrations (Eltegani & Butgereit, Citation2015) and ill feelings between teachers and students (Miley & Gonsalves, Citation2004).
Anxiety is another psychological factor that affects students’ course performance. Anxiety is “a psychological and physiological state characterized by cognitive (e.g., recurrent or obsessive thoughts), somatic (e.g., headache, dizziness, nausea), affective (e.g., dysphoria or negative mood), and behavioral (e.g., trembling, pacing, or restlessness) responses that arise as a result of a perceived threat to the individual” (Lin, Citation2021, p. 257). Its effects are widely investigated in an academic setting, which is then called academic anxiety (subsequently referred to as anxiety). For instance, it has been established that anxiety has a negative influence on mathematics (Sad et al., Citation2016), writing (Abdel Latif, Citation2015), and programming performances (Dirzyte et al., Citation2021). Understanding students’ anxieties about the course is important because it can lead to the implementation of appropriate teacher interventions (Pekrun, Citation2014). For example, after identifying students’ programming anxiety, teaching programming strategies and interventions were developed (Kallia & Sentence, Citation2018).
Recently, the Data Analytics course has been offered at the undergraduate level. This course requires mathematics, statistics, programming, and communication skills (Brandon, Citation2015; Weathers & Aragón, Citation2019). There is a growing body of research on data analytics education that focuses on curriculum development (Brandon, Citation2015; Lawler & Molluzzo, Citation2015), teaching strategies (Asamoah et al., Citation2017), technology-supported teaching (Weirich et al., Citation2017, Citation2018), and critical competencies (Weathers & Aragón, Citation2019). However, students’ expectations and anxieties in a data analytics course are relatively unknown. The lack of understanding of the psychological constructs mentioned leaves a big gap in the practice of teaching and learning of the course (Buckley et al., Citation2004). As a result, the course objectives may not be met and the course may not contribute to producing graduates who can fulfill the need for data analysts. To address this gap, this study was conceived. It aims to apply text mining techniques to understand the students’ course expectations and anxieties. Specifically, the study aims to answer the following questions: 1) What are the students’ course expectations when categorized using hierarchical cluster analysis?, and 2) How can we describe the students’ anxieties towards the course when analyzed using sentiment analysis?
Organized into eight sections, the rest of this paper is as follows. The second section is the Literature Review, which discusses relevant published articles on course expectations, academic anxiety, text mining, and teaching data analytics in education. The third section is Methodology, which is further divided into three sub-sections. The fourth section presents the Results of the study. This is immediately followed by the Discussion, the paper’s fifth section. The sixth section contains the Practical Implications. The seventh section discusses the current study’s limitations. Finally, in the eighth section, the Conclusion, Recommendations, and Future Works are discussed.
2. Literature review
2.1. Course expectations
Different studies have investigated the course expectations of students from different degree programs. This literature review discussed course expectations involving students in language-related degree programs. The course expectations of vocational English students include improving their English skills, gaining skills that can facilitate finding jobs, learning the right pronunciation, learning new vocabulary, and ease of examinations (Özer, Citation2018). Content analysis of the students’ responses was employed to determine these themes.
In a related study, Zadorozhna et al. (Citation2020) compared the course expectations of foreign language students with their teachers through a mixed-methods approach. It was found that students’ course expectations matched the teachers’ assumptions. The congruence between expectations and assumptions was attributed to the clear stipulation of the course learning outcomes in the syllabus.
Four studies investigated the course expectations of students in medical-related degree programs. The first study was conducted by Cowen et al. (Citation2018), who utilized a survey form to reveal the nursing students’ expectations about their clinical course. Students were expected to learn nursing skills and procedures. Specifically, they were expected to learn how to communicate with the patients and their families. However, there was a disparity between time expectations and time spent. Hidalgo-Blanco et al. (Citation2020), which is the second study, extended the study of Cowen et al. (Citation2018) by finding whether nursing students’ expectations were fulfilled. However, students’ expectations were only partially fulfilled. In addition, Hidalgo-Blanco et al. (Citation2020) employed factor analysis to draw a model of the nursing students’ expectations. The analysis yielded a three-model of expectations: academic adaptation, personal development, and academic performance. This finding is similar to that of Özer’s (Citation2018).
The third study involved nursing students (Soler et al., Citation2021). In the study of Soler et al. (Citation2021), thematic analysis was employed to determine the nursing students’ expectations before the start of their first clinical trial. This set of participants had the desire to learn, integrate theory into practice, and have a sense of fulfillment. They were motivated to attend clinical placement and were committed to learning. This finding is similar to the studies of Hidalgo-Blanco et al. (Citation2020) and Özer (Citation2018). The unique contribution in the study of Soler et al. (Citation2021) was that the students’ course expectations reflected the students’ weaknesses, such as insecurity and inexperience.
The last study involved fifth-year medical students who took online orthopedics classes. The study used a cross-sectional survey to solicit the students’ perceptions of the course in terms of relevance, reflection, interactivity, tutor support, peer support, and interpretation. The study revealed that the course fulfilled students’ expectations.
2.2. Academic anxiety
Academic anxiety can induce a feeling of apprehension over academic tasks, which, in turn, influences the academic performance of students (Hooda & Saini, Citation2017). A growing body of studies attempts to understand students’ anxiety and lessen its impact (e.g., Rith-Najarian et al., Citation2019). It has been consistently shown that there is a negative relationship between mathematics anxiety and mathematics performance. For example, two separate meta-analyses on the relationship between anxiety and mathematics achievement had similar findings. The study by Sad et al. (Citation2016) analyzed 11 published papers from 2005 to 2014 that reported the association between mathematics anxiety and mathematics achievement of Turkish students. The results of the meta-analysis showed negative and statistically significant correlations between mathematics anxiety and mathematics achievement. Three subsequent meta-analyses further confirmed this finding (Barroso et al., Citation2021; Caviola et al., Citation2022; Namkung et al., Citation2019).
The anxieties about the use of the English language by non-native speakers were also documented. Abdel Latif (Citation2015) reported the sources of 57 Egyptian university students’ English writing apprehension. Using a rating scale and a grounded analysis approach to find answers to the research questions, the author identified six sources of students’ English writing apprehension; namely, linguistic knowledge level, perceived language competence, writing performance level, perceived writing competence, instructional practices, and fear of criticism. Teachers were then advised to use read-to-write tasks to address the listed sources of apprehension.
Students taking up computer programming also experience anxiety (Nolan & Bergin, Citation2016). This is attributed to the difficulty of programming (Kallia & Sentence, Citation2018; Owolabi et al., Citation2014) because it requires exceptional accuracy (Havenga et al., Citation2013). As early as the start of the programming course, students already experience anxiety and can continue at the end of their first year (Connolly et al., Citation2008). Apprehension or fear of programming had affected the students’ skills acquisition and academic performance (Nolan & Bergin, Citation2016). Nolan and Bergin (Citation2016) conducted a systematic literature review of the 24 papers published about the role of anxiety in learning to program. The study further disclosed that mathematics, computer usage, and test anxieties affected programming anxiety.
2.3. Text mining in education
Text mining is the process of collecting and analyzing unstructured and structured text into meaningful patterns and new insights (International Business Machine Cloud Education, Citation2020). Text mining can be done manually through a qualitative approach, such as thematic, cluster, and emotion analyses (e.g., Carli et al., Citation2016). Similarly, text mining can be employed with the use of software packages (e.g., R, Python, etc.) and has been found very useful in almost every field of endeavor (Jusoh & Alfawareh, Citation2012; Nugroho et al., Citation2015; Shi et al., Citation2019).
Researchers utilized text mining techniques to analyze textual data gathered from the education domain (Ferreira‐Mello et al., Citation2019). Students’ essays, chat messages, feedback, online assignments, and online discussions were some of the sources of educational data (Celestial-Valderama et al., Citation2021; Ferreira‐Mello et al., Citation2019; R. P. Bringula et al., Citation2019; J. P. P. Miranda & Martin, Citation2020). Cluster analysis is a widely used text mining technique in education (Ferreira‐Mello et al., Citation2019). The systematic review of Ferreira‐Mello et al. (Citation2019) showed that text clustering has been utilized to improve text predictions, revise the curriculum, measure engagement, and identify learning patterns. Similarly, the study by R. P. Bringula et al. (Citation2019) employed cluster analysis to examine YouTube textual feedback to determine the relevance of educational videos. Through cluster analysis, the studies identified areas of improvement in the video content.
Sentiment analysis is another text mining technique that is widely used in education (Ferreira‐Mello et al., Citation2019). It examines a person’s feelings, emotions, attitudes, or reactions (Ferreira‐Mello et al., Citation2019; Mite-Baidal et al., Citation2018). For example, Balahadia et al. (Citation2016) developed a system capable of analyzing students’ evaluations of their teachers’ performance using sentiment analysis. The goal of the system is to identify students’ concerns and communicate these concerns in the form of sentiments (Mite-Baidal et al., Citation2018). In another study, R. P. Bringula et al. (Citation2019) used sentiment analysis on YouTube users’ feedback about the usefulness of video content in teaching programming.
Three recent systematic literature studies summarized the use of sentiment analysis in education. In their study, Mite-Baidal et al. (Citation2018) analyzed 18 published articles from 2013 to 2018. In the second article, Ferreira‐Mello et al. (Citation2019) reviewed 343 papers published from 2006 to 2018. Ulfa et al. (Citation2020) examined twelve articles published from 2014 to 2019. The findings of these studies were consistent, i.e., sentiment analysis was utilized for detecting students’ emotions, analyzing students’ class participation, evaluating teachers’ performance, improving the learning process, determining course satisfaction, and reducing attrition.
2.4. Teaching data analytics
The focus of Data Analytics was on algorithms and programming, IT-business alignment and strategic advantage, and business applications (Brandon, Citation2015). With such diversity, the embedded courses necessitated the expertise of other departments. This is consistent with the curriculum proposed by Lawler and Molluzzo (Citation2015). The algorithms and programming components are not included in the business education curriculum. The curriculum focuses more on the use of data analytics software. For example, Weirich et al. (Citation2017) presented a case for using Audit Command Language (ACL) Analytics to teach data analytics skills in auditing and/or forensic accounting classes. ACL Analytics (renamed Galvanize) is a software package for audit data analytics that is used for fraud detection, detection, and risk management (ACL Services Ltd, Citation2021). Ninety students used the software and analyzed fraud data. The students appeared to enjoy using the software and the investigative aspects of the activity.
In another example, Weirich et al. (Citation2018) used different software to replicate their previous study. Tableau was used by students to create data visualizations and dashboards for analyzing order-to-cash cycles. Students were enthusiastic about the activity and the software. Students said the activity was useful, realistic, and informative, and it gave them a clear understanding of data visualization.
One study discussed the experience of teaching data analytics to computing students. Asamoah et al. (Citation2017) conducted research that revealed an experiential perspective on how a big data analytics course was designed and delivered to students at a Midwestern university. The course was designed in accordance with the Master of Science in Information Systems (MSIS) 2006 Model Curriculum, with database, computer programming, statistics, and data mining skills as prerequisites. The course required extensive data collection and management. The study’s participants were senior or graduate-level students with strong technical backgrounds. Students felt that the course structure and organization helped them comprehend the course content.
In a recent study, Weathers and Aragón (Citation2019) outlined the six competencies marketing students needed to achieve proficiency in data analytics. These skills were assessing data quality, understanding measurement, managing datasets, analyzing data, interpreting results, and communicating results. Although these competencies were intended for marketing students, they were also applicable to students who are in the field of data analytics. According to the authors, developing these competencies is challenging. For instance, students may find it difficult to interpret and communicate statistical results. Another obstacle entails the different usage of statistics and data analytics software packages.
3. Methodology
3.1. Setting, participants, and data collection procedure
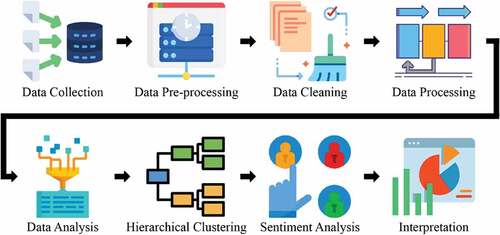
The whole process of the study, from data collection to interpretation, is depicted in Figure . The study was conducted in one department at one university in [information redacted]. The study included second-year (n = 33) and third-year (n = 58) Information Technology students who took Data Analytics courses in three different semesters. The Data Analytics course is a 3-hour laboratory and 2-hour lecture course designed for computing students (Computer Science, Information Technology, and Information Systems). At the end of the course, they were expected to explain and demonstrate the different data analytics methods using the R programming language. There were no repeaters in the class. A total of five classes were offered throughout the three-period semesters, with a total of 173 students. A total of 91 students from three classes participated in the study. The participants were composed of 66 male and 25 female participants. The average age of the participants was 20 years old (standard deviation = 0.53).
The data collected in the study consisted of students’ essays (Ferreira‐Mello et al., Citation2019). Students were asked to write a one-paragraph essay about their ideas, expectations, and hesitations about the course. The essays, written in a word processor and submitted through a learning management system, were then collected and anonymized.
Figure 1. Flowchart of the Methodology of the Study.
3.2. Data preprocessing, data cleaning, and data processing
The text mining methods in this study were adopted from the studies of R. P. Bringula et al. (Citation2019) and J. P. Miranda and Bringula (Citation2021). Data preprocessing involved the aggregation of all essays into a single spreadsheet file (Figure ). The spreadsheet file was then saved as a comma-separated values (CSV) file. This comprised the dataset of the study. The words were then transformed into lowercase. For example, the words “DATA” and “Data” were converted to “data.” Converting text data to lowercase is a necessary step in properly analyzing text data. The text data was converted to lowercase so that the machine algorithm could properly analyze and categorize the data. Transforming all text data to lowercase reduces noise in the data, resulting in more accurate results. Afterward, the words were lemmatized using the function lemmatize_strings. This function is part of the textstem R library. This process standardizes the text data (Nisa & Qamar, Citation2015; Sharma et al., Citation2022). According to Sharma et al. (Citation2022), lemmatization is the process of understanding the meaning of a word by an algorithm before changing it to its base form found in the dictionary (e.g., doubled to double). This procedure was undertaken to properly identify and classify the text data. The dataset initially contained 8,862 words.
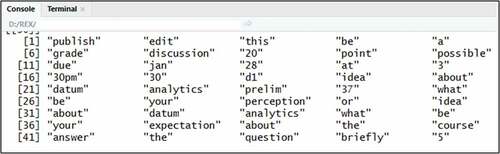
The words were tokenized after preprocessing. It is a necessary step when performing text mining analysis. The sentences in the dataset are broken down into words during this process. For word tokenization, the function tokenize_words was used. To use the tokenization function, the tokenizers R library was installed. It is worth noting that the words were also subjected to bigram. However, no significant results were found using the bigram. Thus, the unigram was retained (Figure ).
Figure 2. Sample Data During Preprocessing.
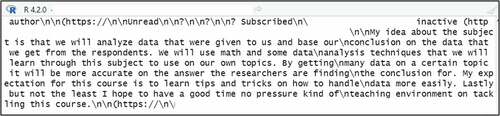
Figure 3. Sample Corpus after Lemmatization and Tokenization.
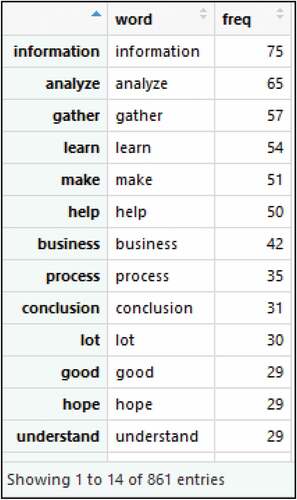
The dataset was then subjected to data cleaning and data processing. In data cleaning, all special characters, numbers, and symbols were removed (e.g., periods, semicolons, commas, alphanumeric, whitespace, and punctuations). Stopwords were removed from the dataset that included English standard terms (e.g., “the,” “a,” “an,” “is,” “also,” and so on) and keyword terms (e.g., “data,” “analysis,” “analytics,” “expect,” “expectation,” and so on). Finally, the words were subjected to data processing (e.g., word stemming). This last step formed the corpus. The corpus contained 861 observations (i.e., unique words) with a total frequency of 2,893 words (Figure ). The tm (text mining package) R library was used to build the corpus. It included the VCorpus (volatile corpora), TermDocumentMatrix (term-document matrix), and DocumentTermMatrix (document-term matrix) functions, which prepared the texts for further analysis. The VCorpus stores temporary data in memory for quick access, allowing for faster text processing. The texts in the corpus were then converted into either a table whose rows were the terms of each document (term-document matrix) or a table whose rows were documents and columns were the terms (document-term matrix).
Figure 4. The final corpus after data cleaning and processing.
3.3. Data analysis
The corpus was examined using hierarchical clustering and sentiment analysis. Hierarchical clustering combines smaller data sets into larger ones or divides large data sets into smaller ones. These processes produce a tree known as a dendrogram (Halkidi, Citation2018). Sentiment analysis examines the person’s feelings, emotions, attitudes, moods, or reactions (Ferreira‐Mello et al., Citation2019; Mite-Baidal et al., Citation2018). The students’ expectations were determined using hierarchical cluster analysis, while their apprehensions were determined using sentiment analysis. The R software version 4.2.0 was used for hierarchical cluster and sentiment analyses. A visual inspection was performed to ensure the clarity of the hierarchical clusters. The hierarchical cluster tree was manually pruned by eliminating less frequently occurring words. A legible hierarchical cluster figure was achieved after eliminating words with fewer than five occurrences in the corpus. Thirty-five words were retained in the corpus.
The Elbow method of the factoextra R library was used to determine the optimal number of clusters. The factoextra library is generally used to extract and visualize the results of multivariate analysis (The R Foundation, Citation2022). The clusters were generated through the function hclust with ward.D2 as the method. The method employs squared Euclidean distance. The aforementioned function can be found in the stats R library. The cluster graph was created using the function plot function in the graphics R library.
In labeling the clusters, the researcher was guided by the question: “What are the ideas, expectations, and hesitations exhibited in the sentence?”. Thematic analysis was used to guide the labeling process (R. Bringula et al., Citation2021). One of the researchers labeled the clusters. The words served as the codes. The codes were already assigned to the labels (i.e., themes) through hierarchical cluster analysis. The codes and sentences (from which the codes were derived) were constantly compared to the labels, whether they fit or not. The labels were then presented to the rest of the team members for approval. The labels were revised until a consensus was reached.
Meanwhile, the sentiments were based on the bing sentiment classifications (i.e., positive and negative sentiments; Silge & Robinson, Citation2017). A sentiment graph was also provided. Through visual inspection, the words with frequencies of less than three were removed from the graph for the sake of clarity and readability.
4. Results
4.1. Course expectations through cluster analysis
Table shows the ten most frequently used words to express students’ expectations and apprehensions about the Data Analytics course. The word “information” was the most frequently occurring. The words “analyze” and “gather” were the second and third most frequently used words. The top-three words are closely related to one another, i.e., data gathering and analysis lead to relevant information.
Table 1. Ten Most Frequently Used Words in the Corpus
The fourth most frequently occurring word was “learn.” As shown in the sample text, a student was expecting to learn from the course and apply that knowledge or skills in the future. This outcome is consistent with the fifth and sixth most frequently occurring words. The students regarded the course as relevant to joining the workforce. As such, they were expecting to learn a “lot” (the tenth word in the list) from the course. Specifically, students are committed to learning from the course because they believe they will be able to apply the skills and knowledge they will gain from it. In turn, students perceive that these skills and knowledge will help them find jobs and advance in their careers. These findings are consistent with the results of the studies of Özer (Citation2018), Cowen et al. (Citation2018), and Soler et al. (Citation2021).
The word “business” appeared 42 times in the students’ essays. The sample sentence containing this word reflected the students’ perceptions of the course on business efficiency application. Students also associated the course with analyzing raw data to reach an informed “conclusion,” which was mentioned 31 times in the corpus.
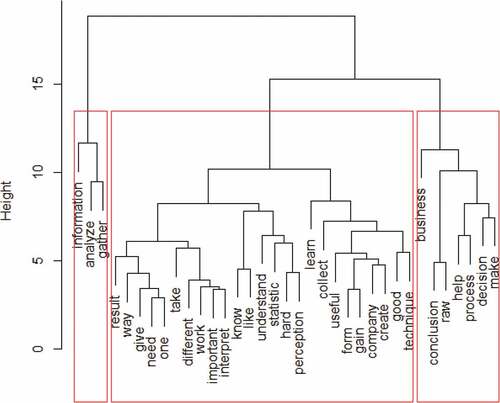
The optimal number of clusters to retain was three (Figure ). The hierarchical cluster analysis confirmed the three clusters (Figure ). The words “information,” “analyze,” and “gather” comprised the first cluster. The cluster was labeled “Data Analytics Goals” (Table ) after an examination of the sentences that contained these words (Table ).
Table 2. Labels of Hierarchical Clusters
Cluster 2 contained the highest number of words. Some of the sample sentences in this cluster include “Data analytics can be a job for a programmer, good at mathematical skills and good at gathering important data.”, “In other words, Data Analytics is analyzing the data and a way to produce credible information.”, and “It is also the application of statistics to quantify and gain insights into the meaning of the data.” Based on the sentences, the cluster was labeled as “Data Analytics Skills.” As shown in the sample texts, different skill sets are needed for the course. These skills involve programming, mathematics, statistics, and data management (e.g., gathering, assessing, storing, and interpreting data). In addition to these skill sets, students are aware that they need to hone their communication skills since the results of the data analysis need to be presented. This theme and skill sets are consistent with the skill competencies identified by Weathers and Aragón (Citation2019).
The last cluster was labeled as “Data Analytics Applications.” The cluster label was supported by sentences containing the words “business,” “conclusion,” “raw,” “help,” “process,” “decision,” and “make.” For instance, one student viewed “Data Analytics as a course that can upgrade the process of a business.” Another student said, “Data analytics can create business opportunities that are aligned with your present business.”
Figure 5. Elbow Method showing the optimal numbers of clusters.
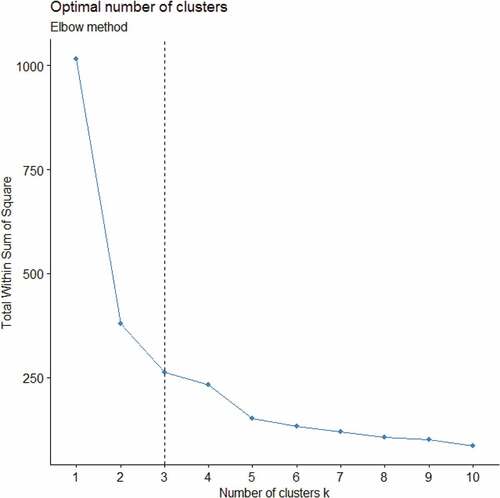
Figure 6. Hierarchical Cluster Analysis of Words.
4.2. Students’ anxieties analyzed using sentiment analysis
One hundred and eighty-five words were labeled with sentiments using the bing dictionary. As shown in Figure , the word “good” had the highest number of contributions in the positive sentiments (n = 29). One student said: “Also, we [students] will be very marketable in the industry if we have good skills in Data Analytics.” In another statement, “I would also hope to get a good grade for this course.” These statements signify the positive perceptions of the course.
Meanwhile, the word “hard” contributed the most negative sentiment. This negative sentiment was mainly attributed to the skill requirements of the course. The course requires programming, mathematics, statistics, and communication skills. For example, one student said, “I have a hard time with math, and finding out that the subject is a combination of math and programming is something that I find a little intimidating to me.” Another student commented about her or his poor writing skills: “I have difficulty with words.” Students in this study and students who took mathematics and programming courses expressed similar sentiments (Barroso et al., Citation2021; Nolan & Bergin, Citation2016; Sad et al., Citation2016). Furthermore, this supports the findings of Connolly et al. (Citation2008), who discovered that students experience anxiety even early in the course.
The sentiment dictionary tagged the words “manipulate”, “problem”, and “complex” as negative sentiments. However, considering the usage of these words in the sentence, they are deemed neutral. For example, the word “manipulate” is derived from the text “[Data analytics] examines huge amounts of data to manipulate and make it useful.” which does not denote negative feelings. Similarly, the words “complex” and “problem” refer to the problem-solving skills that the students can learn in the course, as evident in this text: “I believe that this will help us to solve more complex problems efficiently.”
Figure 7. Sentiment Analysis.
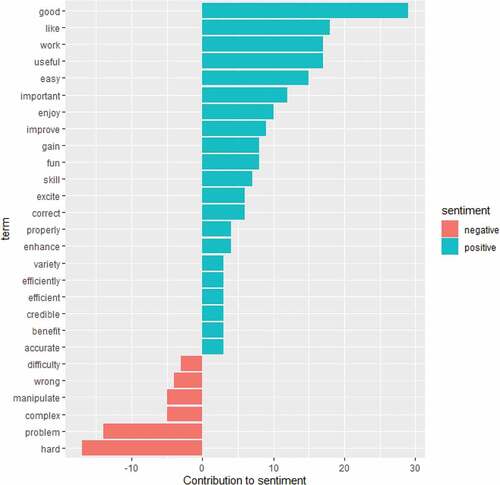
There were more positive sentiments than negative ones. In particular, there were 136 words labeled as positive sentiments and 49 words labeled as negative sentiments (Table ). The Chi-square test confirmed that the number of positive and negative sentiments was unequal (χ2(1) = 40.914, p < 0.01).
Table 3. Polarity of Words
5. Discussion
This study determined the course expectations and anxiety of students in Data Analytics class through text mining techniques. Table showed interesting findings. Consistent with the literature (Özer, Citation2018), students in this study expect the course as a way to secure a job in the future. Students expect to gain knowledge and skills relevant to the demands of the workforce. Hence, the students perceived the course to be relevant.
Another important finding is the students’ clear understanding of the course. This is consistent with the findings of Asamoah et al. (Citation2017). Students will be able to understand and appreciate the course content if they are given real-world, hands-on data analytics problems. They can use the skills they learned in data analytics to better understand the needs of the organization. Despite this clear understanding, they had a limited view of data analytics applications. They mostly linked the course to business applications. None of the students mentioned other possible applications of data analytics principles and techniques in other fields.
The students’ clear, albeit limited, understanding of the course content can be used to leverage data analytics teaching practice. At the beginning of the course, teachers could provide a general overview of the data analytics process. Additionally, teachers could discuss the comprehensive applications of data analytics. Guided by these findings, the syllabus may also be revised to include a discussion of the overview of the process and applications of data analytics. In this manner, teachers will be able to reaffirm students’ correct perceptions as well as dispel misconceptions about data analytics.
Hierarchical cluster analysis showed the three themes of students’ course expectations. The first theme was labeled “Data Analytics Goals”. This theme reflects the students’ perceptions of the purpose of the data analytics process and its end goal. The texts associated with the words “gather” and “analyze” represent the concept of data collection and the need for subsequent analysis to produce useful information. This finding further supports the need to include an overview of data analytics in the syllabus. These findings are consistent with those of Cowen et al. (Citation2018) and Özer (Citation2018). According to the findings of Cowen et al. (Citation2018), nursing students were eager to put their classroom skills and knowledge into practice. Students learning English were hoping for good grades in their classes (Özer, Citation2018). As a result, students in the current study expressed the same level of enthusiasm and optimism.
Meanwhile, the second cluster, labeled “Data Analytics Skills,” refers to the students’ expectations relating to the skills expected to be acquired in the course. The cluster contained the highest number of words, indicating that students put more emphasis on this expectation. The second cluster shows similarities and differences in the study of Weathers and Aragón (Citation2019). The findings of the current study and those of Weathers and Aragón (Citation2019) are both similar and dissimilar. They are identical in terms of the six data analytics competencies. Meanwhile, they differ in terms of the learning outcomes and software used in this study. The ability of students to use algorithms and demonstrate programming skills are two of the learning outcomes in this study. These skill sets are not present in the Weathers and Aragón (Citation2019).
Another notable difference is the participants of the study. Weathers and Aragón (Citation2019) studied marketing students, whereas this current study focused on Information Technology (IT) students. Weathers and Aragón (Citation2019) study participants were not required to do any programming. Instead, they analyzed data using ready-made software (such as a spreadsheet). IT students, on the other hand, must write a program for each step of the data analytics process. As a result, the perceived difficulty of the course is understandable, given that data analytics for IT students necessitates a wide range of disciplines (Brandon, Citation2015).
The third cluster is concerned with the anticipated application of data analytics. It confirms the findings presented in Table . The students’ narrow perspective on the application of data mining limits their creativity in exploring various sources of data. Nonetheless, this perception is easy to manage.
Prior research provided guidelines for developing a data analytics curriculum (Brandon, Citation2015; Lawler & Molluzzo, Citation2015), teaching strategies (Asamoah et al., Citation2017), and critical competencies (Weathers & Aragón, Citation2019). It is equally important to understand the emotional responses of the students who will receive the instructions (Pekrun, Citation2014). Sentiment analysis was employed to accomplish this. Students were generally more positive about the course. One of the positive sentiments is an expectation of receiving good grades, which supports the studies of Cowen et al. (Citation2018) and Özer (Citation2018). As a result, in addition to the expectations of acquiring skills, students strive for high grades. It contradicts the findings of Miley and Gonsalves (Citation2004) because the current study shows that both skills and grades are valued at the start of the course. In other words, for this group of participants, skill acquisition and grades are both important components of learning outcomes.
Perceived poor programming, mathematics/statistics, and communication skills were deemed the major obstacles in the course. According to Connolly et al. (Citation2008), their apprehension about programming stemmed from their assessment of their skills in previous programming courses. Computing students, like other students in other degree programs, believe they have poor mathematical and communication skills (Abdel Latif, Citation2015; Sad et al., Citation2016). Students, in particular, have difficulty understanding the mathematical aspects of data analytics. They also had trouble explaining the results of data visualization. Students, in other words, are concerned about their current abilities (Soler et al., Citation2021). Educators continue to face difficulties in addressing these insecurities. As a course that requires different disciplines, teachers need to identify the strengths and weaknesses of the students.
To address the apprehension of the students, teachers may conduct an assessment of their students’ skills (e.g., a self-reported survey on the skill sets of the students) at the beginning of the course. Based on the results of this self-reported survey, teachers may adjust the focus of discussions on the syllabus. Learning activities should be at increasing difficulty levels to tailor the different students’ skill levels. This may gradually boost the confidence of the students as well as reinforce their positive sentiments.
Overall, the results of the sentiment analysis were found to be positive. As shown in Table , there are more positive sentiments than negative sentiments. As a result, students’ positive attitudes toward the course outweigh their negative attitudes. This means that, while students are concerned about the course content due to the mathematics and programming challenges, they remain optimistic about the learning they will gain and its relevance to finding jobs after graduation. These hopeful feelings are reflected in their narratives (e.g., “Also, we [students] will be very marketable in the industry if we have good skills in Data Analytics.”).
6. Practical implications
The findings of the study offer practical implications that are both beneficial to teachers and students. First, it informed teachers on the importance of understanding the initial perceptions of the students. Initial perceptions are needed to confirm the right notions about the course and to clarify the misconceptions. This will avoid a mismatch between the course expectations and the actual course content. Hence, students’ frustrations (Eltegani & Butgereit, Citation2015) and teacher-student animosity can be avoided (Miley & Gonsalves, Citation2004).
The second implication, drawn from the first implication, is to make the syllabus and teaching strategies flexible. Teachers may revise and refocus the content to address the weak points of the students. The third implication is the use of datasets from different fields. This implication stems from the limited awareness of the application of data analytics. Lastly, teachers may use datasets generated from different fields to expose the students to the different applications of data analytics. The use of open-source datasets is encouraged (e.g., Kaggle, Data.gov).
7. Limitations
This study has some limitations that should be mentioned. The first limitation is the number of texts examined. Despite having a total of 8,862 words, the corpus only contained 2,893 words. This was attributed to the second limitation of the study: the number of students enrolled in the course. The research population is relatively small due to the dwindling number of students caused by the COVID-19 pandemic. A long-term study data collection or study replication program at other educational institutions can be initiated. Furthermore, it is unclear how the words are related. Finding the relationships between the words will lead to a better understanding of the students’ sentiments.
8. Conclusion, recommendations, and future works
This study determined the students’ perceptions, course expectations, and anxiety toward the Data Analytics course. Toward this goal, students’ essays collected from Data Analytics courses offered in three different semesters were analyzed through a text mining approach. It was shown that students had a clear understanding of the purpose of the course but had a narrow insight into its applications. Hierarchical cluster analysis revealed that the words reflecting the course expectations of the students could be classified into three groups. Students are expected to learn the goal and application of the course and to develop their data analytics skills. Of the three clusters of course expectations, students heavily emphasized skills development. None of the students expressed unrealistic course expectations.
Sentiment analysis disclosed the emerging pattern of sentiments related to the course. Students did feel anxiety about the course. They felt anxious about the course because it requires programming, mathematics, statistics, and communication skills. In other words, the interdisciplinary requirements of the course contribute to the perceived difficulty of the course. Nonetheless, more words expressed positive than negative sentiments. Hence, they were optimistic about learning the course.
Data analytics educators are advised to determine the programming, writing, and mathematics skills as well as the anxiety levels of the students. They are also encouraged to provide laboratory exercises with increasing difficulty levels to develop the confidence of the students. Moreover, educators are encouraged to prepare laboratory exercises that entail different datasets from various fields. Finally, they could initiate future studies that measure the effectiveness of these strategies. Other text mining approaches (e.g., k-means clustering, word association), too, may be employed to further analyze the data.
Future research may include students from other institutions who are taking Data Analytics courses. This current study may also be extended to other student populations in other courses. In this current study, students’ perceptions were only collected at a single point in time (i.e., at the beginning of the course). Hence, at the end of the semester, students’ perceptions may be collected to determine changes in their sentiments. Finally, a more detailed form of sentiment (e.g., happy, sad, angry, etc.) and topic modeling can also be employed in the future.
Acknowledgement
The authors are indebted to the participants of the study. The icons used in these figures were created and provided by the Freepik-Flaticon website.
Disclosure statement
No potential conflict of interest was reported by the author(s).
Data availability statement
Data cannot be shared due to existing laws in the country of the primary author.
Additional information
Funding
References
- Abdel Latif, M. M. (2015). Sources of L2 writing apprehension: A study of Egyptian university students. Journal of Research in Reading, 38(2), 194–17. https://doi.org/10.1111/j.1467-9817.2012.01549.x
- ACL Services Ltd. (2021). Galvanize: A diligent brand. https://www.wegalvanize.com/
- Asamoah, D. A., Sharda, R., Hassan Zadeh, A., & Kalgotra, P. (2017). Preparing a data scientist: A pedagogic experience in designing a big data analytics course. Decision Sciences Journal of Innovative Education, 15(2), 161–190. https://doi.org/10.1111/dsji.12125
- Badawy, A. H. A., Schmitt, K. R., Kramer, S. R., Hrapczynski, K. M., Larsen, E. A., Andrew, A. A., & Benson, S. A. (2013). Expectations of computing and other STEM students: A comparison for different class levels, or (CSE≠ STEM-CSE)| Course level. In 2013 IEEE Frontiers in Education Conference (FIE) (pp. 1657–1663). IEEE.
- Balahadia, F. F., Fernando, M. C. G., & Juanatas, I. C. (2016). Teacher’s performance evaluation tool using opinion mining with sentiment analysis. In 2016 IEEE region 10 symposium (TENSYMP) (pp. 95–98). IEEE.
- Barroso, C., Ganley, C. M., McGraw, A. L., Geer, E. A., Hart, S. A., & Daucourt, M. C. (2021). A meta-analysis of the relation between math anxiety and math achievement. Psychological Bulletin, 147(2), 134–168. https://doi.org/10.1037/bul0000307
- Brandon, D. (2015). Teaching data analytics across the computing curricula. Journal of Computing Sciences in Colleges, 30(5), 6–12. https://dl.acm.org/doi/10.5555/2752981.2752983
- Bringula, R., Reguyal, J. J., Tan, D. D., & Ulfa, S. (2021). Mathematics self-concept and challenges of learners in an online learning environment during COVID-19 pandemic. Smart Learning Environments, 8(1), 1–23. https://doi.org/10.1186/s40561-021-00168-5
- Bringula, R. P., Victorino, J. N., Leon, M. M. D., & Estuar, R. (2019). Cluster and sentiment analyses of YouTube textual feedback of programming language learners to enhance learning in programming. In Proceedings of the future technologies conference (pp. 913–924). Springer, Cham.
- Buckley, M. R., Novicevic, M. M., Halbesleben, J. R., & Harvey, M. (2004). Course management and students’ expectations: Theory‐based considerations. International Journal of Educational Management, 18(2), 138–144. https://doi.org/10.1108/09513540410522261
- Carli, R., Paniccia, R. M., Giovagnoli, F., Carbone, A., & Bucci, F. (2016). Emotional textual analysis. Oxford University Press.
- Casad, B. J. (2007). Expectations. In R. F. Baumeister & K. D. Vohs (Eds.), Encyclopedia of social psychology (Vol. 1, pp. 327–328). SAGE Publications.
- Caviola, S., Toffalini, E., Giofrè, D., Ruiz, J. M., Szűcs, D., & Mammarella, I. C. (2022). Math performance and academic anxiety forms, from sociodemographic to cognitive aspects: A meta-analysis on 906,311 participants. Educational Psychology Review, 34(1), 363–399. https://doi.org/10.1007/s10648-021-09618-5
- Celestial-Valderama, A. M., Vinluan, A., & Moraga, S. D. (2021). Mining students’ feedback in a general education course: Basis for improving blended learning implementation. International Journal of Computing Sciences Research, 5(1), 568–583. https://doi.org/10.25147/ijcsr.2017.001.1.60
- Connolly, C., Murphy, E., & Moore, S. (2008). Programming anxiety amongst computing students—A key in the retention debate? IEEE Transactions on Education, 52(1), 52–56. https://doi.org/10.1109/TE.2008.917193
- Cowen, K. J., Hubbard, L. J., & Hancock, D. C. (2018). Expectations and experiences of nursing students in clinical courses: A descriptive study. Nurse Education Today, 67, 15–20. https://doi.org/10.1016/j.nedt.2018.04.024
- Dirzyte, A., Vijaikis, A., Perminas, A., & Rimasiute-Knabikiene, R. Associations between depression, anxiety, fatigue, and learning motivating factors in e-learning-based computer programming education. (2021). International Journal of Environmental Research and Public Health, 18(17), 9158. article 9158. https://doi.org/10.3390/ijerph18179158
- Eltegani, N., & Butgereit, L. (2015). Attributes of students engagement in fundamental programming learning. In 2015 International Conference on Computing, Control, Networking, Electronics and Embedded Systems Engineering (ICCNEEE) (pp. 101–106). IEEE.
- Ferreira‐Mello, R., André, M., Pinheiro, A., Costa, E., & Romero, C. (2019). Text mining in education. Wiley Interdisciplinary Reviews: Data Mining and Knowledge Discovery, 9(6), e1332. https://doi.org/10.1002/widm.1332
- Foundation, T. R. (2022). The Comprehensive R Archive Network (CRAN). https://cran.r-project.org/
- Halkidi, M. (2018). Hierarchical clustering. In L. Liu & M. T. Özsu. (Eds.), Encyclopedia of database systems (pp. 1–5). Springer. https://doi.org/10.1007/978-1-4614-8265-9_604
- Havenga, M., Breed, B., & Mentz, E. (2013). Metacognitive and problem-solving skills to promote self-directed learning in computer programming: Teachers’ experiences. SA-eDUC, 10(2), 1–12.
- Hidalgo-Blanco, M. A., Puig-Llobet, M., Lluch-Canut, M. T., Guardia-Olmos, J., Moreno-Arroyo, C., & Amador-Campos, J. A. (2020). Expectations of nursing degree students: A longitudinal analysis. Nurse Education Today, 92, 104474. https://doi.org/10.1016/j.nedt.2020.104474
- Hooda, M., & Saini, A. (2017). Academic anxiety: An overview. Educational Quest: An International Journal of Education and Applied Social Sciences, 8(3), 807–810.
- International Business Machine Cloud Education. (2020). Text mining. https://www.ibm.com/cloud/learn/text-mining
- Jusoh, S., & Alfawareh, H. M. (2012). Techniques, applications and challenging issue in text mining. International Journal of Computer Science Issues (IJCSI), 9(6), 431–436. https://www.ijcsi.org/papers/IJCSI-9-6-2-431-436.pdf
- Kallia, M., & Sentence, S. (2018). Are boys more confident than girls? The role of calibration and students’ self-efficacy in programming tasks and computer science. In Proceedings of the 13th workshop in primary and secondary computing education: WIPSCE ‘18. https://doi.org/10.1145/3265757.3265773
- Lawler, J., & Molluzzo, J. C. (2015). A proposed concentration curriculum design for big data analytics for information systems students. Information Systems Education Journal, 13(1), 45–57 http://isedj.org/2015-13/n1/ISEDJv13n1p45.html.
- Lin, C. E. (2021). Anxiety. In F. R. Volkmar. (Ed.), Encyclopedia of Autism Spectrum Disorders (pp. 204–205). Springer. https://doi.org/10.1007/978-3-319-91280-6_2000
- Miley, W. M., & Gonsalves, S. (2004). Grade expectations: Redux. College Student Journal, 38(3), 327–333.
- Miranda, J. P., & Bringula, R. P. (2021). Exploring Philippine presidents’ speeches: A sentiment analysis and topic modeling approach. Cogent Social Sciences, 7(1), 1932030. https://doi.org/10.1080/23311886.2021.1932030
- Miranda, J. P. P., & Martin, J. T. (2020). Topic modeling and sentiment analysis of martial arts learning textual feedback on YouTube. International Journal of Advanced Trends in Computer Science and Engineering, 9(3), 2712–2718. https://doi.org/10.30534/ijatcse/2020/35932020
- Mite-Baidal, K., Delgado-Vera, C., Solís-Avilés, E., Espinoza, A. H., Ortiz-Zambrano, J., & Varela-Tapia, E. (2018). Sentiment analysis in education domain: A systematic literature review. In International conference on technologies and innovation (pp. 285–297). Springer, Cham.
- Namkung, J. M., Peng, P., & Lin, X. (2019). The relation between mathematics anxiety and mathematics performance among school-aged students: A meta-analysis. Review of Educational Research, 89(3), 459–496. https://doi.org/10.3102/0034654319843494
- Nisa, R., & Qamar, U. (2015). A text mining-based approach for web service classification. Information Systems and e-Business Management, 13(4), 751–768. https://doi.org/10.1007/s10257-014-0252-5
- Nolan, K., & Bergin, S. (2016). The role of anxiety when learning to program: A systematic review of the literature. In Proceedings of the 16th Koli calling: An international conference on computing education research (pp. 61–70). New York, NY: ACM.
- Nugroho, A., Harwani, Y., Dewita, A., & Sihite, J. (2015). Is it traditional or contemporary marketing strategy? A textual cluster analysis@ MercuBuana_Reg. Mediterranean Journal of Social Sciences, 6(5 S5), 26–33. https://doi.org/10.5901/mjss.2015.v6n5s5p26
- Owolabi, J., Olanipekun, P., & Iwerima, J. (2014). Mathematics ability and anxiety, computer and programming anxieties, age and gender as determinants of achievement in basic programming. GSTF Journal on Computing (Joc), 3(4), 1–6. https://doi.org/10.7603/s40601-013-0047-4
- Özer, S. (2018). A qualitative study to determine expectations of students studying at a faculty of tourism from vocational English course. International Journal of Progressive Education, 14(4), 15–25. https://doi.org/10.29329/ijpe.2018.154.2
- Pekrun, R. (2014). Emotions and learning. Gonnet Imprimeur.
- Rith-Najarian, L. R., Boustani, M. M., & Chorpita, B. F. (2019). A systematic review of prevention programs targeting depression, anxiety, and stress in university students. Journal of Affective Disorders, 257, 568–584. https://doi.org/10.1016/j.jad.2019.06.035
- Sad, S. N., Kis, A., Demir, M., & Özer, N. (2016). Meta-analysis of the relationship between mathematics anxiety and mathematics achievement. Pegem Egitim Ve Ogretim Dergisi= Pegem Journal of Education and Instruction, 6(3), 371–392. https://doi.org/10.14527/pegegog.2016.019
- Sharma, P., Tulsian, D., Verma, C., Sharma, P., & Nancy, N. (2022). Translating speech to Indian Sign Language using natural language processing. Future Internet, 14(9), article 253. https://doi.org/10.3390/fi14090253
- Shi, Y., Zhu, L., Li, W., Guo, K., & Zheng, Y. (2019). Survey on classic and latest textual sentiment analysis articles and techniques. International Journal of Information Technology & Decision Making, 18(4), 1243–1287. https://doi.org/10.1142/S0219622019300015
- Silge, R., & Robinson, D. (2017). Text mining with R: A tidy. approach. O’Reilly Media, Inc.
- Soler, O. M., Aguayo-González, M., Gutiérrez, S. S. R., Pera, M. J., & Leyva-Moral, J. M. (2021). Nursing students’ expectations of their first clinical placement: A qualitative study. Nurse Education Today, 98, 104736. https://doi.org/10.1016/j.nedt.2020.104736
- Ulfa, S., Bringula, R., Kurniawan, C., & Fadhli, M. (2020). Student feedback on online learning by using sentiment analysis: A literature review. In 2020 6th international conference on education and technology (ICET) (pp. 53–58). IEEE.
- Weathers, D., & Aragón, O. (2019). Integrating analytics into marketing curricula: Challenges and effective practices for developing six critical competencies. Marketing Education Review, 29(4), 266–282. https://doi.org/10.1080/10528008.2019.1673664
- Weirich, T. R., Tschakert, N., & Kozlowski, S. (2017). Teaching data analytics using ACL. Journal of Emerging Technologies in Accounting, 14(2), 83–89. https://doi.org/10.2308/jeta-51895
- Weirich, T. R., Tschakert, N., & Kozlowski, S. (2018). Teaching data analytics skills in auditing classes using Tableau. Journal of Emerging Technologies in Accounting, 15(2), 137–150. https://doi.org/10.2308/jeta-52264
- Zadorozhna, I., Datskiv, O., & Shon, O. (2020). Exploring students’ expectations of the university course. Revista Românească Pentru Educaţie Multidimensională, 12(1), 293–303. https://doi.org/10.18662/rrem/12.1sup1/236