
 ?Mathematical formulae have been encoded as MathML and are displayed in this HTML version using MathJax in order to improve their display. Uncheck the box to turn MathJax off. This feature requires Javascript. Click on a formula to zoom.
Abstract
Urbanisation in Ghana has been associated with significant effects on the land surface temperature which has its impacts on the natural environment. Conventional literature exhibits that land surface temperature associated with urbanisation have concentrated in the developed world leaving the African terrain unattended to. Hence, its knowledge and implications in Africa and for that matter Ghana is deficient. This study is two-pronged a) examines the relationship between land surface temperature coupled with its spatial patterns (b) examines the surface urban heat island and urban-rural gradient in Greater Accra region of Ghana. Landsat images for 1991, 2002, 2012 and 2020 were used where demarcations for spatial integrity were done. The use of machine learning algorithms were adopted in the land use classification. It was observed that Accra would experience high impervious surface mostly due to rural–urban migration purposely to seek for employment. It was concluded that in order to achieve the Sustainable Development Goals (especially goals 3,6,11 and 13) more efforts should be made to improve the conditions in the rural areas in order to curtail the migration drive which does not only put pressure on the social amenities in the urban areas but also exacerbate in the land surface temperature situation.
1. Introduction
The past years have been characterised by record growth of urban population and urban areas globally, have had massive impact on the natural environment at different spatial scales (Chen et al., Citation2014). Thus, urban growth has affected the natural landscape as it produces impervious surfaces which has become one of the most critical global issues in the 21st century (R.C. Estoque & Murayama, Citation2016; Reba & Seto, Citation2020; D. Zhang et al., Citation2020).
Despite Africa being the less developed continent in terms of urban growth, its urbanisation is ostensibly seen as the one of the fastest growing in the world (Guneralp et al., Citation2018). The urban population in Africa has been growing at a very fast rate, from about 28% in 1980 (Roxburgh et al., Citation2010) to 43% in 2018 and projected to be about 60% by 2050 (UN-DESA, Citation2018). However, most of the urban areas in Africa have been unplanned and unregulated, worsened by the legacy from colonialism, structural adjustment and neo-liberalism that has constantly produce frail urban planning institutions (Parnell & Oldfield, Citation2014).
The rapid growth in urbanisation without proper planning and implementation has led to several socio-environmental problems, such as climate change (IPCC, Citation2014; Marcotullio et al., Citation2021), deforestation (Michishita et al., Citation2012), water and air quality (Franco et al., Citation2017), energy systems (Grimm et al., Citation2008), environmental health (Cao et al., Citation2017) and increase in area of impervious surface resulting from unplanned infrastructural expansion and increase in population density. Thus, these changes in Land Use Land Cover (LULC) cause biochemical activities which have local, regional as well as global effect on climates and also cause heat emissions from the land surface and the atmosphere, which is the urban heat island (UHI) effect (Gallo et al., Citation1996; Hale et al., Citation2006; Kikon et al., Citation2016; While & Whitehead, Citation2013; Wu et al., Citation2013). The UHI is a phenomenon that refers to the occurrence of higher temperatures in urban areas than surrounding peri-urban and rural areas (Estoque et al., Citation2017b; Ranagalage, Estoque et al., Citation2018; X. Zhang et al., Citation2017; Zhou et al., Citation2011). The UHI results from changes in land cover, purposely the replacement of natural vegetation and agricultural lands by impervious surface such as concrete, asphalt, rooftops and building walls, which are associated with the use of urban land (Buyantuyev & Wu, Citation2010). The UHI effect has some negative impacts such as increase in energy consumption, elevated emissions of air pollutants and greenhouse gases, impaired water quality and some environmental conditions that affect health and comfortability of humans (EPA, Citation2008; Voogt, Citation2018). In view of this, the issue of UHI has become a critical research area in various disciplines such as climate change, urban ecology, urban and spatial planning and urban geography.
Additionally, several research have shown that land surface temperature (LST) can be related to land cover, such as impervious surfaces (Ogashawara & Brum, Citation2012; Szabó et al., Citation2019; Xiao et al., Citation2007) and vegetation areas (Estoque et al., Citation2017b; Maimaitiyiming et al., Citation2014a; Ranagalage, Estoque et al., Citation2018), to understand the surface UHI (SUHI) effect in urbanized area, and SUHI refers to UHI which is measured using surface. However, literature has constantly demonstrated that increasing vegetation cover in urban areas has a mitigating effect on UHIs, while increase in impervious surfaces increases urban heating (Kong et al., Citation2014; Maimaitiyiming et al., Citation2014a; Weng et al., Citation2004). Recent studies have used techniques such as urban–rural gradient and statistical analysis (Estoque et al., Citation2017b; Kushwaha et al., Citation2021; Ranagalage et al., Citation2017; Rousta, Sarif, Gupta, Olafsson, Ranagalage, Murayama, Zhang, Mushore et al., Citation2018a) and UHI intensity analysis (Estoque et al., Citation2017b; Memon et al., Citation2009; Sheng et al., Citation2017) to mostly understand the effect of landscape patterns on LST (i.e., the UHI effect). Additionally, there has also been increasing interest in the spatial structure and configuration of impervious surface and vegetation areas owing to the different mix or complication of different urban environments. Many studies have applied urban landscape metrics-based techniques to show that the spatial structure and configuration of impervious surfaces and vegetation areas (e.g., size, patch density and complexity) affect the degree of LST (Kong et al., Citation2014; Maimaitiyiming et al., Citation2014a). However, most studies examining LST globally, have focused on big cities with only few of such studies conducted on cities in Africa (Akinbobola, Citation2019; Tarawally et al., Citation2018; Abdramane et al., Citation2018; Muro et al., Citation2018). Nonetheless, not much has been done with respect to LULC change impact on LST in emerging cities in comparison to the big cities, hence the need to fill this gap. By emerging cities, it refers to small and medium-sized cities with a million or fewer inhabitants (Akinyemi et al., Citation2017). SUHIs have been studied mostly in tropical and temperate regions (Kondo et al., Citation2021; Monteiro et al., Citation2021; Richard et al., Citation2021). Knowledge about LST and its interaction with LULC in African emerging cities in coastal regions is also lacking. Understanding how urbanization is associated with the SUHI in the coastal savannah region is still limited
Therefore, this study examines: (1) the relationship between LST, and the spatial patterns, composition and configuration of impervious surfaces and vegetation (2) examines the SUHI and urban-rural gradient in Greater Accra region of Ghana.
2. Materials and methods
2.1. Study area
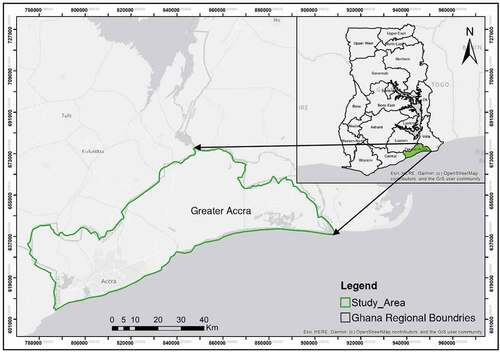
Accra is the capital city of Ghana and the regional capital of Greater Accra region and has the population density of 37522 people per square mile which is relatively smallest area (3,245 km2) among the sixteen administrative regions of the country, representing 1.4 % of the total land mass of Ghana. It is located between latitude 5.500° to 5.9167° N and longitude 0.2500° to 0.4167° W in the southern part of Ghana with a mean elevation of 190 m and lies about 618 km north of the equator (latitude 0°). The region is bordered on the south by the Gulf of Guinea, north by Eastern and on the east and west by Volta and central regions, respectively (Figure ). The region is known to be the coldest region in Ghana with high and average temperatures of 31°C and 27°C respectively. However, February and March are the hottest months with average temperature ranging between 24°C and 33°C, and June to September being the coldest with an average temperature range of 22°C to 29°C. The rainfall pattern can be described as bi-modal with major wet season from March to July and minor wet season from September to November (Manzanas et al., Citation2014; Owusu & Waylen, Citation2013). The average annual rainfall of the region ranges between 740 mm and 890 mm (Manzanas et al., Citation2014). However, the wet season is mostly cloudy, the dry season partly cloudy and is hot and oppressive all year round. In terms of vegetation, it was originally covered by tropical forest, but agricultural clearing and urban growth have immensely modified the vegetation composition to Herbaceous and shrub vegetation in sparsely settled areas. It is now the most populous region in Ghana with a population size of 5.5 million representing 17.7% of the total population in Ghana (GSS, 2021). There has been an exponential growth of the population in Accra which is largely due to immigration. Various strategies by the government to address the migration challenges which includes decentralisation have proved futile. Currently, the city of Accra has the population growth of 1.89 percent where in 2019 it was 1.47 per cent and it is expected to increase by 2.75 percent in 2030 (Cudjoe et al., Citation2021; Kanhai et al., Citation2021).
Figure 1. Map of the study area (Greater Accra).
2.2. Satellite images and pre-processing
The Landsat images were downloaded using the Google Earth Engine (GEE) platform for 1991, 2002, 2012, and 2020. First, the demarcated boundary for the study area was clipped from the whole Ghana map and prepared the boundary shapefile. Secondly, the boundary shapefile was imported on Asset in GEE, and a script was ran for Greater region to download Landsat imageries for dry season (November to February). LST in tropical cities is better derived for the dry season due to cloud-coverage problems, with studies showing that the SUHI phenomenon is more prominent during the dry season (Dissanayake et al., Citation2019, Citation2018; Estoque et al., Citation2017b). Additionally, the dry season was also chosen so as to eliminate non-permanent green spaces that only exist during the wet season and also give good classification results by avoiding biases. At this instance, the four times for four time points were ran. Using the Image Collection tool in GEE, four final Landsat imageries were prepared, including one image for 1991 (Landsat 4 TM), two images for 2002 and 2011 (Landsat 7 ETM+), and one image for 2020 (Landsat 8 OLI) Table for Greater Accra region.
Table 1. Features of Landsat satellite images used in the research
The downloaded images were four cloud-free (<10%), which were projected onto the WGS84/UTM 32 N projection system before further processing. Both atmospheric and radiometric calibration correction was carried out using the TerrSet Geospatial Monitoring and Modelling Software during the pre-processing stage. The essence of this pre-processing was to convert the digital number (DN) values of the multispectral bands (bands 1–7 and 9) into surface reflectance values and convert the DN values of the thermal bands (bands 10 and 11) into at-satellite brightness temperature (TB) expressed in degrees Kelvin (Estoque et al., Citation2017b). The pre-processed data were then used for the classification of the vegetation, impervious surfaces, other classes and extraction of the LST.
2.3. LULC Classification
The LULC maps were developed by applying a machine learning algorithm: artificial neural network (ANN) using R software (R project 2021). In the classification of LULC, bands 4, 3, and 2 for Landsat 5 and Landsat 7 ETM+ and bands 5, 4, and 3 for Landsat 8 OLI were used. The spatial resolution of the prepared LULC maps was 30 × 30 m for all the images. Four LULC types were used for this classification: (i) bare land (BL; made up of sandy areas and stone land); (ii) vegetation (VG; made up of forest, cropland, grassland, and shrub); (iii) impervious surface (IS; made up of all kind of impervious surface areas including buildings, roads, and airports); and (iv) water (W; made up of all kinds of water bodies, e.g., rivers, and ponds). Garmin handheld GPS (accuracy between 0.3–3 m) were used to record point locations of all the LULC, Google Earth’s historical images were also used as reference data to pick some of the point locations. These point locations from the field and google earth were used for the classification and accuracy assessment using the ANN algorithm. Accurate results were generated by automatic sampling in the algorithm using 250 points each year and four LULC maps for each year were generated based on the four LUC types defined earlier. In the next step, the classified LULC maps were ranked based on the highest overall accuracy value and determined the LULC patterns generated by K-nearest neighbor (Athukorala & Murayama, Citation2021), with the overall accuracy was over 80% each year. Subsequently, post-classification corrections as the majority filter and hybrid classification method to avoid misclassification errors and salt and pepper noise were applied (Erkan & Gökrem, Citation2018; Kamusoko & Aniya, Citation2009; Thapa & Murayama, Citation2007)
2.4. Calculation of LST
The methods for calculating LST from Landsat data have been extensively used in various research. The first step is converting DNs of the thermal bands (i.e., bands 10 and 11 in Landsat-8) to absolute units of at-sensor spectral radiance (Li, song et al., Citation2011; Weng, Citation2009; Chander et al., 200). Second, the thermal band data is converted from at-sensor spectral radiance to effective at-sensor brightness temperature, under the assumption that the Earth’s surface is a black body (i.e., spectral emissivity = 1) using EquationEquation (1; Chander et al., Citation2009; USGS(USGS (United States Geological Survey), Citation2016).
where TB is the effective at-sensor brightness temperature in degrees Kelvin, Lλ is the spectral radiance at the sensor’s aperture in W/(m2 sr µm) and K1 and K2 are pre-launch calibration constants (i.e., thermal conversion constants for the bands 10 or 11 provided in the Landsat-8 metadata (USGS(USGS (United States Geological Survey), Citation2016)). Then, the at-sensor brightness temperatures are corrected for varied spectral emissivity depending on the nature of the land cover and LST is retrieved (Estoque et al., Citation2017b).
In this study, prior to LST calculation, (J. A. Sobrino et al., Citation2004) method was used to obtain the land surface emissivity (ε; EquationEquation (5)) for each study area. This method takes into account standard deviation (m), a combined mean value of the soil and vegetation emissivities cd (n) and the vegetation proportion (Pv), calculated by EquationEquations (2)
–(Equation4
), respectively.
where, εs is the soil emissivity, εv is the vegetation emissivity and F is a shape factor whose mean value, assuming different geometrical distributions, is 0.55 (J. A. Sobrino et al., Citation2004).
The NDVI is computed using the surface reflectance of bands 4 (ρred) and 5 (ρNIR) of Landsat-8 (EquationEquation (6); (Estoque et al., Citation2017b)
ε was calculated using the values 0.004 for m and 0.986 (J. A. Sobrino et al., Citation2004). The brightness temperatures (TB) were finally converted to degrees Celsius (°C), which was used to calculate the emissivity-corrected LST using; J. A. Sobrino et al., Citation2004; Li, Song et al., Citation2011; Weng et al., Citation2004):
where λ = wave- length of emitted radiance (λ = 10.8 µm, for Landsat-8 band 10 [8]); ρ = h × c/σ (1.438 × 10 − 2 m K), σ = Boltzmann constant (1.38 × 10 − 23 J/K), h = Planck’s constant (6.626 × 10 − 34 Js) and c = velocity of light (2.998 × 10⁸ m/s); and ε is the land surface emissivity.
2.5. Land cover extraction
Most studies have been able to relate LST to land cover (Estoque et al., Citation2017b; Xiao et al., Citation2007), particularly impervious surfaces and vegetation (Maimaitiyiming et al., Citation2014a; Weng et al., Citation2004), to understand the SUHI effect in urban areas. This study used the pre-processed Landsat-8 images to extract impervious surfaces and green spaces using spectral indices. The suitability of the spectral-based method for the extraction of land cover has been proven by several studies (Ranagalage et al., Citation2017; X. Zhang et al., Citation2017). In the extraction of land cover, the modified normalized difference water index (MNDWI), which has been proven to perfectly separate water from non-water features, was first used to extract water bodies and excluded them from the images (Xu, Citation2006).
where ρGreen and ρSWIR1 are the surface reflectance values of bands 3 and 6 of the Landsat-8 images, respectively.
Thereafter, the visible red and NIR-based built-up index (VrNIR-BI) was used to extract impervious surfaces. One of the most noted spectral confusions in the land cover classification of African landscapes is between the impervious surface (IS) and bare lands usually characterized by dry grasslands and abandoned croplands. The VrNIR-BI can precisely separate impervious surfaces from bare lands (Estoque et al., Citation2017b), which mostly mix with each other during LULC classification of the African landscapes (EquationEquation 9):
where ρRed and ρNIR are the surface reflectance values of bands 4 and 5 of the Landsat-8 images, respectively. The NDVI was used to extract the vegetation for the study area (EquationEquation 6) below, and is one of the widely used indices when relating LST to vegetation in SUHI studies (Weng et al., Citation2004). The VrNIR-BI and NDVI was extracted using manual thresholding after several tests of visual assessments of the index maps using the Landsat-8 images and high-resolution Google earth imagery in the study area. The thresholds applied to extract VrNIR-BI and NDVI for the study area were 0.45 and −0.425 respectively. A LULC map was finally produced for the study area containing four categories, impervious surfaces, vegetation, bareland and water.
2.6. Intensity analysis of SUHI
The SUHI intensity which is defined as the difference in temperature between an urban and a rural area (Oke, 1973) is used to measure the effect of SUHI across the urban–rural landscape. It is calculated using either air temperature from meteorological data or mean surface temperatures from satellite images (Estoque et al., Citation2017b). The study area was divided into two major areas, urban and peri-urban, which was used to analyse the patterns of SUHI intensity. To demarcate the urban and peri-urban areas, the urban area was estimated using the physical extent of the impervious surface in the study area. Additionally, a wide range of social, economic, demographic, administrative or political indicators were also used to define urban areas, however, there is no laid down procedure on how to develop a constant definition based on any single set of attributes . The terms “urban area” or “urban footprint” are widely used to refer to the spatial extent of urbanized areas on a regional scale; a definition which is both fuzzy and inconsistent;. In view of this, defining the urban area based on the physical extent of the built-up land (impervious surface), as used in some remote sensing urban studies, is the best option. The concentric zones were used to define the urban area, i.e., all concentric zones that contained impervious surfaces in the study area. Thus, all concentric zones beyond the maximum radius of the urban or built-up footprint were considered as peri-urban.
The SUHI intensity was calculated using the difference between the average LST at the center of the city (i.e., 0 kilometer) and the average LST of the 200 m concentric zones created across the urban/peri-rural landscape. The formula for the calculation of SUHI is shown in Equation (100
where µLST0 is the kilometer 0 mean LST at the city center of the study area and µLSTi is the average LST in each buffer zone (SZ), where i = 1,2,3 … . n and n is the total number of buffer zones in the study area. The Pearson correlation analysis and scatter plots were used to examine the relationship of average LST and the percentage cover of impervious surfaces and vegetation in each of the 200 m buffer zones created.
3. Results
3.1. Accuracy assessment of LULC classification
The results of the accuracy assessment are shown in Tables . The Table shows that user and producer accuracy indices yielded more than 80% modelling accuracy for all the years. Additionally, the overall accuracy index of the 4-year classification using the RF algorithm was about 96%. The kappa coefficients for the four-year classification were 0.92, 0.95, 0.96, and 0.95, respectively, for 1991, 2002, 2011 and 2020. Previous research has proven that, kappa coefficients greater than 0.75 indicate compatibility of the classification and reference data (Wondrade et al., Citation2014). From Table , the overall accuracy of LULC classification is well preserved
Table 2. LULC classification accuracy of Greater Accra for Producer and User accuracy respectively
Table 3. Overall classification accuracy and Kappa coefficient for LULC maps
3.2. LUC Changes and magnitude
Figure shows the spatial distribution of LULC classification for Greater Accra in 1991, 2002, 2011, and 2020, respectively, produced by the ANN algorithm. The entire area was grouped into five typical LULC classes. The calculated area and percentage of each land-use class are shown in Table , and a summary of LULC gains/loss and rate of change for the studied period is shown in Table . In Table , the minus (−) sign is an indication that a particular LULC decreased and a plus (+) sign indicates an increase relative to the previous time step
Figure 2. Land-Use/Land-Cover classification pattern in 1991, 2002, 2011, and 2020.
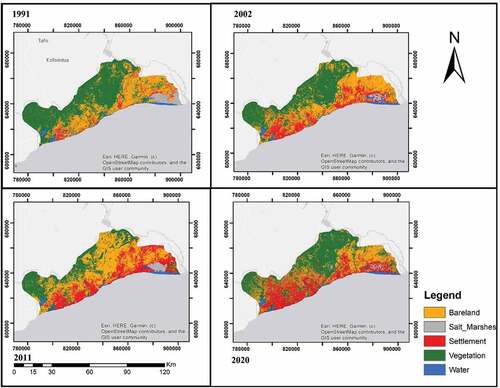
Table 4. Land-use/land-cover areas in 1991, 2002, 2011, and 2020
Table 5. Land-use/land-cover change statistics of Greater Accra in 1991, 2002, 2011, and 2020
LULCC over the 29-year study period in Greater Accra was analyzed to identify and quantify the amount of land involved in land transitions from one class type to another. The classified maps in show that Greater Accra has seen fast urbanization change over the 29-year period (Figure ). From 1991 to 2002, the IS area increased from 17.6 km2 (4.87%) to 52.12 km2 (14.70) between 1991 and 2002, to 93.42 km2 (26.35%) between 2002 and 2011, and to 123.85 km2 (34.94%) between 2011 and 2020, thus, the IS area increased by 106.59 km2, during the period of study (1991 to 2020; Table ). The increase in the IS area in the 1991–2002 period was faster (18.35%) than in the 2002–2011 and 2011–2020 period, each recording 7.93% and 3.62% respectively (Table ). The Vegetation areas showed a continuous decrease, i.e., a total net loss of 114.03 km2 from 1991 to 2020. The other LULC classes saw inconsistent trend within the periods, with some experience gains in some periods and losses in other periods too (Table ). Generally, the results of LULC change show that the spatial extent of the urban area of the city increased from 1991 to 2020. However, impervious surfaces such as built-up and asphalt areas expanded to the east, south, and west parts of the city. Green areas, such as agricultural lands and vegetation cover, and bare land were converted into impervious surfaces. Thus, fast urbanization had severe effects on the temperature-stabilizing areas of the city. In all, the IS area has greatly increased resulting in rapid urbanization in Greater Accra.
3.3. Spatial trends of LST and NDVI
The spatial trends of LST and NDVI were analyzed for the period November 1991 to February 2020 as shown in Figures . LST patterns were examined in five LULC classes to represent various land cover transitions and persistent land cover areas of importance in the study area. Significant increasing trends in LST were observed for all the years over the study area. LST increase was highest over IS (Settlement) areas such as Kwashieman, Ashiaman, Amansaman, Madina and Dowanya (with min of 23 °C and max 35°C). The LST trends at green (vegetation) areas, however, are reversed showing a significant decrease when compared to the IS LST (min 19°C and max 27°C), whereas significant increases were mostly found over the large settlement areas. LST increase was lower over the peri-urban areas such as Asutuare (min 24, max 32) than over the urban areas such as Ashiaman (min 25°C, max 35°C) or the settlement expansion areas, LST trends increased and remained very high over urbanizing areas (e.g., Weija, Kwashieman, Madina and Achimota). LST trends varied over bareland areas depending on whether it is an area of abandoned agricultural land or salt_mashes (min 25°C, max 30°C).
Figure 3. Spatial distribution of LST in 1991, 2002, 2011, and 2020.
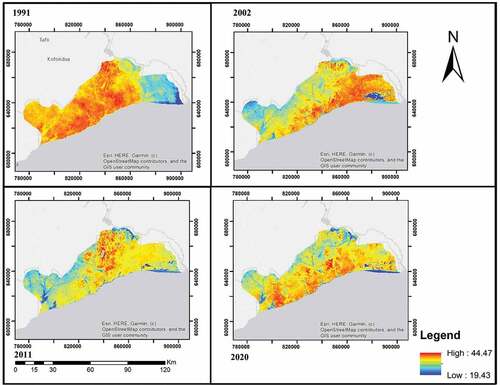
Figure 4. Spatial maps of NDVI in 1991, 2002, 2011, and 2020.
Additionally, the statistical measures of LST are presented in Table . The results show that the LST changed from 19.5 to 37.5°C, 21.9 to 38.7°C, 25.9–42.2°C, and 26.4–43.3°C during 1991, 2002, 2011, and 2020, respectively. Also, the mean LST increased from 28.5.4 to 36.8°C between 1991 and 2020, while in the first period it decreased by 2.3°C (Table ). Moreover, the mean LST did not change significantly from 2011 to 2020. However, a significant increase of 5.2°C occurred between 2002 and 2011. The mean LST for each LULC class is shown in Table . The results show that the highest and lowest LST are related to the Settlement and water classes, with 42.8 and 28.8°C respectively. The surface temperature for settlement increased by 3.0°C between 1991 and 2020. Moreover, the highest change in LST was recorded for the salt_marshes class by an increase of 5.3°C. Generally, the results revealed that the largest increase in LST occurred in settlement (IS) areas, whilst the lowest increase in LST is related to water and vegetation cover. This is primarily due to high evapotranspiration from water and vegetation that decreases temperature (Simwanda et al. 2019; Balew & Korme, Citation2020; Priyankara et al., Citation2019). Additionally, the vegetation cover tends to reduce the temperature by absorption and reflection of radiation and adjustment of latent and sensible heat exchange (Lin et al., Citation2017; Yue et al., Citation2007). As well, impervious surfaces and human-made constructions play a striking role in increasing the temperature (concrete, asphalt, and metal; Frazer, Citation2005; Nakayama & Fujita, Citation2010). The LST spatiotemporal variation is associated with urban expansion and the LULC variation, and this affects the UHI of the city (Balew & Korme, Citation2020; Correia Filho et al., Citation2019).
Table 6. Summary of LST (°C) for Greater Accra during November–February (1991–2020)
Table 7. Mean LST for each LU/LC class for Greater Accra (1991–2020)
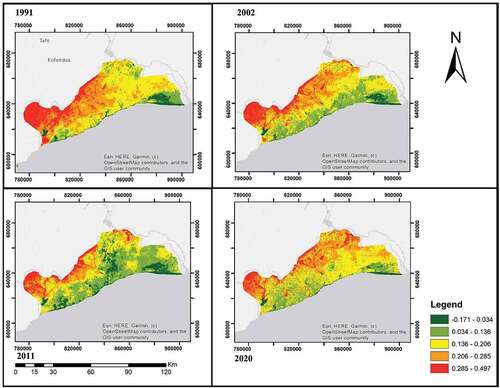
The NDVI maps and values were calculated to show vegetative and nonvegetative density of the five LULC classes (Figure ). The results from the NDVI maps show significant differences between vegetative density and non-vegetative density, with values typically ranging between −1 to 1. The vegetative areas showed relatively higher positive NDVI values between 0.2 and 0.7 for all the study periods. Settlement, bareland and salt_marshes areas had NDVI values between 0.1 and −0.28, and water had the lowest NDVI values ranging between −0.29 and −0.50 across the study area.
Also, the results from the NDVI maps shows how development and urbanisation have increased between 1991 to 2020. An evaluation of the average NDVI values for each year indicated a general reduction in the NDVI values from 1991 to 2020. Thus, there is a significant reduction in the greenness of the images from 1991 to 2020. The results suggest growth in urbanization during the last 29 years, while the forest and vegetative cover generally decreased, especially around Achimota, Kwashieman, Amansaman, Madina and Afienya. The year 2020 recorded the highest mean NDVI value of 0.32 with 2002 recording the lowest NDVI value of 0.25 (Table )
Table 8. Summary statistics of NDVI in 1991, 2002, 2011, and 2020
3.4. Relationship between the LST and NDVI
NDVI which is a vegetation index has been widely used to assess vegetation cover. It has also been used in many UHI studies as the cooling effect of vegetation related to latent heat vaporization and the convective cooling of tree canopies facilitate the air-cooling process (Chun & Guldmann, Citation2014). The distribution of NDVI for Greater Accra during the 29-year period is shown in Figure , and with statistical summary is given in Table . NDVI values between 0.2 and 0.8, denotes vegetation cover, while NDVI more than 0.8 shows a dense canopy cover. The NDVI for bare land and settlement is close to zero, and negative values depict water surface. The calculated mean NDVI was 0.30, 0.25, 0.31, and 0.32 in 1991, 2002, 2011, and 2020, respectively. The lowest values were observed in areas that are made up of bare land and settlements, which indicate that most part of the city is covered by impervious surfaces and buildings. However, the area covered by vegetation have a lower surface temperature (LST) and higher NDVI as shown in Figures . Additionally, the highest NDVI was found in the north and northwest parts of the study area, which is mostly covered with vegetation, and agricultural lands. The results of the NDVI analysis show a general decrease in vegetation during the 29-year period that is a consequence of the LULC changes from green to impervious surface.
Figure 5. Correlation between LST and NDVI for 1991.
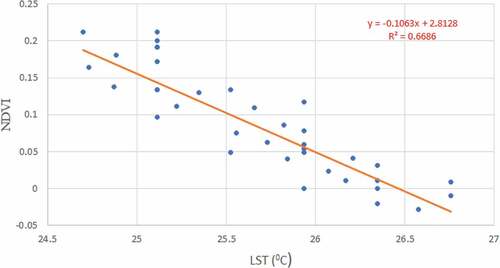
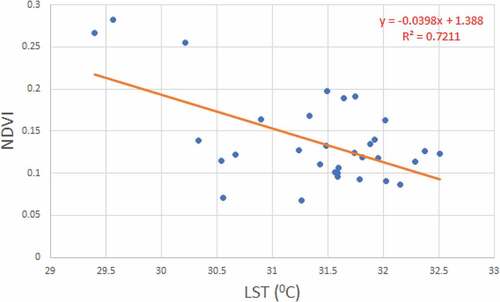
The correlation between LST and NDVI is shown in Figures . The results show that there is a negative correlation between LST and NDVI for all years with R2 = 0.668, 0.427, 0.800, and 0.721 in 1991, 2002, 2011, and 2020, respectively. However, due to the inverse correlation, it can be stated that decreasing vegetation cover results in an increased surface temperature (Alemu, Citation2019; Deng et al., Citation2018; Balew & Korme, Citation2020).
Figure 6. Correlation between LST and NDVI for 2002.
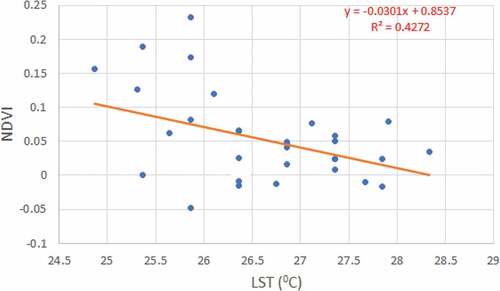
Figure 7. Correlation between LST and NDVI for 2011.
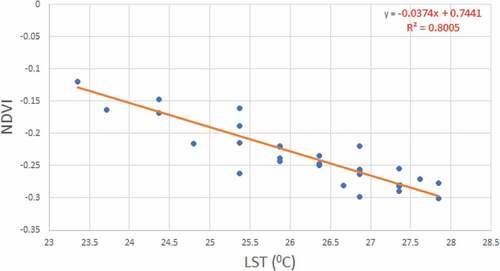
Figure 8. Correlation between LST and NDVI for 2020.
3.5. Relationship between NDBI and LST
The spatial variation of NDBI for each of the years (1991, 2002, 2011, and 2020) is shown in Figure , and a statistical summary is given in Table . One of the main indicators for understanding the urban climate is NDBI (Ranagalage et al., Citation2017; Rousta, Sarif, Gupta, Olafsson, Ranagalage, Murayama, Zhang, Mushore et al., Citation2018a; Grover et al., Citation2016. NDBI ranges between −1 and +1, where small positive values denote bare land, large positive values settlement areas, and negative values denote vegetation cover (Ranagalage, Estoque, Zhang, Murayama et al., Citation2018). Ranagalage et al. (Citation2018)(Citation2018) suggested that an NDBI larger than 0.22 represents settlement areas (Ranagalage, Estoque, Zhang, Murayama et al.,). From our results, mean NDBI decreased from −0.33 in 1991 to −0.28 in 2002, and increased to −0.15 and −0.18 in 2011 and 2020 respectively. The significant increase in NDBI is due to the increase in settlement areas taking over bare land and lower vegetation. Additionally, the correlation between LST and NDBI is shown in Figure . From the results, there is a positive correlation between LST and NDBI for all time steps, where R2 was 0.504, 0.442, 0.624, and 0.720 in 1991, 2002, 2011, and 2020, respectively. The year 2011 had the least correlation between LST and NDBI, and this could be due to considerably lower temperature in that year relative to the long-term average. From the results of the positive correlation, it can be assumed that the increase in settlement areas resulted in increased land surface temperature (Simwanda et al. 2019; Dissanayake et al., Citation2019; Ranagalage, Dissanayake et al., Citation2018; Rousta, Sarif, Gupta, Olafsson, Ranagalage, Murayama, Zhang, Mushore et al., Citation2018a; Wang et al., Citation2018).
Figure 9. Spatial maps of NDBI in 1991, 2002, 2011, and 2020.
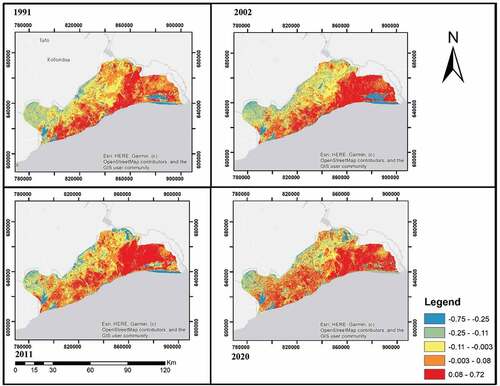
Figure 10. Correlation between LST and NDBI for 1991.
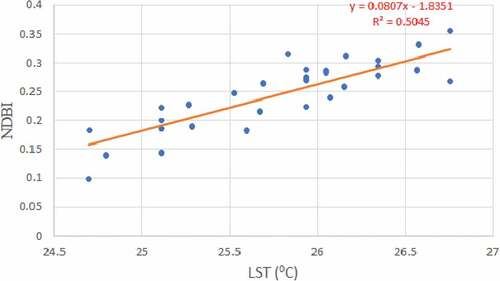
Figure 11. Correlation between LST and NDBI for 2002.
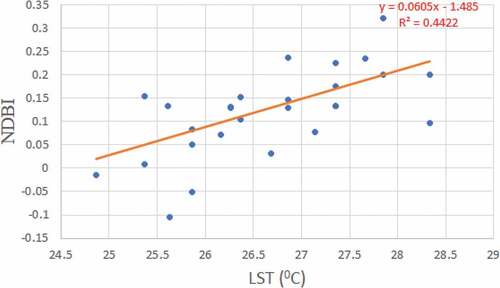
Figure 12. Correlation between LST and NDBI for 2011.
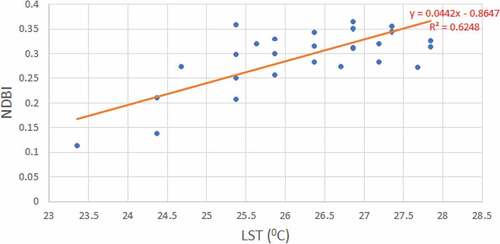
Figure 13. Correlation between LST and NDBI for 2020.
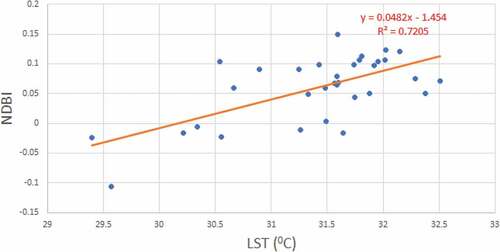
Table 9. Statistical Summary of spatial variation of NDBI for 1991, 2002, 2011, and 2020
4. Discussion
Many researches have assessed the impact of the change in urban land cover, NDVI and LST trends. Most of these researches pay much attention on short-term spatiotemporal patterns such as the annual temperature change, the urban heat island (UHI) phenomena, and do not use satellite image time series as in the case of this study (Liu et al., Citation2016; Wang et al., Citation2018). Additionally many researches focused on large megacities, little has been done to assess the effects of land cover change on the LST in urbanizing rural settlements in peri-urban areas, and emerging cities, particularly in coastal lands. These small to medium-sized cities are pertinent as they accommodate a larger proportion of the growing urban populations than megacities in the coming years (Akinyemi et al., Citation2017).
4.1. Expansion of the urban areas
The most noticeable LULC change in the Greater Accra region in this study is the expansion of human settlements, particularly built-up areas of Accra city into the surrounding peri-urban areas. Urban expansion occurred mainly in the western part of the region and the northwest with some patches moving towards the north. This situation can be mainly attributed to population increase due to an influx of people into capital city from all parts of Ghana in search of jobs. The results showing increasing impervious surface areas is due to expansion of settlement areas, this result is in line with results of (Matlhodi et al., Citation2019). The report of the findings indicating that vegetation areas decreased is in line with the findings of (Matlhodi et al., Citation2019), which found that tree-covered areas decreased between 1984 and 2015 in Gaborone. This similarity in results is mainly due to the fact that each of the study locations are growing cities experiencing much rural–urban migration from the peri-urban and rural areas. With a focus on urban LST, our study area comprised Greater Accra region and the immediate surrounding towns (Figure ), whereas the examined Gaborone dam catchment, an area south of the dam excluding the city.
The land cover changes revealed that urban areas expanded between 1991 and 2020. In 1991, the impervious surface (built-up areas) were mostly found around the business centers such as Accra central, North Industrial Areas, Kaneshie market, Tema Port and Industrial Areas and the Fishing Habour. However, in 2020, the built-up areas increased largely to residential areas such as Madina, kwashieman, Ashiaman, Achimota, Dowenya among others, with the vegetation cover decreasing massively. The vegetation areas were to bareland and impervious surface for developmental activities such as construction of roads and buildings. The increase in impervious surface in 2002 and 2011 were intense and concentrated in the south and eastern part of the region due to urban conurbation (polycentric). Unlike in 2020, the increase in impervious areas were more spread out in 2020 due to urban agglomeration. The changes observed in vegetation cover, impervious, and bareland cover between 2002 and 2020 showed a rapid increase in urbanization than the changes observed between 1991 and 2002. The LSTs were tremendously higher in impervious surface and bareland areas than areas of vegetation cover, salt_marshes and water-bodies. This is because areas covered by water bodies and vegetation produced cooling effect through evaporation, evapotranspiration and shading (Sodoudi et al., Citation2014). The absence of vegetation and an increase in impervious surfaces (built-up) reduced the latent heat fluxes and enhanced sensible heat, giving off warming effect noticeable in the LSTs. These effects change the surface energy budget, increase its intensity and affect the formation of UHI (Matlhodi et al., Citation2019). These findings are in line with that of Roth (2007), which reported that, high UHI intensity in the tropics is evident in the dry season and related to the characteristics of urban-rural surface moisture.
4.2. Increase urbanization and its impact on greater Accra region
The increase in urbanization increased informal settlements and environmental degradation in developing countries as reported by earlier studies (Athukorala et al., Citation2021; Rady et al., Citation2019). The results from this study showed that Greater Accra region experienced rapid urbanization in the 29-year period. The results from this study is similar to that reported by Mohamed and Worku (Citation2020) for Addis Ababa and its surrounding environment in Africa, which showed that built-up areas increased 3.7% in 2005, 5.7% in 2011, and 7% in 2015, whereas vegetation areas experienced a continuous decrease. Additionally, another study reported an increase in urban growth rate at 4.6% in 1993 to 26% in 2013 in Uttar Pradesh of the Indian metropolitan. Urban areas were also reported to grow by 590 km2 from 1995 to 2015, with a 4% annual growth rate, while agricultural areas declined to 397 km2 by 2015 in Foshan, China. The development policies for urban growth in Greater Accra region will enhance the use of bareland areas for urban sustainability.
The urbanization in Greater Accra region has transformed the vegetation areas to Impervious areas, including buildings, roads, and other human-made surface materials, increasing the surface UHI effect. Surface features such as buildings, roads, and other Impervious surface areas absorb more solar radiation than natural surface areas (R. C. Estoque & Murayama, Citation2017a). In view of the solar radiation during the day, the impervious surface areas absorb more solar energy, which is released during the night. This makes the surface UHI effect over city areas more noticeable than in the surrounding natural areas during the night. This is because, during the night, there is no solar energy. Still, the urban core area of Greater Cairo shows an urban heat island effect (Figures ), and the green spaces, which help to reduce urban heat at night-time, of city area is relatively small compared with the surrounding area (Figure ). The outcome of the study analysis revealed the significant influence of urbanization on the spatial intensity of the surface UHI effect.
4.3. Effect of impervious surface and vegetation on LST
The study assessed temperature changes of cities in Greater Accra region by examining the relationship of the spatial patterns, composition and configuration of impervious surfaces and vegetation with LST using Landsat images. The results show that 2020, with the highest percentage (34.4%) of impervious surfaces relative to the study area, and also the warmest year, that is, at least 1.3°C warmer than 2011 which is the second year with high temperature. These results could be attributed to 2020 experiencing much increase in impervious surface resulting from high migration from the rural areas into the capital city. These results contradict that of to the findings made by Estoque, (2017), where they observed areas of highest percentage of impervious surfaces to be the coolest in big Asian cities and attributed it to geographical location and background climate of the areas. On the other hand, 1991, with the highest and lowest percentage of vegetation and impervious surfaces, respectively, was the coolest, that is, at least 2.27°C and 1.4°C cooler than 2020. The ratio of green spaces to impervious surfaces was also highest in 1991 (11.02) and Lowest in 2020 (0.62), while 2002 and 2011 had ratios of 2.9 and 1.02, respectively. Despite this, it was observed that, although most towns have a relatively smaller green space to impervious surface ratio, resulting in high SUHI effect. This could be because impervious surfaces have a greater impact on surface temperature than green spaces (Ranagalage et al., Citation2017; Rousta, Sarif, Gupta, Olafsson, Ranagalage, Murayama, Zhang, Mushore et al., Citation2018b; Dissanayake et al., Citation2018). This means that, without the mitigating effect of green spaces that provide the cool island effect, surface temperatures are expected to increase. For example, 2020, with the lowest percentage of green spaces, recorded the highest overall mean LST of 36.8°C, while 2011, with the second highest percentage of impervious surfaces, had 35.5 ◦C. Accordingly, 1991 had the lowest overall mean LST of 28.5°C, while 2002 recorded 30.3°C. The variations in the overall mean LST in this study and the other studies cited above could also be attributed to geographical location and the respective local climates
4.4. Impact of sustainable land management in greater Accra region
This study assessed the effects of change in urban land cover on LST by analyzing significant trends LST. The study focused on Greater Accra region and its peri-urban areas as well. Coastal Greater Accra, as an emerging African city, is facing massive land cover changes caused by climate change and population increase. This city in a predominantly coast land in Africa and must implement a wide range of adaptation measures as the need to implement bioclimatic plans is higher in coast and tropical regions. For example, increasing night-time LST trends observed in the impervious surfaces implies more energy will be required for cooling at night. Improving on the UHI condition to better enhance the level of thermal comfort of city dwellers is very essential. In view of the higher LST found in areas of settlement expansion than the main city, effective designs are required to mitigate increasing temperature in developing areas. For example, the adoption of tree planting for shade and gardening around residential areas must be initiated. However, the effects of shade trees is dependent on the side of the building the trees are planted. Additionally, establishment of parks and gardens in urban areas can also play a role in minimizing heat stress among urban populace and gardening can also serve as means of supply to fresh produce for the inhabitants. The built-up areas at the urban showed lower LST increases compared to the peri-urban settlements, however, maximum settlement areas in urban places showed inverse patterns as higher LST increases were observed over the settlement areas than the rural agricultural settlements. Although LST trends increased over croplands, LST increases during the night were high compared to day time LST. This difference in LST may be resulting from the irrigation of croplands. However, further study is required to determine the effects of irrigating croplands on urban LST in the study area. The high correlation of LST when to NDVI, appeared more stable for all areas that were analyzed. The results indicate that for these types of urbanizing coastal landscapes, climatic variables might explain a proportion of the variability of the LST alongside land cover changes. However, the loss of vegetation cover will work synergistically with increases in temperature due to climate change, though it causes increases bareland and expansion of impervious surfaces (often with higher capacity to accumulate heat from the sun’s radiation),
5. Conclusion
In this study, data from 1991 to 2020 were captured using Google Erath Engine platform. It was observed that the activities in space have increased tremendously due to high population density which is attributable to people seeking for employment. The pressure in space does not always contribute to congestion of human beings in space and stress on social facilities as literature seemed to portray. There is an emergence of effects of high surface temperature due to the increasing number of people that contributes to health challenges that the urban people face. Migration to cities has been in existence over centuries and the number has been increasing every now and then. Some efforts have been initiated and through policies and programmes but its implementations have been in serious challenge. And if pragmatic efforts are not exercised, it would degenerate into global crises which would hamper the achievement of the Sustainable Development Goals and Agenda 2063 which the world is expected to achieve.
Highlights
Many researchers assess impacts of Urban Land Cover, Normalised Differential Vegetation Index and Land Surface Temperature (LST) with utmost attention in short- term spatiotemporal patterns.
This study assessed temperature changes of cities in Greater Accra region by examining the relationship of the spatial patterns, composition and configuration of impervious surfaces and vegetation with LST using Landsat images
The major expansion observed in Accra is mostly due to human settlement which is highly caused by migration.
The increase in urbanisation has contributed to informal settlement and its associated environmental challenges.
Authors’ Contributions
Samuel Kwofie, Clement Nyamekye and Emmanuel Agyapong conceptualised the manuscript. Samuel Kwofie, Clement Nyamekye and Lindah Appiah Boamah, performed the analysis. Frank Owusu and Richard Arthur contributed to the content related and regional expertise. All the authors contributed to the results related discussion and manuscript writing.
Disclosure statement
No potential conflict of interest was reported by the author(s).
Data Availability Statement
All the data for this study is readily available but would be made accessible upon request.
Additional information
Funding
References
- Abdramane, D., Ye, X., & Amadou, T. (2018). Analysis of land surface temperature change based on MODIS data, case study: Inner Delta of Niger. Nat Hazards Earth Syst Sci Discuss. https://doi.org/10.5194/nhess-2018-208
- Akinbobola, A. (2019). Simulating land cover changes and their impacts on land surface temperature in Onitsha, South East Nigeria. Atmospheric and Climate Sciences, 9(2), 243–25. https://doi.org/10.4236/acs.2019.92017
- Akinyemi, F. O., Pontius, J. R. G., & Braimoh, A. K. (2017). Land change dynamics: Insights from Intensity Analysis applied to an African emerging city. Journal of Spatial Science, 62(1), 69–83. https://doi.org/10.1080/14498596.2016.1196624
- Alemu, M. M. (2019). Analysis of spatio-temporal land surface temperature and normalized difference vegetation index changes in the Andassa Watershed, Blue Nile Basin, Ethiopia. Journal of Resources and Ecology, 10(1), 77–85. https://doi.org/10.5814/j.1674-764x.2019.01.010
- Athukorala, D., Estoque, R. C., Murayama, Y., & Matsushita, B. (2021). Impacts of urbanization on the Muthurajawela marsh and Negombo lagoon, Sri Lanka: Implications for landscape planning towards a sustainable urban wetland ecosystem. Remote Sens, 13(2), 316. CrossRef. https://doi.org/10.3390/rs13020316.
- Athukorala, D., & Murayama, Y. (2021). Urban heat Island formation in greater cairo: Spatio-temporal analysis of daytime and night-time land surface temperatures along the urban-rural gradient. Remote Sensing, 21(13), 1396. https://doi.org/10.3390/rs13071396
- Balew, A., & Korme, T. (2020). Monitoring land surface temperature in Bahir Dar city and its surrounding using Landsat images. The Egyptian Journal of Remote Sensing and Space Science, 23(3), 371–386. https://doi.org/10.1016/j.ejrs.2020.02.001
- Buyantuyev, A., & Wu, J. (2010). Urban heat islands and landscape heterogeneity: Linking spatiotemporal variations in surface temperatures to land-cover and socioeconomic patterns. Landsc. Ecol, 25(1), 17–33. CrossRef. https://doi.org/10.1007/s10980-009-9402-4.
- Cao, H., Chao, S., Qiao, L., Jiang, Y., Zeng, X., & Fan, X. (2017). Urbanization-related changes in soil PAHs and potential health risks of emission sources in a township in Southern Jiangsu, China.Science of the Total Environment, 575, 692–700. CrossRef. https://doi.org/10.1016/j.scitotenv.2016.09.106
- Chander, G., Markham, B. L., & Helder, D. L. (2009). Summary of current radiometric calibration coefficients for Landsat MSS, TM, ETM+, and EO-1 ALI sensors. Remote Sensing of Environment, 113(5), 893–903. CrossRef. https://doi.org/10.1016/j.rse.2009.01.007.
- Chen, L. C., Papandreou, G., Kokkinos, I., Murphy, K., & Yuille, A. L. (2014). Semantic image segmentation with deep convolutional nets and fully connected crfs. https://doi.org/10.48550/arXiv.1412.7062.
- Chun, B., & Guldmann, J. M. (2014). Spatial statistical analysis and simulation of the urban heat island in high-density central cities. Landscape and Urban Planning, 125, 76–88. https://doi.org/10.1016/j.landurbplan.2014.01.016
- Correia Filho, W. L. F., De barros santiago, D., de Oliveira-Júnior, J. F., & da Silva Junior, C. A. (2019). Impact of urban decadal advance on land use and land cover and surface temperature in the city of Maceió, Brazil. Land Use Policy, 87, 104026. https://doi.org/10.1016/j.landusepol.2019.104026
- Cudjoe, D., Nketiah, E., Obuobi, B., Adu-Gyamfi, G., Adjei, M., & Zhu, B. (2021). Forecasting the potential and economic feasibility of power generation using biogas from food waste in Ghana: Evidence from accra and kumasi. Energy, 226, 120342. https://doi.org/10.1016/j.energy.2021.120342
- Deng, L., Mao, Z., Li, X., Hu, Z., Duan, F., & Yan, Y. (2018). UAV-based multispectral remote sensing for precision agriculture: A comparison between different cameras. ISPRS Journal of Photogrammetry and Remote Sensing, 146, 124–136. https://doi.org/10.1016/j.isprsjprs.2018.09.008
- Dissanayake, D., Morimoto, T., Murayama, Y., & Ranagalage, M. (2019). Impact of landscape structure on the variation of land surface temperature in sub-saharan region: A case study of Addis Ababa using Landsat Data. Sustainability, CrossRef 11, 2257.
- Dissanayake, D., Morimoto, T., Murayama, Y., Ranagalage, M., & Handayani, H. H. (2018). Impact of urban surface characteristics and socio-economic variables on the spatial variation of land surface temperature in Lagos City, Nigeria. Sustainability, 11(1), 25. CrossRef. https://doi.org/10.3390/su11010025.
- EPA (US Environmental Protection Agency). Reducing Urban Heat Islands: Compendium of Strategies. (2008). US Environmental Protection Agency.
- Erkan, U., & Gökrem, L. (2018). A new method based on pixel density in salt and pepper noise removal.Turkish JOURNAL OF ELECTRICAL ENGINEERING & COMPUTER SCIENCES, 26, 162–171. CrossRef. https://doi.org/10.3906/elk-1705-256
- Estoque, R. C., & Murayama, Y. (2016). Quantifying landscape pattern and ecosystem service value changes in four rapidly urbanizing hill stations of Southeast Asia. Landscape Ecology, 31(7), 1481–1507. https://doi.org/10.1007/s10980-016-0341-6
- Estoque, R. C., & Murayama, Y. (2017a). Monitoring surface urban heat island formation in a tropical mountain city using Landsat data (1987–2015). ISPRS Journal of Photogrammetry and Remote Sensing, 133, 18–29. https://doi.org/10.1016/j.isprsjprs.2017.09.008
- Estoque, R. C., Murayama, Y., & Myint, S. W. (2017b). Effects of landscape composition and pattern on land surface temperature: An urban heat island study in the megacities of Southeast Asia. Science of the Total Environment, 577, 349–359. https://doi.org/10.1016/j.scitotenv.2016.10.195
- Franco, S., Mandla, V. R., & Ram Mohan Rao, K. (2017). Urbanization, energy consumption and emissions in the Indian context A review.Renewable and Sustainable Energy Reviews, 71, 898–907. CrossRef. https://doi.org/10.1016/j.rser.2016.12.117
- Frazer, L. (2005). Paving paradise: The peril of impervious surfaces. (Frazer, Lance. “Paving paradise: The peril of impervious surfaces.” (2005). Environmental Health Perspectives, 113(7), A456–A462. https://doi.org/10.1289/ehp.113-a456
- Gallo, K. P., Easterling, D. R., & Peterson, T. C. (1996). The influence of land use/land cover on climatological values of the diurnal temperature range. Journal of Climate, 9(11), 2941–2944. https://doi.org/10.1175/1520-0442(1996)009<2941:TIOLUC>2.0.CO;2
- Grimm, N. B., Faeth, S. H., Golubiewski, N. E., Redman, C. L., Wu, J., Bai, X., & Briggs, J. M. (2008). Global change and the ecology of cities. Science, 319(5864), 756–760. CrossRef. https://doi.org/10.1126/science.1150195.
- Grover, N., Singh, B. N., & Maiti, D. K. (2016). An inverse trigonometric shear deformation theory for supersonic flutter characteristics of multilayered composite plates. Aerospace Science and Technology, 52, 41–51. https://doi.org/10.1016/j.ast.2016.02.017
- Guneralp, B., Shuaib, L., Hillary, M., Parnell, S., & Seto, K. C. (2018). Urbanization in Africa: Challenges and opportunities for conservation. Environmental research letters, 13(1), 015002.
- Hale, R. C., Gallo, K. P., Owen, T. W., & Loveland, T. R. (2006). Land use/land cover change effects on temperature trends at U.S. Climate Normals stations. Geophysical Research Letters, 33(11). https://doi.org/10.1029/2006GL026358
- IPCC. (2014). Climate change 2014: Synthesis report; contribution of working groups I, II and III to the fifth assessment report of the intergovernmental panel on climate change; core writing team (R. K. Pachauri & L. A. Meyer, Eds.).
- Kamusoko, C., & Aniya, M. (2009). Hybrid classification of Landsat data and GIS for land use/cover change analysis of the Bindura district, Zimbabwe. International Journal of Remote Sensing, 30(1), 97–115. CrossRef. https://doi.org/10.1080/01431160802244268.
- Kanhai, G., Fobil, J. N., Nartey, B. A., Spadaro, J. V., & Mudu, P. (2021). Urban municipal solid waste management: Modeling air pollution scenarios and health impacts in the case of Accra, Ghana. Waste Management, 123, 15–22. https://doi.org/10.1016/j.wasman.2021.01.005
- Kikon, N., Singh, P., Singh, S. K., & Vyas, A. (2016). Assessment of urban heat islands (UHI) of Noida City, India using multi-temporal satellite data. Sustainable Cities and Society, 22, 19–28. https://doi.org/10.1016/j.scs.2016.01.005
- Kondo, K., Mabon, L., Bi, Y., Chen, Y., & Hayabuchi, Y. (2021). Balancing conflicting mitigation and adaptation behaviours of urban residents under climate change and the urban heat island effect.Sustainable Cities and Society, 65, 102585. CrossRef] [PubMed. https://doi.org/10.1016/j.scs.2020.102585
- Kong, F., Yin, H., James, P., Hutyra, L. R., & He, H. S. (2014). Effects of spatial pattern of greenspace on urban cooling in a large metropolitan area of eastern China. Landscape and Urban Planning, 128 35–47. CrossRef. https://doi.org/10.1016/j.landurbplan.2014.04.018
- Kushwaha, K., Singh, M. M., Singh, S. K., & Patel, A. (2021). Urban growth modeling using earth observation datasets, cellular automata-Markov chain model and urban metrics to measure urban footprints. Remote Sensing Applications: Society and Environment, 22, 100479. https://doi.org/10.1016/j.rsase.2021.100479
- Lin, T. Y., Goyal, P., Girshick, R., He, K., & Dollár, P. (2017). Focal loss for dense object detection. In Proceedings of the IEEE international conference on computer vision (pp. 2980–2988).
- Li, J., Song, C., Cao, L., Zhu, F., Meng, X., & Wu, J. 2011. Impacts of landscape structure on surface urban heat islands: A case study of Shanghai, China. Remote Sens. Environ, 115(12), 3249–3263.
- Liu, K., Su, H., Li, X., Wang, W., Yang, L., & Liang, H. (2016). Quantifying spatial–temporal pattern of urban heat island in Beijing: An improved assessment using land surface temperature (LST) time series observations from Landsat, MODIS, and Chinese new satellite GaoFen-1. IEEE Journal of Selected Topics in Applied Earth Observations and Remote Sensing, 9(5), 2028–2042. https://doi.org/10.1109/JSTARS.2015.2513598
- Maimaitiyiming, M., Ghulam, A., Tiyip, T., Pla, F., Latorre-Carmona, P., Halik, Ü., Sawut, M., & Caetano, M. (2014a). Effects of green space spatial pattern on land surface temperature: Implications for sustainable urban planning and climate change adaptation. ISPRS Journal of Photogrammetry and Remote Sensing, 89 59–66. CrossRef. https://doi.org/10.1016/j.isprsjprs.2013.12.010
- Manzanas, R., Amekudzi, L., Preko, K., Herrera, S., & Gutierrez, J. M. (2014). Precipitation variability and trends in Ghana: An intercomparison of ´ observational and reanalysis products. Climatic Change, 124(4), 805–819. https://doi.org/10.1007/s10584-014-1100-9
- Marcotullio, P. J., Keßler, C., & Fekete, B. M. (2021). The future urban heatwave challenge in Africa: Exploratory analysis. Glob. Environ. Chang, 66, 102190.
- Matlhodi, B., Kenabatho, P. K., Parida, B. P., & Maphanyane, J. G. (2019). Evaluating land use and land cover change in the gaborone dam catchment, botswana, from 1984–2015 using GIS and remote sensing. Sustainability, 11(19), 5174. https://doi.org/10.3390/su11195174
- Memon, R. A., Leung, D. Y. C., & Liu, C.-H. (2009). An investigation of urban heat island intensity (UHII) as an indicator of urban heating. Atmospheric Research, 94(3), 491–500. CrossRef. https://doi.org/10.1016/j.atmosres.2009.07.006.
- Michishita, R., Jiang, Z., & Xu, B. 2012. Monitoring two decades of urbanization in the Poyang Lake area, China through spectral unmixing. Remote Sens. Environ, 117, 3–18. https://doi.org/10.1016/j.rse.2011.06.021
- Mohamed, A., & Worku, H. (2020). Simulating urban land use and cover dynamics using cellular automata and markov chain approach in addis ababa and the surrounding. Urban Climate, 31, 100545. https://doi.org/10.1016/j.uclim.2019.100545
- Monteiro, F. F., Gonçalves, W. A., Andrade, L. D. M. B., Villavicencio, L. M. M., & Dos Santos Silva, C. M. (2021). Assessment of urban heat islands in brazil based on MODIS remote sensing data. Urban Clim, 35, 100726.
- Muro, J., Strauch, A., Heinemann, S., Steinbach, S., Thonfeld, F., Waske, B., & Diekkrüger, B. (2018). Land surface temperature trends as indicator of land use changes in wetlands. International Journal of Applied Earth Observation and Geoinformation, 70, 62–71. https://doi.org/10.1016/j.jag.2018.02.002
- Nakayama, T., & Fujita, T. (2010). Cooling effect of water-holding pavements made of new materials on water and heat budgets in urban areas. Landscape and Urban Planning, 96(2), 57–67. https://doi.org/10.1016/j.landurbplan.2010.02.003
- Ogashawara, I., & Brum, S. (2012). A Quantitative approach for analyzing the relationship between urban heat islands and land cover. Remote Sensing, 4(11), 3596–3618. CrossRef. https://doi.org/10.3390/rs4113596.
- Owusu, K., & Waylen, P. R. (2013). The changing rainy season climatology of mid-Ghana. Theoretical and Applied Climatology, 112(3), 419–430. https://doi.org/10.1007/s00704-012-0736-5
- Parnell, S., & Oldfield, S. (Eds.). (2014). The Routledge handbook on cities of the global south. Routledge.
- Priyankara, P., Ranagalage, M., Dissanayake, D. M. S. L. B., Morimoto, T., & Murayama, Y. (2019). Spatial process of surface urban heat island in rapidly growing Seoul metropolitan area for sustainable urban planning using Landsat data (1996–2017). Climate, 7(9), 110. https://doi.org/10.3390/cli7090110
- Rady, O., El-kawy, A., Ahmed, H., & Mohamed, H. 2019. The Egyptian journal of remote sensing and space sciences temporal detection and prediction of agricultural land consumption by urbanization using remote sensing. Egypt. J. Remote Sens. Sp. Sci, 22, CrossRef, 237–246.
- Ranagalage, M., Dissanayake, D., Murayama, Y., Zhang, X., Estoque, R. C., Perera, E., & Morimoto, T. (2018). Quantifying surface urban heat island formation in the world heritage tropical mountain city of Sri Lanka. Isprs International Journal of Geo-Information, 7(9), 341. CrossRef. https://doi.org/10.3390/ijgi7090341.
- Ranagalage, M., Estoque, R. C., Handayani, H. H., Zhang, X., Morimoto, T., Tadono, T., & Murayama, Y. (2018). Relation between urban volume and land surface temperature: A comparative study of planned and traditional cities in Japan. Sustainability, 10(7), 2366. CrossRef. https://doi.org/10.3390/su10072366.
- Ranagalage, M., Estoque, R. C., & Murayama, Y. (2017). An urban heat island study of the Colombo metropolitan Area, Sri Lanka, based on Landsat Data (1997–2017). ISPRS International Journal of Geo-Information, 6(7),189. CrossRef. https://doi.org/10.3390/ijgi6070189
- Ranagalage, M., Estoque, R. C., Zhang, X., & Murayama, Y. (2018). Spatial changes of urban heat island formation in the Colombo District, Sri Lanka: Implications for sustainability planning. Sustainability, 10(5), 1367. https://doi.org/10.3390/su10051367
- Ranagalage, M., Estoque, R., Zhang, X., & Murayama, Y. (2018). Spatial changes of urban heat island formation in the Colombo District, Sri Lanka: Implications for sustainability planning. Sustainability, 10(5),1367. CrossRef. https://doi.org/10.3390/su10051367
- Reba, M., & Seto, K. C. (2020). A systematic review and assessment of algorithms to detect, characterize, and monitor urban land change.Remote Sensing of Environment, 242, 111739. CrossRef. https://doi.org/10.1016/j.rse.2020.111739
- Richard, Y., Pohl, B., Rega, M., Pergaud, J., Thevenin, T., Emery, J., Dudek, J., Vairet, T., Zito, S., & Chateau-Smith, C. (2021). Is urban heat island intensity higher during hot spells and heat waves (Dijon, France, 2014–2019)?Urban Climate, 35, 100747. CrossRef. https://doi.org/10.1016/j.uclim.2020.100747
- Rousta, I., Sarif, O., Gupta, R. D., Olafsson, H., Ranagalage, M., Murayama, Y., Zhang, H., & Mushore, T. D. (2018a). Spatiotemporal analysis of land use/land cover and its effects on surface urban heat island using landsat data: A case study of metropolitan City Tehran (1988–2018). Sustainability, 10(12),4433. CrossRef. https://doi.org/10.3390/su10124433
- Rousta, I., Sarif, O., Gupta, R. D., Olafsson, H., Ranagalage, M., Murayama, Y., Zhang, H., & Mushore, T. D. (2018b). Spatiotemporal analysis of land use/land cover and its effects on surface urban heat island using landsat data: A case study of metropolitan City Tehran. Sustainability, 10(12),4433. CrossRef. https://doi.org/10.3390/su10124433
- Roxburgh, C., Dörr, N., Leke, A., Tazi-Riffi, A., Van Wamelen, A., Lund, S., & Zeino-Mahmalat, T. (2010). Lions on the move: The progress and potential of African Economies. McKinsey Global Institute.
- Sheng, L., Tang, X., You, H., Gu, Q., & Hu, H. (2017). Comparison of the urban heat island intensity quantified by using air temperature and Landsat land surface temperature in Hangzhou.China. Ecological Indicators, 72, 738–746. CrossRef. https://doi.org/10.1016/j.ecolind.2016.09.009
- Simwanda, M., Murayama, Y., & Ranagalage, M. (2020). Modeling the drivers of urban land use changes in Lusaka, Zambia using multi-criteria evaluation: An analytic network process approach. Land Use Policy, 92, 104441. https://doi.org/10.1016/j.landusepol.2019.104441
- Sobrino, J. A., Jiménez-Muñoz, J. C., & Paolini, L. (2004). Land surface temperature retrieval from LANDSAT TM 5. Remote Sensing of Environment, 90(4), 434–440. https://doi.org/10.1016/j.rse.2004.02.003
- Sodoudi, S., Shahmohamadi, P., Vollack, K., Cubasch, U., & Che-Ani, A. (2014). Mitigating the urban heat island effect in megacity Tehran. Advances in Meteorology, 2014, 1–19. https://doi.org/10.1155/2014/547974
- Szabó, S., Elemér, E., Kovács, K., Püspöki, P., Kertész, K., Singh, S. K., & Balázs, B. (2019). NDVI dynamics as reflected in climatic variables: Spatial and temporal trends – A case study of Hungary. GIScience & Remote Sensing, 56(4), 624–644. https://doi.org/10.1080/15481603.2018.1560686
- Tarawally, M., Xu, W., Hou, W., & Mushore, T. (2018). Comparative analysis of responses of land surface temperature to long-term land use/cover changes between a coastal and Inland City: A case of Freetown and Bo Town in Sierra Leone. Remote Sensing, 10(1), 112. https://doi.org/10.3390/rs10010112
- Thapa, R. B., & Murayama, Y. (2007). Image classification techniques in mapping urban landscape: A case study of Tsukuba city using AVNIR-2 sensor data. Tsukuba Geoenviron. Sci, 3, 3–10. https://doi.org/10.12691/aees-9-3-1
- UN-DESA. World urbanization prospects: The 2018 revision, highlights; United Nations publication; United Nations, department of economic and socialAffairs (UN/DESA), PopulationDivision: 2018. Available online: https://www.un.org/development/desa/publications/2018-revision-of-world-urbanization-prospects.html/ (accessed on 23 June 2019)
- USGS (United States Geological Survey). (2016). Product Guide: Provisional Landsat 8 surface reflectance product; Department of the Interior, U.S. Geological Survey.
- Voogt, J. A. Urban Heat Islands: Hotter Cities. Available online: http://www.actionbioscience.org/environment/voogt.html (accessed on 29 April 2018)
- Wang, S., Ma, Q., Ding, H., & Liang, H. (2018). Detection of urban expansion and land surface temperature change using multi-temporal Landsat images. Resources, Conservation and Recycling, 128, 526–534. https://doi.org/10.1016/j.resconrec.2016.05.011
- Weng, Q. (2009). Thermal infrared remote sensing for urban climate and environmental studies: Methods, applications, and trends. ISPRS Journal of Photogrammetry and Remote Sensing, 64(4), 335–344. CrossRef. https://doi.org/10.1016/j.isprsjprs.2009.03.007.
- Weng, Q., Lu, D., & Schubring, J. (2004). Estimation of land surface temperature-vegetation abundance relationship for urban heat island studies. Remote Sensing of Environment, 89(4),467–483. CrossRef. https://doi.org/10.1016/j.rse.2003.11.005
- While, A., & Whitehead, M. (2013). Cities, urbanisation and climate change. Urban Studies, 50(7), 1325–1331. https://doi.org/10.1177/0042098013480963
- Wondrade, N., Dick, Ø. B., & Tveite, H. (2014). GIS based mapping of land cover changes utilizing multi-temporal remotely sensed image data in lake hawassa watershed, Ethiopia. Environmental Monitoring and Assessment, 186(3), 1765–1780. https://doi.org/10.1007/s10661-013-3491-x
- Wu, T., Li, W., Ji, J., Xin, X., Li, L., Wang, Z., Zhang, Y., Li, J., Zhang, F., Wei, M., Shi, X., Wu, F., Zhang, L., Chu, M., Jie, W., Liu, Y., Wang, F., Liu, X., Li, Q., … Zhang, J. (2013). Global carbon budgets simulated by the Beijing climate center climate system model for the last century. Journal of Geophysical Research: Atmospheres, 118(10), 4326–4347. https://doi.org/10.1002/jgrd.50320
- Xiao, R., Ouyang, Z., Zheng, H., Li, W., Schienke, E. W., & Wang, X. (2007). Spatial pattern of impervious surfaces and their impacts on land surface temperature in Beijing, China. Journal of Environmental Sciences, 19(2), 250–256. CrossRef. https://doi.org/10.1016/S1001-0742(07)60041–2.
- Xu, H. (2006). Modification of normalised difference water index (NDWI) to enhance open water features in remotely sensed imagery. International Journal of Remote Sensing, 27(14), 3025–3033. https://doi.org/10.1080/01431160600589179
- Yue, Y., Finley, T., Radlinski, F., & Joachims, T. (2007, July). A support vector method for optimizing average precision. In Proceedings of the 30th annual international ACM SIGIR conference on research and development in information retrieval (pp. 271–278).
- Zhang, X., Estoque, R. C., & Murayama, Y. (2017). An urban heat island study in Nanchang City, China based on land surface temperature and social-ecological variables. Sustainable Cities and Society, 32 557–568. CrossRef. https://doi.org/10.1016/j.scs.2017.05.005
- Zhang, D., Xu, J., Zhang, Y., Wang, J., He, S., & Zhou, X. (2020). Study on sustainable urbanization literature based on web of science, scopus, and China national knowledge infrastructure: A scientometric analysis in citespace. Journal of Cleaner Production, 264, 121537. https://doi.org/10.1016/j.jclepro.2020.121537
- Zhou, W., Huang, G., & Cadenasso, M. L. (2011). Does spatial configuration matter? Understanding the effects of land cover pattern on land surface temperature in urban landscapes. Landscape and Urban Planning, 102(1), 54–63. CrossRef. https://doi.org/10.1016/j.landurbplan.2011.03.009.