
 ?Mathematical formulae have been encoded as MathML and are displayed in this HTML version using MathJax in order to improve their display. Uncheck the box to turn MathJax off. This feature requires Javascript. Click on a formula to zoom.
Abstract
The oil industry in Thailand primarily relies on truck transportation due to the versatility of trucks. Different truck sizes can easily access many customer locations better than any other transportation mode. However, although trucks have many advantages, the transportation cost per unit is very expensive compared to railway, air, waterway, and pipe transportation modes. Previous data indicated that shipping costs were approximately 703.995 USD/month/fleet and the transportation utilization was 83.145%. Therefore, efficiencies should be identified to improve business operations. This paper proposes an oil transportation plan with transshipment points by adopting Network Flow Models (NFM) to develop a Generalized Network Flow Model (GNFM). The developed GNFM was applied to solve three different problems and compared to the existing method. The objectives of the proposed model were to minimize total cost and maximize truck efficiency. Multi-Criteria Decision Analysis (MCDA) was considered to set the optimal decision criteria for managing the oil transportation network with the transshipment sites. The proposed model with the Cluster Model (CT) provided optimal results, with a total cost of 663.539 USD/month/fleet and a truck efficiency of 88.029%.
PUBLIC INTEREST STATEMENT
This study investigated the potential decision support that affected the successful delivery of oil in the Thailand oil industry. The objective was to determine the total shipping cost and truck utilization. To achieve this objective, a mathematical model was developed and employed to analyze the perspective of various delivery patterns in comparison basis. The findings reveal that the goals of study can be handled using the Proposed Multi-Criteria Decision Analysis.
1. Introduction
The oil industry is one of the largest industries in Thailand. Cutting-edge and complicated technologies have been adopted in many activities from oil exploration to the final distribution of oil to the end customers with the goal of improving profits and reducing expenses. Oil businesses maintain a large logistics network and supply chain. The oil supply chain consists of upstream, midstream, and downstream activities (Kazemi & Szmerekovsky, Citation2015). Each chain has activities such as production, management, and so forth. Upstream activity involves the exploration of oil drilling, crude oil handling, and drilling rig management (Solheim & Tveterås, Citation2017). Midstream activities include oil distillation and transportation to the oil tank farm (Azadeh et al., Citation2017). Downstream activity mainly consists of transportation to customers. If only the downstream is considered, oil transportation is the most competitive activity because the oil demand in Thailand in 2020 was 127.3 million liters per day (Energy Policy and Planning Office (EPPO). Annual Report. Parasitol Int, Citation2020).
Many transportation modes, such as road, railway, pipe, waterway, or multi-echelon modes, can be used to dispatch oil from a refinery to end users (Ghaithan et al., Citation2017). The use of trucks is still widespread even though other transportation modes can provide a lower cost (Office of the National Economic and Social Development Council, Citation2019). This is because road infrastructure is more developed and trucks can better access different customers compared with other modes. Furthermore, trucks can be coupled with other transportation modes to cover almost all areas and better serve customers. Trucks are very flexible and agile across short transportation distances. However, although this transportation mode has numerous benefits, the carrying cost per unit is very high compared to other transportation modes (Verma et al., Citation2017). Specifically, longer shipping distances result in significantly higher prices (Tanco et al., Citation2019). Therefore, an efficient transportation plan will help the oil industry become more competitive. For these reasons, oil network transportation management is an attractive topic for proprietors, researchers, and practitioners who are interested in improving the oil industry to capably enhance customer satisfaction.
In recent years, many researchers have studied Network Flow Models (NFM) through several aspects such as management by strategy and policy (Aloui et al., Citation2021). The adoption of a Decision Support System (DSS) has simplified management (Gromov et al., Citation2019; Tirkolaee & Aydin, Citation2022). The simulation of (Chaiyarot & Pitiruek, Citation2021) routing and truck management (Carrese et al., Citation2019) has been implemented with the main goal of minimizing total cost (Hübner & Ostermeier, Citation2019) or maximizing return (Fernandes et al., Citation2013). Furthermore, some studies have considered environmental aspects and business sustainability (Aloui et al., Citation2021). This research aims to find a solution for oil network management. Popular existing tools include VRP (Fernández et al., Citation2017; Hwang et al., Citation2017; Martins et al., Citation2019) based on Mixed Integer Programming, which can be effectively solved by commercial optimization software packages such as LINGO (Li & Jiang, Citation2016). However, if large-scale or complicated problems classified as NP-Hard are encountered, this tool is not sufficient (Fazayeli et al., Citation2018) because the computational time is excessively long, up to days. Some algorithms such as Exact and heuristics have been used in order to reduce computational time. Heuristic methods such as Adaptive Large Neighborhood Search (ALNS; L Wang et al., Citation2020), Large Neighborhood Search (LNS; Hübner & Ostermeier, Citation2019), or the Genetic Algorithm (GA; Ji et al., Citation2015) and Network Flow Model (NFM) can be used to solve these problems. For instance, personal assignment and project management have been applied to solve NFM. Examples of NFM include the study of multi-size containers (Ji et al., Citation2015) in a hub-and-spoke network in China to reduce costs, (Kavirathna et al., Citation2018) the development of an impact factorial framework for selecting the port hub of a marine route to Bengal Bay to evaluate competitive competency, and (Donmuen & Pitiruek, Citation2019) the determination of an optimal solution for multi-type oil shipping. In addition, the application of NFM has been used to solve Multi-Criteria Decision Analysis (MCDA). For example, (Boskabadi et al., Citation2022) proposed a multi-objective mixed-integer non-linear mathematical model. An example of MCDA is as follows: minimizing total network cost, maximizing net profit per capita for each human resource, and diminishing CO2 emissions throughout the network (Bevrani et al., Citation2020). Furthermore, a novel Multi-Criteria Multi-Commodity Network Flow (MCMCNF) model has been proposed to help transport planners and other analysts holistically assess different types of transportation systems (TS). MCMCNF models investigate two objectives: maximizing the flow of commodities and minimizing travel-related costs This paper did not use multi-objective MCDA to manage the oil shipping network with NFM. In this research, the application of NFM to 3 models was proposed to reduce the total cost of an oil business and improve truck utilization compared to the existing management method of an oil company based in northeastern Thailand.
2. Materials and methods
First, the available traditional model, shipping costs, customer locations, distances, and customer demand were studied. Then, the Generalized Network Flow Model (GNFM) was developed and modified from other mathematical models with conditions such as Cluster (CT), No-Backward (NB), and Free Zone (FZ). The results of the proposed three models as well as those of the existing method were compared in terms of the total cost and truck efficiency. The best of the criteria was then selected. However, these methods resulted in contrasting factors regarding the total cost and the truck efficiency. Therefore, MCDA was used to set the criteria for optimally managing the oil transportation network with transshipment sites. The case study was an oil shipping company in the northeastern region of Thailand. The research framework is displayed in Figure , which describes the details of Sections 2.2 to 2.7.
Figure 1. The study framework.
2.1. The case study (traditional model)
The oil transportation planning of the case study company’s shipping network to customers or gas stations was investigated. Initially, trailer trucks were parked at a depot. After receiving orders, company workers filled the trucks (capacity: 40,000 liters) with oil. Next, the trucks were moved to the company oil tanks to unload the oil and wait to distribute to 25 customer locations. is the amount of oil shipped by truck
. The company would ship oil to the nearest customers first, then serve the remaining customers according to the distance criterion. After shipping was finished, each truck reported to the sales department to receive the next order, as shown in Figure . However, the problem with this strategy was that trucks from the depot could only ship oil to the distribution center (DC), and they could not directly transport the oil to the gas stations during their trips. This was because according to company policy, the DC was responsible for shipping the oil to the gas stations. This pattern was similar to the transshipment model. For this type, routes can be multiple and redundant, leading to the company incurring unnecessary costs.
Figure 2. Transportation network concept for a case study.
2.2. Network flow model (NFM)
In this research, we proposed an oil shipping plan using the application of NFM to determine the optimal solution for the transshipment of oil. Theoretically, the number of nodes must be greater than 2 points, and arcs were used to connect the nodes. Generally, the main objective was either finding the shortest path or minimizing the flow of costs. The model consisted of different nodes: origin nodes, destination nodes, and transshipment nodes. The lines connecting the nodes were denoted arcs or links. The inflow and outflow of each node must be balanced, which means that supply and demand must be equal, as expressed in Figure .
Figure 3. Inflows and outflows for node .
2.3. Data collection
2.3.1. Location
Data for the case study company were collected, including depot, DC, and customer or gas station data. The customers and gas stations were widely distributed throughout the main roads and districts, which resulted in the varying demand by the 25 customers. There were 27 nodes, including the depot and DC, as shown in Figure .
Figure 4. Node locations for the case study.
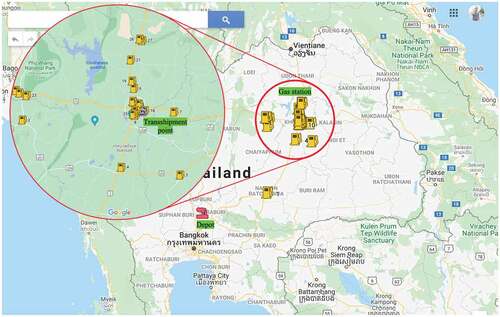
The possible links were established and the nodes were named node 1 to 27, as shown in Table . Node 1 was a depot, node 11 was the transshipment point, and the remaining nodes were the customers and gas stations. The locations were determined using Google Maps (https://maps.google.com). The latitude and longitude of these locations were plotted in Origin/Destination Matrix with 27 × 27 slots, as demonstrated in Table . All possible arcs of the case study were formed as shown in Figure as the GNFM grid and the data were also displayed in Table . The three proposed models were then applied.
Figure 5. The generalized network flow model for a case study.
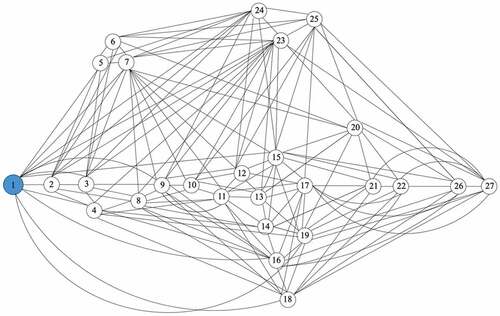
Table 1. Location code for each node
Table 2. Actual distance matrix between nodes
2.3.2. Customer demand
Customer demand data were collected for 1 month. The data were input into the models to determine the optimal solution. Mathematical models were developed to solve the problems of truck planning and oil transportation planning. These demands are expressed in Table .
Table 3. Customer demand data
2.3.3. Transportation cost
Trailer trucks with a capacity of 40,000 liters were used for oil transportation. The trucks were parked at the depot to wait for oil orders. Loaded trucks were used to ship the gas to the DC and the gas stations. The relevant costs were the cost of goods sold, operating cost, the fuel cost of the trucks, driver wages, and maintenance costs. These costs are displayed in Table .
Table 4. Transportation costs
2.4. The generalized network flow model (GNFM)
The mathematical GNFM model was developed with the objective of minimizing the total cost and meeting customer requirements. The model is as follows:
2.5. Parameters
Driver wages of truck k (USD/trip)
Fuel cost of truck k (USD/km)
Operating cost (USD/liter)
Maintenance cost of truck k (USD/km)
Demand of customer
(x100 liter)
Travel distance from customer
to customer
(km)
Capacity of truck
(x100 liter)
2.6. Decision variables
The amount of oil shipped from customer
to customer
through link (
,
) by truck
The binary variable of customer
to customer
is the selected truck k
2.7. Objective function
Subject to
The objective function described in Equation (1) aims to minimize the oil shipping cost via the network in order to satisfy customer needs. Equation (1) is comprised of the cost of goods sold, operating cost, trucks’ fuel cost, driver wages, bonus, and maintenance cost. Equation (2) is the balance equation demonstrating that the inflow and outflow of each node must equal Equations (3) and (4) show that all trucks must obtain oil at the depot. Equation (5) shows that the amount of oil shipped from customer
to customer
by truck
cannot exceed the truck capacity. Equation (6) shows the value of
, which depends on the nature of node i:
> 0 if node i is a depot node,
< 0 if node i is a customer demand, and
= 0 if node i is a transshipment point. Equation (7) is the integer constraint. Equation (8) is the binary constraint.
Based on the GNFM, 3 mathematical models were developed to plan the oil network transportation with transshipment points. The objective of all three models was to minimize the total relevant costs. The models are described in Sections 2.4.1 to 2.4.3.
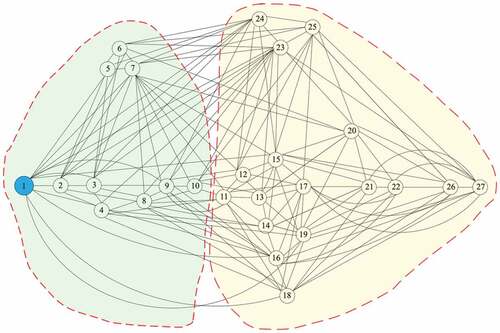
2.7.1. Cluster model (CT)
In this model, the customers were divided into 2 clusters. The first cluster consisted of the customers located before the DC and the second cluster included the DC and the customers located after the DC. Oil transportation began from the depot. The possible routes were connected to each cluster. All trucks were able to travel back and forth within their specified cluster and the equation for this logic is displayed in Equation 2. The designated routes are shown in Figure .
Figure 6. The conceptual network flow for the Cluster Model.
2.7.2. Free zone model (FZ)
For this model, all nodes were arbitrarily linked and all trucks could also travel freely. In addition, forward and backward traveling were both permitted and schematic diagram of FZ is shown in Figure .
2.7.3. No-backward model (NB)
The idea for No-Backward is similar to the general network model excepted for back warding is not allowed.
2.8. Multi-criteria decision analysis (MCDA)
MCDA is a multi-objective decision-making procedure. The aim of MCDA is to help identify a better solution depending on the situation and the decision maker’s area of expertise. MCDA methods such as Simple Additive Weighting (SAW; Dobrovolskienė & Pozniak, Citation2021; Sam’An et al., Citation2018; Zhao et al., Citation2021), Analysis Hierarchy Process (AHP), and Technique for Order Preference by Similarity to an Ideal Solution (TOPSIS; Akgün & Erdal, Citation2019) have been adopted. This research considered two factors: the shipping cost and truck utilization. Therefore, SAW was selected as the criterion for decision-making. This method used weights and
, which had values ranging from 0.1–0.9. These weights were used to compute the value function for evaluating the ranking and to select the best value function of the traditional model and proposed models. The best choice identified by the MCDA was the lowest value. The MCDA technique is explained as follows:
2.9. Parameters
Weight of transportation cost
Weight of truck efficiency
Function of transportation cost for experiment i (with a value scale of 0 to 1)
Function of truck efficiency for experiment i (with a value scale of 0 to 1)
Transportation cost obtained from the optimal solution for experiment i (USD)
Truck efficiency calculated for experiment i (%)
2.10. Objective function
when
Equation (9) is the objective function for obtaining the best MCDA. Equation (10) is the coding equation for the transportation cost from experiment i, with values ranging from 0 to 1. Equation (11) is the coding equation for the truck efficiency from experiment i, with
values ranging from 0 to 1. In the calculation process, the % truck efficiency is subtracted from 100% efficiency
Equation (12) ensures that the sum of
and
must equal 1 and that the values of
and
range from 0 to 1.
2.11. Experimental design
All proposed models were developed and compared to the traditional model by using 4 different data sets to ensure higher solution accuracy. Recently, the existing operation consisted of 26 nodes (excluding the depot), which was used for the first scenario. The remaining scenarios were reduced by 2 nodes until the final scenario, which had only 20 nodes. The experiments with all models and scenarios were conducted based on the above assumption. In addition to the main objective of minimizing the total cost, truck utilization was also considered by varying the to
ratio. The first ratio of 0.1:0.9 was set and then varied until a ratio of 0.9:0.1 was achieved, as shown in Table
Table 5. Experimental design of examined scenarios
3. Results
The proposed models for managing the oil transportation with the transshipment point were tested. The models were developed and solved using the LINGO® 19 optimization software package, and a PC with a 2.6 GHz Intel Core I7 Processor and 8 GB of RAM was used to run all the resulting code.
A comparison to the solutions of all the models and scenarios is shown in Table . For the 20 node—data set, Cluster model (CT) outperformed the other models. However, CT is able to travel within its predefined cluster and if the shorter point is at outside the cluster, that point will be unreachable. However, as the number of nodes increased, the No-Backward model solution was superior to the solutions of the other models. This is because the Free Zone model is able to decide to all travelling routes at first and designate for multi-drops in order to achieve the shortest distance as well as the least shipping cost. In addition, all the proposed models provided better solutions than that of the traditional model for the scenarios with more than 20 nodes.
Table 6. Total transportation cost results
On the other hand, CT outperformed all the other models with regard to truck efficiency because the planner managed better in the smaller area as CT criteria and the results were displayed in Table .
Table 7. Truck efficiency results
According to the experiments, if only the total cost was considered, NB yielded the best result among all the models, with a total average cost of 663.097 USD/Month/fleet. Conversely, if only truck utilization was considered, CT was far superior, with a truck utilization efficiency of 88.029%. However, we proposed a method for identifying the best solution when taking both total cost and truck utilization into account. A Value Function (VF) was adopted to make the MCDA decision by varying the ratio from 0.1:0.9 to 0.9:0.1. The selected 3 levels were reported as shown in Figure and Table , and CT generated the best value function.
Figure 7. Summary of the value function at different data sets for the MCDA.
Table 8. Example of selected VF by varying the ratio
4. Discussion
We proposed an oil transportation plan with transshipment points by adopting Network Flow Models (NFM) in order to develop a Generalized Network Flow Model (GNFM; Donmuen & Pitiruek, Citation2019; Hu et al., Citation2016). The general network model is widely used to formulate and solve transportation problems. One of the advantages of this model is that VRP and/or TSP can be overcome. Moreover, an advantage of NFM is that all possible links are drawn and unnecessary links are removed at the first stage. This saves computational time by removing redundant arcs.
In this research, we considered two factors (total shipping cost and truck utilization) in our objective function by applying SAW (Dobrovolskienė & Pozniak, Citation2021; Sam’An et al., Citation2018; Zhao et al., Citation2021) to aid decision-making for optimizing oil transportation. The results indicated that the cluster method, which has been extensively used by many other researchers (Islam et al., Citation2021; Mohri et al., Citation2021), provided the best efficiency compared to the other proposed methods. When the total shipping cost was considered, the cluster solution provided a better result compared to the existing practice, leading to total cost savings of 6.097%. This was better than the cost savings reported by (Charusakwong & Lohatepanont, Citation2016), who proposed two heuristic methods: 2-phase and 3-phase methods. Both methods delivered better results than that of the traditional method by 2.296%. The algorithm of (Surjandari et al., Citation2011) yielded cost savings of 5.22% compared to the traditional method by using the Tabu Search (TS) algorithm, and that of (Cornillier et al., Citation2011) led to a 4% improvement.
In addition, when the truck utilization efficiency was taken into account, the cluster method improved the efficiency from 83.149% to 88.029%, which was equivalent to the result of (L Wang et al., Citation2020) but better than those of (Ghezavati & Ghaffarpour MS, Citation2015; X Wang et al., Citation2015). Moreover, (Carotenuto et al., Citation2018) developed a hybrid genetic algorithm for a similar problem. Finally, the Collaborative Distribution Model could improve truck utilization efficiency, resulting in higher profit if a policy to negotiate more demand is applied.
The pro and con of this proposed model was that it made the oil delivery plan quite speedy compared to the existing method and also friendly used. However, the drawback of the model was not capable to include the uncertainty. However, it could be solved for one solution at a time and used the average instead.
The limitation of the proposed methods was about the cost related to the transportation. Since, in this research, we applied the real data, there would be not much room to play with the fluctuating costs. In addition, if the varying cost existed, the model was capable to handle.
5. Conclusion
Three mathematical models were proposed and developed based on the Network Model to manage the oil transportation plan of an oil business in Thailand, and the results were compared to the traditional model in terms of the shipping cost and truck efficiency. Therefore, the problem was categorized by MCDA. All the key parameters were input in the proposed optimization models, including the conditions and constraints. Furthermore, Simple Additive Weighting was also applied to help decision-making regarding a compromise between elevating the total cost and truck utilization. Finally, it was obvious that the Cluster model provided better optimal solution for both factors; a total cost of 663.097 USD/month/fleet and a truck efficiency of 88.029%. More depots, more multi-objective functions, more customers, and various truck sizes will definitely be included in the future endeavors.
Acknowledgements
The author would like to express sincere gratitude to the companies in Thailand that provided data and information for this research but whose names unfortunately cannot be revealed because of a confidentiality agreement. This study was made possible by the generous support, help with data collection, and invaluable guidance of the Supply Chain and Logistics Systems Research Unit (SCLS), Khon Kaen University, Thailand.
Disclosure statement
No potential conflict of interest was reported by the author(s).
Additional information
Funding
Notes on contributors
Komkrit Pitiruek
Komkrit Pitiruek is an assistant professor at the Department of Industrial Engineering at the Faculty of Engineering, Khon Kaen University in Thailand. His research interest focuses on Logistics and Optimization Application and Modeling.
References
- Akgün, İ., & Erdal, H. 2019. Solving an ammunition distribution network design problem using multi-objective mathematical modeling, combined AHP-TOPSIS, and GIS. Computers & Industrial Engineering, 129(January), 512–16. Internet. https://doi.org/10.1016/j.cie.2019.02.004.
- Aloui, A., Hamani, N., & Delahoche, L. (2021). An integrated optimization approach using a collaborative strategy for sustainable cities freight transportation: A case study. Sustainable Cities and Society, 75(July), 103331. https://doi.org/10.1016/j.scs.2021.103331
- Azadeh, A., Shafiee, F., Yazdanparast, R., Heydari, J., & Fathabad, A. M. (2017). Evolutionary multi-objective optimization of environmental indicators of integrated crude oil supply chain under uncertainty. Journal of Cleaner Production, 152, 295–311. https://doi.org/10.1016/j.jclepro.2017.03.105
- Bevrani, B., Burdett, R., Bhaskar, A., & Pkdv, Y. (2020). A multi-criteria multi-commodity flow model for analysing transportation networks. Oper Res Perspect, 7(July), 100159.
- Boskabadi, A., Mirmozaffari, M., Yazdani, R., & Farahani, A. (2022). Design of a distribution network in a multi-product, multi-period green supply chain system under demand uncertainty. Sustainable Operations and Computers, 3(February), 226–237. https://doi.org/10.1016/j.susoc.2022.01.005
- Carotenuto, P., Giordani, S., Massari, S., & Vagaggini, F. (2018). A multi-depot periodic vehicle routing model for petrol station replenishment. Advances in Intelligent Systems and Computing, 572, 421–437.
- Carrese, S., Cuneo, V., Nigro, M., Pizzuti, R., Ardito, C. F., & Marseglia, G. (2019). Optimization of downstream fuel logistics based on road infrastructure conditions and exposure to accident events. Transport Policy.
- Chaiyarot, M., & Pitiruek, K. Simulation and optimization model for a cross-docking distribution center: Case study of a railway business. Asia-Pacific Journal of Science and Technology, 2021; Aug 5 26(4), 1–10.
- Charusakwong, N., & Lohatepanont, M. (2016). Optimization approach for multi-period fuel replenishment. Engineering Journal, 20(5), 239–261. https://doi.org/10.4186/ej.2016.20.5.239
- Cornillier, F., Boctor, F. F., & Renaud, J. (2011). The petrol station replenishment problem with time windows. Fac Des Science L’administration, 1–20.
- Dobrovolskienė, N., & Pozniak, A. (2021). Similarity to an ideal solution : which method is better suited for assessing. 8(4), 180–196.
- Donmuen, M., & Pitiruek, K. Network model approach for fuel transportation business. IEEE Int Conf Ind Eng Eng Manag. 2019;1370–1373.
- Energy Policy and Planning Office (EPPO). Annual Report. Parasitol Int. [Internet]. 2020. [Cite 2022 Jan 31]. Available from: https://www.gulf.co.th/
- Fazayeli, S., Eydi, A., & Kamalabadi, I. N. (2018). Location-routing problem in multimodal transportation network with time windows and fuzzy demands: Presenting a two-part genetic algorithm. Computers & Industrial Engineering, 119(March), 233–246. https://doi.org/10.1016/j.cie.2018.03.041
- Fernandes, L. J., Relvas, S., & Barbosa-Póvoa, A. P. (2013). Strategic network design of downstream petroleum supply chains: Single versus multi-entity participation. Chemical Engineering Research and Design, 91(8), 1557–1587. https://doi.org/10.1016/j.cherd.2013.05.028
- Fernández, E., Andersson, H., Fagerholt, K., & Laporte, G. (2017). Computers & operations research vessel routing with pickups and deliveries : An application to the supply of o ff shore oil platforms. 79(March), 140–147.
- Ghaithan, A. M., Attia, A., & Duffuaa, S. O. (2017). Multi-objective optimization model for a downstream oil and gas supply chain. Applied Mathematical Modelling, 52, 689–708. https://doi.org/10.1016/j.apm.2017.08.007
- Ghezavati, V. R., & Ghaffarpour MS, M. H. (2015). A hierarchical approach for designing the downstream segment for a supply chain of petroleum production systems.pdf. Journal of Industrial and Systems Engineering, 8(4), 1–17.
- Gromov, V. A., Kuznietzov, K. A., & Pigden, T. (2019). Decision support system for light petroleum products supply chain. Operations Research, 19(1), 219–236.
- Hu, Q., Zhang, Z., & Lim, A. (2016). Transportation service procurement problem with transit time. Transportation Research Part B: Methodological, 86, 19–36. https://doi.org/10.1016/j.trb.2016.01.007
- Hübner, A., & Ostermeier, M. (2019). A multi-compartment vehicle routing problem with loading and unloading costs. Transportation Science, 53(1), 282–300. https://doi.org/10.1287/trsc.2017.0775
- Hwang, S. W., Kweon, S. J., & Ventura, J. A. (2017). Locating alternative-fuel refueling stations on a multi-class vehicle transportation network. European Journal of Operational Research, 261(3), 941–957. https://doi.org/10.1016/j.ejor.2017.02.036
- Islam, M. A., Gajpal, Y., & ElMekkawy, T. Y. (2021). Mixed fleet based green clustered logistics problem under carbon emission cap. Sustainable Cities and Society, 72(January), 103074. https://doi.org/10.1016/j.scs.2021.103074
- Ji, M., Shen, L., Shi, B., Xue, Y., & Wang, F. (2015). Routing optimization for multi-type containerships in a hub-and-spoke network. Journal of Traffic and Transportation Engineering, 2(5), 362–372.
- Kavirathna, C., Kawasaki, T., Hanaoka, S., & Matsuda, T. (2018). Transshipment hub port selection criteria by shipping lines: The case of hub ports around the Bay of Bengal. Journal of Shipping and Trade, 3(1), 1–25. Internet
- Kazemi, Y., & Szmerekovsky, J. (2015). Modeling downstream petroleum supply chain : The importance of multi-mode transportation to strategic planning. Transportation Research Part E, 83, 111–125. https://doi.org/10.1016/j.tre.2015.09.004
- Li, Z., & Jiang, C. (2016). Study on the transportation problem of petrol secondary distribution with considering shortage cost. Open Journal of Modelling and Simulation, 4(2), 34–40. https://doi.org/10.4236/ojmsi.2016.42004
- Martins, S., Ostermeier, M., Amorim, P., Hübner, A., & Almada-Lobo, B. (2019). Product-oriented time window assignment for a multi-compartment vehicle routing problem. European Journal of Operational Research, 276(3), 893–909. https://doi.org/10.1016/j.ejor.2019.01.053
- Mohri, S. S., Mortazavi, S., & Nassir, N. (2021). A clustering method for measuring accessibility and equity in public transportation service: Case study of Melbourne. Sustainable Cities and Society, 74(July), 103241. https://doi.org/10.1016/j.scs.2021.103241
- Office of the National Economic and Social Development Council. Thailand’s Logistics Report 2019 Logistics [Internet]. 2019. [Cite 2022 March 23]. Available from: https://www.nesdc.go.th/.
- Sam’An, M., Farikhin, Surarso, B., & Zaki, S. (2018, March). A modified algorithm for full fuzzy transportation problem with simple additive weighting. 2018 Int Conf Inf Commun Technol ICOIACT 2018, 6, 684–688.
- Solheim, M. C. W., & Tveterås, R. (2017). Benefitting from co-location? Evidence from the upstream oil and gas industry. The Extractive Industries and Society, 4(4), 904–914.
- Surjandari, I., Rachman, A., Dianawati, F., & Wibowo, R. P. (2011). Oil fuel delivery optimization for multi product and multi depot: The case of petrol station replenishment problem (PSRP). International Conference Graph Image Process (ICGIP 2011), 8285, 82853.
- Tanco, M., Cat, L., & Garat, S. (2019). A break-even analysis for battery electric trucks in Latin America. Journal of Cleaner Production, 228, 1354–1367. https://doi.org/10.1016/j.jclepro.2019.04.168
- Tirkolaee, E. B., & Aydin, N. S. (2022). Integrated design of sustainable supply chain and transportation network using a fuzzy bi-level decision support system for perishable products. Expert Systems with Applications, 195(November), 116628. https://doi.org/10.1016/j.eswa.2022.116628
- Verma, A., Nimana, B., Olateju, B., Rahman, M. M., Radpour, S., Canter, C., Subramanyam, V., Paramashivan, D., Vaezi, M., & Kumar, A. (2017). A techno-economic assessment of bitumen and synthetic crude oil transport (SCO) in the Canadian oil sands industry: Oil via rail or pipeline? Energy, 124, 665–683. https://doi.org/10.1016/j.energy.2017.02.057
- Wang, L., Kinable, J., & van Woensel, T. (2020). The fuel replenishment problem: A split-delivery multi-compartment vehicle routing problem with multiple trips. Computers & Operations Research, 118, 104904. https://doi.org/10.1016/j.cor.2020.104904
- Wang, X., Zhan, H., & Zhang, J. (2015). Research of oil product secondary distribution optimization based on collaborative distribution. Procedia Computer Science, 60(1), 1367–1376. https://doi.org/10.1016/j.procs.2015.08.210
- Zhao, D., Liu, J., Sun, L., Ye, B., Hubacek, K., Feng, K., & Varis, O. (2021). Quantifying economic-social-environmental trade-offs and synergies of water-supply constraints: An application to the capital region of China. Water Research, 195, 116986. https://doi.org/10.1016/j.watres.2021.116986