
 ?Mathematical formulae have been encoded as MathML and are displayed in this HTML version using MathJax in order to improve their display. Uncheck the box to turn MathJax off. This feature requires Javascript. Click on a formula to zoom.
Abstract
Cardiovascular diseases have been a leading cause of death for the past several decades. A comparison of blood flow patterns through diseased and treated arteries can be beneficial in diagnosis and treatment. The computational fluid dynamic (CFD) analysis was utilized to numerically simulate the blood flow dynamics of stenosed and stented carotid artery bifurcation. Two lumen models were generated: first with the stenosis and then a stent was introduced to remove the abnormality. The control volume method was implemented to discretize the blood domain, and then the steady-state velocity inlet was used based on the measured blood flow rate. The transitional flow was observed in the post-stenotic region due to the high Reynold’s number near peak systole; however, the flow exhibited laminar characteristics at the peak diastole. Four distinct locations downstream of the stenosis were used to compare the results. The internal carotid artery (ICA) stenosis resulted in high wall shear stresses, irregular flow patterns, and low-pressure areas. The velocity and pressure profiles oscillated in the immediate vicinity downstream of the stenosis. The stented model showed minimal pressure and velocity fluctuations, as well as minimal wall shear stresses. Additionally, for the stented model, the flow could not enter the transitional regime under both conditions. The proposed simulation methodology can be utilized until the abnormalities in the carotid artery geometry are removed and normal blood flow characteristics are achieved, which then become the basis for an optimal design of a carotid artery stent.
1. Introduction
The normal blood flow in the carotid artery means that the artery is free of any significant blockage or narrowing. A stroke occurs when the supply of blood to brain is interrupted or reduced. This prevents the supply of oxygen and nutrients to the brain and as a result brain cells start dying within minutes of a stroke. The estimated risk of stroke in a lifetime for an individual 25 years or above was 22.8% in 1990; the risk has increased to 24.9% in 2016 (Gorelick, Citation2019). Atherosclerosis is a cause of carotid stenosis, which results in the narrowing of the carotid artery because of plaque buildup. A patient with a completely blocked carotid artery is at an increased risk of stroke. A computed tomography angiography (CTA; Kigka et al., Citation2019) or Doppler ultrasound of the neck (Brook, Citation2020), magnetic resonance angiography (Cavallo et al., Citation2019), or a cerebral angiogram (Allison et al., Citation2021) are used to diagnose carotid stenosis. The condition is often treated with a minimally invasive procedure called carotid artery stenting (Ahn et al., Citation2013; White et al., Citation2022), which compresses the plaque and increases the lumen of an artery. A stent is a self-expanding mesh-like structure of tubular form, which is placed inside the artery to remove blockage of blood flow. Patients with moderate to high-grade carotid stenosis (more than 70%) are typically suggested a stenting procedure. The post-procedure angiograms demonstrate a high precision in which a stent restores the vessel to its normal dimension (Wholey & Finol, Citation2007).
Regions with low wall shear stress (WSS) and flow disruption such as junctions, bifurcations, and high curvature regions in arteries are susceptible to atherosclerosis (Lee et al., Citation2008). The characteristics that distinguish blood dynamics such as: pressure and velocity gradients, flow features, and shear stress on the artery wall are mainly accountable for the deposit of cells and lipids, which is a leading cause of atherosclerosis (Elshin Joel & Anburajan, Citation2013). Constrictions in blood flow cause localized flow acceleration. The skewed velocity profiles can cause localized areas of directional oscillation WSS. Atherosclerosis is usually localized in this region and causes stenosis. Stenosis can cause localized turbulent flow, which results in reduction of flow owing to head loss and flow choking (Ku, Citation1997). Localized flow acceleration in the stenosed region of an artery can also cause a high WSS. High WSS along with turbulence in the stenosed region may cause damage to endothelial cells and can initiate platelet activation and plaque (Sousa et al., Citation2016). The risk of thrombus formation and an incidence of atherosclerosis is significantly higher in the region of disturbed flow in the ICA especially on the outer wall where a stagnation point is located (Motomiya & Karino, Citation1984). Moreover, it was established that turbulent fluctuations of pressure increase with the intensity of stenosis and can induce plaque injury (Loree et al., Citation1991). The most frequently used blood viscosity models have been the Carreau model (Cho & Kensey, Citation1991), Walburn–Schneck model (Walburn & Schneck, Citation1976), and Generalized Power Law model (Ballyk et al., Citation1994). These models have been established by employing data fitting to estimate viscosity at different shear rates, measured in steady-state blood flow (Johnston et al., Citation2004).
Numerical studies based on flexible or rigid models and more recently on patient-specific geometries have proven to be helpful in understanding complex arterial flow patterns (Politis et al., Citation2008). CFD techniques have been successfully implemented to analyze blood flow in human blood vessels (Wei et al., Citation2021; Xu et al., Citation2018). It has been shown that the hemodynamic characteristics of intracranial atherosclerosis (ICAS) can be evaluated using CFD models replicated from CTA images (Leng et al., Citation2014). The data successfully predicts future risk of stroke in patients with symptomatic ICAS of high-grade stenosis. The effect of stent design on in-stent hydrodynamics was studied for stented patient-specific carotid arteries using CFD (Johari et al., Citation2020). It was found from the analysis of three different stent designs that the stent design and geometric features of the stented vessel have a strong influence on the local hydrodynamic parameters. The CFD models were utilized further to compare the vascular remodeling process of carotid artery stenting-treated patients with carotid endarterectomy-treated patients (Raptis et al., Citation2022). The mass flow and shear stress within the carotid bifurcation has been analyzed using finite volume approach (Gorder, Citation2010), a discretization method that comes under the domain of CFD. It was surmised that the variation of WSS and wall pressure gradient (WPG) with bifurcation angle has influence on the propagation of the disease. The influence of arterial geometry on atherosclerosis is studied through numerical simulations. To this end, varying conditions of the disease are determined in correlation with change in bifurcation angle of the left coronary artery (Zhang et al., Citation2017). Differences in WSS-based descriptors and pressure gradient in stenosed carotid arteries from patients and healthy volunteers were investigated, and eight carotid geometries were identified which were further divided into four groups to analyze the variation in terms of WSS for different groups (Mendieta et al., Citation2020). The pulsatile transitional through an acute real stenosis located just before the bifurcation between the right subclavian artery and the right common carotid artery was simulated. The applicability of numerical methodology to deduce clinical conclusions was demonstrated (Agujetas et al., Citation2017). A new semi-empirical viscosity model accounting for deformability of red blood cells (RBCs) in modeling blood flow was developed, and then employed to study the effect of RBCs deformity in carotid bifurcation of a healthy human (Urevc et al., Citation2017). The origin and development of plaque in the carotid region are influenced by the local hemodynamic forces (Moradicheghamahi et al., Citation2019).
The present work focuses on the analysis of flow characteristics in a patient-specific bifurcation of carotid artery. Two computer-aided design (CAD) models were generated and analyzed. The first model contained a stenosis region, while the second model was modelled for an open-cell stent. The blood domain was discretized using the finite volume method (FVM). The proximal end of the common carotid artery (CCA) was designed as velocity inlet; the distal ends of the ICA and the external carotid artery (ECA) were designed as the pressure outlets. The flow was assumed to be constantly divided between ICA and ECA with a ratio of 59:41 (Lee et al., Citation2008). The models were solved for two steady-state boundary conditions: one near the peak systole and the other at the diastole. The time-independent problem was easier to solve computationally and sufficiently predicts the flow phenomenon around constrictions in the blood vessels (Back et al., Citation1984). The effect of stenosis and the bend in the ICA on flow variables like velocity planes, vectors, streamlines, pressure contours and WSS contours was studied. The results were then compared with the values of flow variable obtained from the stented model to demonstrate how the introduction of a stent helps in achieving the normal blood flow characteristics.
2. Generation of solid model
Solid models have been developed based on patient-specific geometric parameters of a stenosed carotid bifurcation obtained through a computerized X-ray tomography scanner (Lee et al., Citation2008). The model represented the fluid domain which was discretized using finite volume method. A numerical solver was used to compute the flow variables, i.e. velocity, pressure, and WSS. The vessel diameters of the carotid arteries and the stenosis are shown in Table . The stenosis corresponds to 45% area reduction in comparison to ICA outlet.
Table 1. Lumen diameters of carotid arteries and the stenosis
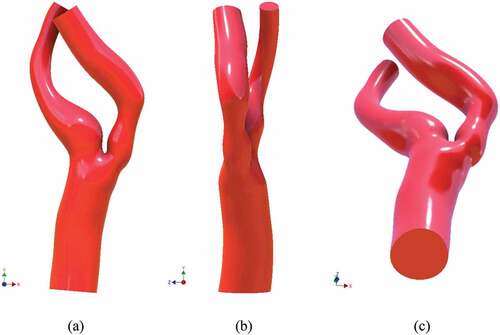
A commercially available CAD package Autodesk Inventor v.2017 was used to develop the solid models. A scaled image of geometry was imported to create the 2D sketch using non-uniform rational B-splines (NURBS), as shown in Figure ). The use of B-splines for the construction of vessel walls and the use of control points to adjust their smoothness have been explained (Milner et al., Citation1998). Next, the wireframe model, named as 3D Guide Curves, was constructed which provided basis for the solid model. The wireframe model incorporates significant non-co-planarity and the sharp bend at the end of stenosis. Lumen cross-sections were sketched at appropriate locations across the 3D Guide Curves shown in Figure ). Solid loft tool was used to generate CCA, ICA, and ECA, Figure ). The bifurcation region was created using the surface boundary tool with G2 continuity at the edges. Figure shows the front, side, and bottom views of the stenosed model.
Figure 1. Sketch geometry and lofted model; (a) 2D NURBS sketched on image (b) 3D Guide Curves with lumen cross sections (c) Lofted models of CCA, ICA, and ECA.
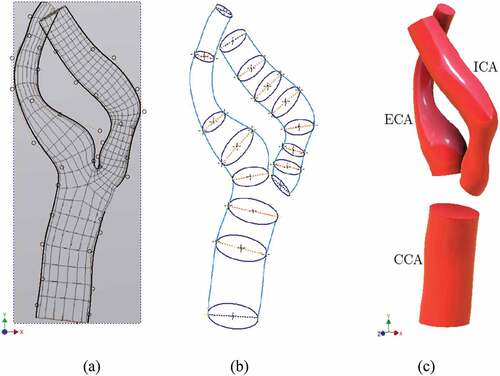
Figure 2. Complete stenosed model including bifurcation region; (a) front view (b) side view (c) perspective bottom view.
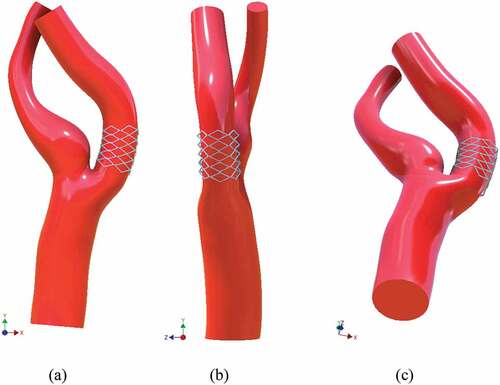
The model was regenerated to remove the stenosis and optimize it for stent insertion. 2D NURBS sketch was altered to approximate the healthy condition. The goal was to equate the area of the stenosis region to that of the ICA outlet. Once this was achieved, an open-cell bent stent was wrapped around the optimized region. Three different views of the stented model, i.e. front, side, and bottom, are shown in Figure .
Figure 3. Stented model with stenosis removed; (a) front view (b) side view (c) perspective bottom view.
3. Discretization of blood domain
The blood domain was discretized using the finite volume method (FVM). It was performed in ANSYS ICEM CFD v.17.2 which is a commercially available Finite Element (FE) software. In order to improve the surface topology and reduce the number of mesh elements, four virtual cells were inserted. Figure ) shows the regions of these virtual cells. The first cell comprised CCA; the second included the bifurcation region, ICA stenosis, and the carotid sinus. The remaining portions of ICA and ECA were covered by two individual virtual cells.
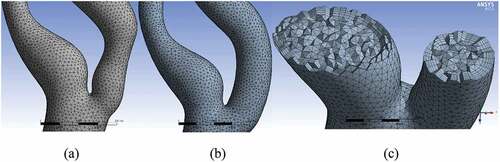
Figure 4. Virtual topology, surface and inflation mesh; (a) four virtual cells, (b) surface mesh without any dense mesh at the boundaries of virtual cells, (c) inflation mesh with five layers.
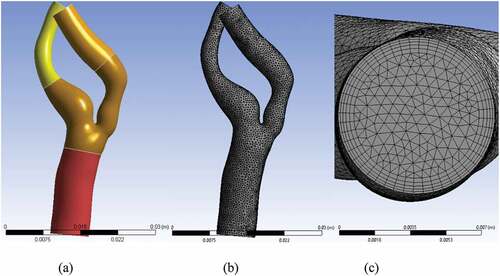
The mesh was generated in three steps: First, the surface mesh was generated with an element size of 0.5 mm, as shown in Figure ). In order to simulate the boundary layer appropriately, an inflation mesh with a total thickness of 0.77 mm was generated, as shown in Figure ). Finally, the 3D volume mesh was generated, which comprised tetrahedral elements. The close-up views of bifurcation for the stenosed and the stented models are depicted in Figure , respectively. Figure ) shows the cut-away section of both ICA and ECA to visualize the 3D tetrahedral elements clearly. The total number of elements in the stenosed and stented models was 1.55 × 10⁵ and 1.6 × 10⁵, respectively.
Figure 5. Meshed models: (a) stenosed model, (b) stented model, (c) Section view showing 3D tetrahedral elements.
4. Flow properties and boundary conditions
The numerical computations were performed using commercially available FE software ANSYS Fluent v17.2. The flow properties of blood through CCA and ICA are presented in Table . Reynolds numbers were calculated using the following relationship:
Table 2. Blood flow properties through CCA and ICA
where, ρ, Q, μ, and D, are fluid density, flow rate, dynamic viscosity, and vessel diameter, respectively. The Reynolds number in the stenosed area for the peak systole is around 1200 which is less than the critical Reynolds number for tube flows, i.e. 2000. A fixed velocity profile based on the blood flow rate through CCA was specified at the inlet. The flow rates along with the 59:41 division of flow between the ICA and ECA were used (Lee et al., Citation2008). The inlet velocity was calculated to be 0.3815 m/s and 0.0769 m/s for the near peak systole and at the diastole, respectively. The outlets of ECA and ICA were modeled with stress-free boundary condition, with the outlet pressure as zero for fully developed flow (Fischer et al., Citation2007).
The numerical results were obtained for both the stenosed and the stented models. A comparison of the results for both models was made and the conclusions are deduced.
5. Evaluation of flow variables
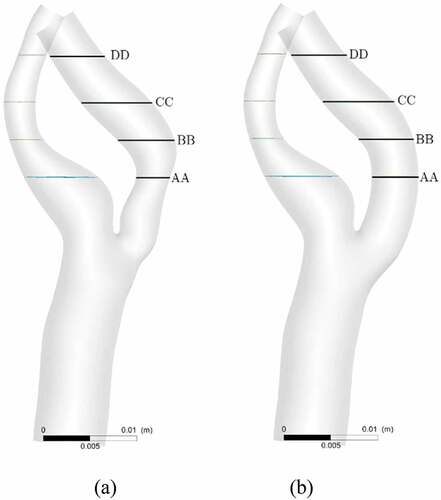
Four cross-sectional velocity planes were inserted downstream of the stenotic-region to obtain the spatial variation of the velocity. Figure shows the locations of four selected planes for both the stenosed and the stented models. The plane AA was downstream of the stenosis, and the plane BB was at the bend. The next two planes CC and DD were in the remaining post-stenotic section of the ICA.
Figure 6. Locations of four slice planes inserted into ICA for velocity analysis; (a) stenosed model, (b) stented model.
For the stenosed model, a test solution is run near peak systolic flow conditions. The obtained results are compared and found to be in a close agreement with those mentioned by Lee and Fischer (Lee et al., Citation2008). The average velocity is obtained as 1.205 m/s with 0.42% error, and the pressure difference between inlet and outlet is found as 1000 Pa with 3.2% error. Furthermore, the difference of mass flow in and the total mass flow out, i.e. mass flow imbalance, is recorded as −8 × 10⁻⁸ kg/s, which shows that the mass is conserved. The solution is run for both the stenosed and the stented models at the near peak systole and the diastole states.
5.1. Velocity profiles
A comparison of velocity patterns at near peak systole for both stenosed and stented models is presented in Figure , whereas the comparison of velocity patterns at peak diastole conditions for both stenosed and stented models is presented in Figure . The overall behavior of velocity showed that it was maximum near the outlying wall of the ICA and decreased toward the inner wall. This is mainly due to the flow acceleration in the stenosis and the bending of the ICA.
Figure 7. Velocity profiles on the slice planes AA, BB, CC, DD near peak systole: stenosed model in top row and stented model in bottom row.
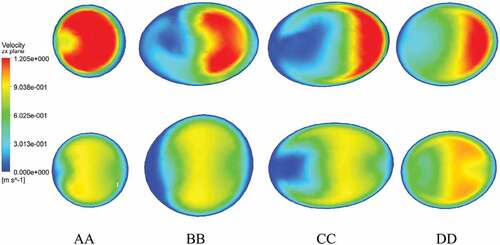
Figure 8. Velocity profiles on the slice planes AA, BB, CC, DD at peak diastole: stenosed model in top row and stented model in bottom row.
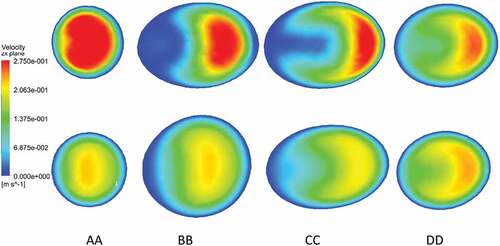
In the stenosed model, the maximum velocity was observed just downstream of stenosis, as shown at section AA in Figure and Figure . In the post-stenotic region, just at the bend, the velocity was zero near the inner wall of the ICA which caused the stagnation and flow separation in that region, as shown at section BB in Figure and Figure . This flow separation region widened moving downstream of the stenosis, as shown at sections CC and DD in Figure and Figure . The maximum velocity in the stented model was 17% and 27% lesser than that in the stenosed model at near peak systole and peak diastole, respectively.
5.2. Flow transition
The flow exhibited a weak transitional turbulent behavior in the post-stenotic region, which is evident from the streamlines behavior shown in Figure for the stenosed model at the near peak systole and diastole conditions, respectively. The streamlines are smooth and uniform in CCA and exhibit an irregular behavior in the ICA.
Figure 9. Velocity streamlines: (a) near peak systole in stenosed model; (b) at peak diastole in the stenosed model, (c) near peak systole in the stented model, (d) at peak diastole in the stented model.
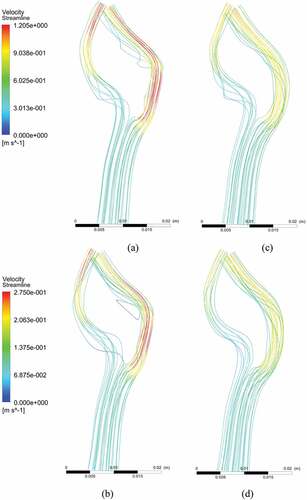
The streamlines moved away from the inner wall which corresponded to flow separation and recirculation in this region. It happened due to the accelerating flow through the narrow lumen (stenosis). In the stented model, the streamlines were undisturbed due to non-accelerating flow, as depicted in Figure .
5.3. Mid-Plane velocity profiles
The stenosed region of the ICA was relatively straight in the beginning and had a sharp inward bend which caused the velocity profiles to skew toward inner arterial wall. The mid-plane velocity vectors near peak systole for stenosed and stented models are depicted in Figure , respectively, whereas the mid-plane velocity vectors at peak diastole for stenosed and stented models are in Figure , respectively. These patterns exhibit an asymmetric and complex nature, which is a result of irregular lumen of the artery. The skewness of velocity profiles is an outcome of significant change in curvature along ICA and ECA. A reduction in skewness of these profiles can be observed for the stented model of the artery.
Figure 10. Mid-plane velocity vectors; (a) near peak systole for stenosed model, (b) near peak systole for stented model, (c) at peak diastole for stenosed model, (d) at peak diastole for stented model.
5.4. Flow recirculation
The in-plane vectors of velocity at four different cross-sections AA, BB, CC, and DD near peak systole are shown in Figure . The velocity vectors had the highest magnitude near the outer wall, and it decreased toward the inner wall. The recirculation was maximum near the stenosis and the bending region. It decreased to almost negligible as the cross-section again widened to a uniform value. In the stented model, a small recirculation occurred due to the bending of the ICA.
Figure 11. In-plane velocity vector near peak systole at four cross-sections AA, BB, CC, and DD; top row for stenosed model, bottom row for stented model.
5.5. Pressure and Wall Shear Stress (WSS) distributions
The averaged pressure change between the inlet and the outlets is given in Table .
Table 3. Averaged pressure change between inlet and outlet for two different conditions for both models
The data shows a decrease in pressure difference of 40% and 33% for the stented model near the peak systole and at the peak diastole conditions, respectively.
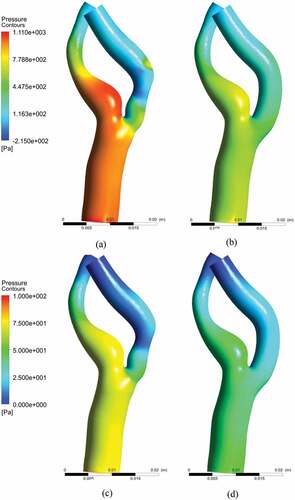
The pressure distributions at near peak systole for stenosed and stented models are demonstrated in Figure , respectively, whereas the pressure distributions for peak diastole stenosed and stented models are in Figure , respectively. The distribution of pressure along the wall has shown low pressure in the post-stenotic region. The least values of pressure can be observed at the outer end of the stenosis before the bend. The localized regions of low pressure could also be observed at the interior wall of the bend. The pressure on the inner side of the ICA wall in the post-stenotic region is lower than the outer side which explains the inward bending. In the stented models, the pressure distributions exhibited a uniform profile along the ICA, which represented a healthy condition.
Figure 12. Pressure distribution: (a) near peak systole stenosed model, (b) near peak systole stented model (c) peak diastole stenosed model, (d) peak diastole stented model.
The WSS distributions at near peak systole for stenosed and stented models are demonstrated in Figure , respectively, whereas the WSS distributions for peak diastole in stenosed and stented models are in Figure , respectively. The WSS distribution along the arterial wall demonstrated higher values of stress in the stenosis and exterior wall of the ICA. This corresponded with the elevated level of velocity gradient with an asymmetric velocity profile.
Figure 13. Wall shear stress (WSS) distribution: (a) near peak systole model, (b) near peak systole stented model (c) peak diastole stenosed model, (d) peak diastole stented model.
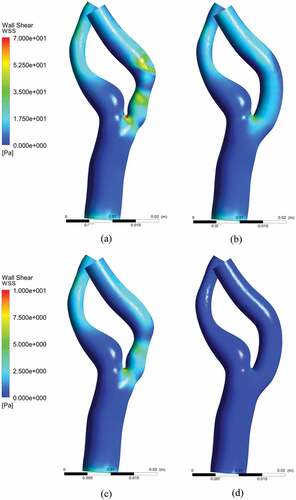
The instantaneous WSS values, near peak systole, were 35–50 Pa in the stenotic region and 20–55 Pa at the exterior wall. The low levels of WSS in the ICA were the regions related to the apex-induced and the stenosis-induced flow detachment along the inner wall. The highest value of WSS occurred at the bifurcation, which was due to the flow division into ICA and ECA. In stented models, the wall shear stress exhibited uniform profile along the ICA, which represented a healthy condition. The maximum value of WSS at the outer wall was observed to be 15 Pa, which was due to the bend of the ICA. However, it was much lesser as compared to 55 Pa; the highest value of WSS for the stenosed model.
5.6. Pressure and velocity profiles along the streamline
A streamline originating at the inlet, passing through the CCA and ICA, was selected for pressure and velocity analyses. The maximum pressure and velocity at the given streamline for all four cases are given in Table .
Table 4. The maximum pressure and velocity for both the stenosed and stented models near peak systole and diastole conditions
The pressure and velocity distributions for stenosed and stented models at near peak systole and peak diastole conditions were compared. The bifurcation started at Y = 0.02 m approx. The region 0.023 m Y
0.045 m represented the ICA stenosis and the post-stenotic region including the bend. The pressure and velocity curves for systolic and diastolic conditions showed a similar behavior.
Figure shows a sudden pressure drop at the start of bifurcation for stenosed and stented models at near peak systole and peak diastole conditions, respectively. High fluctuations in pressure were observed at the stenosis and in the post-stenotic bend regions. These fluctuations were greatly reduced in stented models due to more uniformity in geometry.
Figure 14. Pressure variation for stenosed and stented models at; (a) near peak systole, (b) peak diastole.
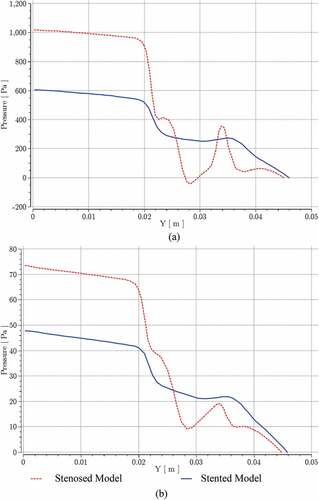
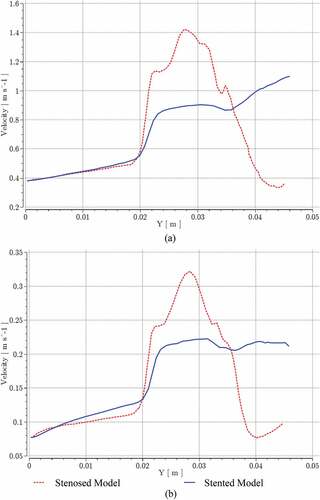
At the given streamline, the maximum pressure difference between stenosed and stented models at the inlet and ICA outlet was reduced by 40% at near peak systole and by 35% at the peak diastole. Similarly, Figure shows a sudden increase in velocity at the start of bifurcation for stenosed and stented models at near peak systole and peak diastole conditions, respectively. Most of the velocity oscillations were recorded at the stenosis and in the post-stenotic bend regions. These oscillations were greatly reduced in the stented model, and at the given streamline, the maximum velocity was reduced by 21% at near peak systole and by 33% at the peak diastole.
Figure 15. Velocity variation for stenosed and stented models at; (a) near peak systole, (b) peak diastole.
6. Discussion of results
The maximum value of velocity was found near the end of stenosis due to an accelerating flow. The velocity distributions showed that the velocity was maximum at the outer wall of the curvature and decreased toward the inner wall. A stagnation condition and flow separation occurred at the inner wall. In the case of the stented model, the velocity distribution pattern was similar to that of the stenosed model due to ICA bending. However, the stagnation and the flow separation did not occur and the maximum value of velocity was considerably reduced.
A uniform pressure distribution was observed in the CCA and the ECA sinus. The pressure was minimum in the ICA because of a high velocity. Furthermore, a negative gauge pressure was observed on the inner wall of the ICA stenosis. The WSS was maximum at the apex, in the stenosis region, and at the outer wall of the ICA bend. The stented model depicted a uniform and low WSS distribution.
The pressure and velocity fluctuations were maximum at the stenosis and in the post-stenotic regions including the bend in the ICA, which occurred due to the flow transition and recirculation. However, in the stented model, pressure and velocity oscillations in the ICA were minimized due to the uniform lumen cross-section. Furthermore, the blood flow patterns were qualitatively similar at both the conditions, i.e. near peak systole and at the peak diastole.
7. Conclusions
CFD analysis of a patient-specific lumen model of carotid bifurcation provides a reliable information about the blood flow characteristics. Two significant states of human cardiac cycle, near the peak systole and at the peak diastole, are analyzed based on steady-state boundary conditions. The stenosis exhibits a high velocity, low pressure, and an oscillating WSS. The regions downstream of the stenosis show a high degree of pressure and velocity fluctuations, and this phenomenon is enhanced if the artery is bent. The outer wall of the ICA bend has high wall shear stress as compared to the inner wall. These abnormalities can be easily removed in the geometry, and the resulting model can be analyzed. This process can be repeated until nearly normal blood flow characteristics are observed. The current study deals only with the steady-state analysis at two peaks of the cardiac cycle, the assumption of blood as a Newtonian fluid was considered, and the influence of surface change after placing the stent was not studied. The proposed method is computationally inexpensive and practically cost effective to achieve an optimal artery stent design for normal blood flow based on the blood flow analysis of the stenosed carotid artery bifurcation.
Disclosure statement
No potential conflict of interest was reported by the author(s).
Data availability statement
There is no associated data for this manuscript.
Additional information
Funding
References
- Agujetas, R., Ferrera, C., Marcos, A. C., Alejo, J. P., & Montanero, J. M. (2017). Numerical and experimental analysis of the transitional flow across a real stenosis. Biomechanics and Modeling in Mechanobiology, 16(4), 1447–19. https://doi.org/10.1007/s10237-017-0898-2
- Ahn, S. H., Prince, E. A., & Dubel, G. J. (2013). Carotid artery stenting: Review of technique and update of recent literature. Seminars in Interventional Radiology, 30(3), 288–296. https://doi.org/10.1055/s-0033-1353482
- Allison, C., Sharma, V., Park, J., Schirmer, C. M., & Zand, R. (2021). Contrast-Induced encephalopathy after cerebral angiogram: A case series and review of literature. Case Reports in Neurology, 13(2), 405–413. https://doi.org/10.1159/000516062
- Back, L. H., Cho, Y. I., Crawford, D. W., & Cuffel, R. F. (1984). Effect of mild atherosclerosis on flow resistance in a coronary artery casting of man. Journal of Biomechanical Engineering, 106(1), 48–53. https://doi.org/10.1115/1.3138456
- Ballyk, P. D., Steinman, D. A., & Ethier, C. R. (1994). Simulation of non-Newtonian blood flow in an end-to-side anastomosis. Biorheology, 31(5), 565–586. https://doi.org/10.3233/BIR-1994-31505
- Brook, I. (2020). Paroxysmal hypertensive episodes caused by direct massage of the carotid artery by a Doppler ultrasound of the neck in a laryngectomee. Journal of Medicine Ultrasound, 28(2). https://doi.org/10.4103/JMU.JMU_77_19
- Cavallo, A. U., Koktzoglou, I., Edelman, R. R., Gilkeson, R., Mihai, G., Shin, T., & Rajagopalan, S. (2019). Noncontrast magnetic resonance angiography for the diagnosis of peripheral vascular disease. Circulation. Cardiovascular Imaging, 12(5). https://doi.org/10.1161/CIRCIMAGING.118.008844
- Cho, Y. I., & Kensey, K. R. (1991). Effects of the non-Newtonian viscosity of blood on flows in a diseased arterial vessel. Part 1: Steady flows. Biorheology, 28(3–4), 241–262. https://doi.org/10.3233/BIR-1991-283-415
- Elshin Joel, M., & Anburajan, M. (2013). 3D Modeling of Stenotic Internal Carotid Artery Treated with Stent: A CFD Analysis of Blood. Proceedings of the International Conference on Computer, Networks and Communication Engineering (ICCNCE 2013). China. https://doi.org/10.2991/iccnce.2013.36
- Fischer, P. F., Loth, F., Lee, S. E., Lee, S. W., Smith, D. S., & Bassiouny, H. S. (2007). Simulation of high-Reynolds number vascular flows. Computer Methods in Applied Mechanics and Engineering, 196(31–32), 3049–3060. https://doi.org/10.1016/j.cma.2006.10.015
- Gorder, R. (2010). Mass transport and shear stress within the carotid artery bifurcation : A study of flow effects on atherosclerosis. University of Washington MSc Thesis, 1–81. https://depts.washington.edu/fluidlab/theses/riley-thesis.pdf
- Gorelick, P. B. (2019, May). The global burden of stroke: Persistent and disabling. The Lancet Neurology, 18(5), 417–418. https://doi.org/10.1016/S1474-4422(19)30030-4
- Johari, N. H., Hamady, M., & Xu, X. Y. (2020). A computational study of the effect of stent design on local hemodynamic factors at the carotid artery bifurcation. Artery Research, 26(3), 161–169. https://doi.org/10.2991/ARTRES.K.200603.001
- Johnston, B. M., Johnston, P. R., Corney, S., & Kilpatrick, D. (2004). Non-Newtonian blood flow in human right coronary arteries: Steady state simulations. Journal of Biomechanics, 37(5), 709–720. https://doi.org/10.1016/j.jbiomech.2003.09.016
- Kigka, V. I. et al. (2019). A three-dimensional quantification of calcified and non-calcified plaques in coronary arteries based on computed tomography coronary angiography images: Comparison with expert’s annotations and virtual histology intravascular ultrasound. Computers in Biology and Medicine, 113, 103409. https://doi.org/10.1016/j.compbiomed.2019.103409
- Ku, D. N. (1997). Blood flow in arteries. Annual Review of Fluid Mechanics, 29(1), 399–434. https://doi.org/10.1146/annurev.fluid.29.1.399
- Lee, S. E., Lee, S. W., Fischer, P. F., Bassiouny, H. S., & Loth, F. (2008). Direct numerical simulation of transitional flow in a stenosed carotid bifurcation. Journal of Biomechanics, 41(11), 2551–2561. https://doi.org/10.1016/j.jbiomech.2008.03.038
- Leng, X., Scalzo, F., Ip, H. L., Johnson, M., Fong, A. K., Fan, F. S. Y., Chen, X., Soo, Y. O. Y., Miao, Z., Liu, L., Feldmann, E., Leung, T. W. H., Liebeskind, D. S., & Wong, K. S. (2014). Computational fluid dynamics modeling of symptomatic intracranial atherosclerosis may predict risk of stroke recurrence. PLoS One, 9(5), e97531. https://doi.org/10.1371/journal.pone.0097531
- Loree, H. M., Kamm, R. D., Atkinson, C. M., & Lee, R. T. (1991). Turbulent pressure fluctuations on surface of model vascular stenoses. American Journal of Physiology, 261(3), 30–33. https://doi.org/10.1152/ajpheart.1991.261.3.h644
- Mendieta, J. B., Fontanarosa, D., Wang, J., Paritala, P. K., McGahan, T., Lloyd, T., & Li, Z. (2020). The importance of blood rheology in patient-specific computational fluid dynamics simulation of stenotic carotid arteries. Biomechanics and Modeling in Mechanobiology, 19(5), 1477–1490. https://doi.org/10.1007/s10237-019-01282-7
- Milner, J. S., Moore, J. A., Rutt, B. K., & Steinman, D. A. (1998). Hemodynamics of human carotid artery bifurcations: Computational studies with models reconstructed from magnetic resonance imaging of normal subjects. Journal of Vascular Surgery, 28(1), 143–156. https://doi.org/10.1016/S0741-5214(98)70210-1
- Moradicheghamahi, J., Sadeghiseraji, J., & Jahangiri, M. (2019, January). Numerical solution of the Pulsatile, non-Newtonian and turbulent blood flow in a patient specific elastic carotid artery. International Journal of Mechanical Sciences, 150, 393–403. https://doi.org/10.1016/J.IJMECSCI.2018.10.046
- Motomiya, M., & Karino, T. (1984). Flow patterns in the human carotid artery bifurcation. Stroke, 15(1), 50–56. https://doi.org/10.1161/01.str.15.1.50
- Politis, A. K., Stavropoulos, G. P., Christolis, M. N., Panagopoulos, P. G., Vlachos, N. S., & Markatos, N. C. (2008). Numerical modelling of simulated blood flow in idealized composite arterial coronary grafts: Transient flow. Journal of Biomechanics, 41(1), 25–39. https://doi.org/10.1016/j.jbiomech.2007.08.007
- Raptis, A., Tasso, P., Batzalexis, K., Gallo, D., Xenos, M., Morbiducci, U., & Giannoukas, A. (2022, January). Remodeling effects of carotid artery stenting versus endarterectomy with patch angioplasty in terms of morphology and hemodynamics. Computers in Biology and Medicine, 140, 105072. https://doi.org/10.1016/J.COMPBIOMED.2021.105072
- Sousa, L. C., Castro, C. F., António, C. C., Sousa, F., Santos, R., Castro, P., & Azevedo, E. (2016). Computational simulation of carotid stenosis and flow dynamics based on patient ultrasound data – A new tool for risk assessment and surgical planning. Advances in Medical Sciences, 61(1), 32–39. https://doi.org/10.1016/j.advms.2015.07.009
- Urevc, J., Zun, I., Brumen, M., & Stok, B. (2017). Modeling the effect of red blood cells deformability on blood flow conditions in human carotid artery bifurcation. Journal of Biomechanical Engineering, 139(1). https://doi.org/10.1115/1.4035122
- Walburn, F. J., & Schneck, D. J. (1976). A constitutive equation for whole human blood. Biorheology, 13(3), 201–210. https://doi.org/10.3233/BIR-1976-13307
- Wei, L., Wang, J., Chen, Q., & Li, Z. (2021). Impact of stent malapposition on intracoronary flow dynamics: An optical coherence tomography-based patient-specific study. Medical Engineering & Physics, 94, 26–32. https://doi.org/10.1016/j.medengphy.2021.06.002
- White, C. J., Brott, T.J., Gray , W. A., Heck , D., Jovin, T., Lyden, S. P., Metzger, D. C., Rosenfield, K., Roubin, G., Sachar, R., & Siddiqui, A. (2022, July). Carotid Artery Stenting: JACC state-of-the-art review. Journal of the American College of Cardiology, 80(2), 155–170. https://doi.org/10.1016/J.JACC.2022.05.007
- Wholey, B. Y. M. H., & Finol, E. A. (2007). Designing the ideal stent. Endovascular Today, (March), 1–6. https://evtoday.com/articles/2007-mar/EVT0307_01-php
- Xu, P., Liu, X., Zhang, H., Ghista, D., Zhang, D., Shi, C., & Huang, W. (2018). Assessment of boundary conditions for CFD simulation in human carotid artery. Biomechanics and Modeling in Mechanobiology, 17(6), 1581–1597. https://doi.org/10.1007/s10237-018-1045-4
- Zhang, B., Jin, Y., Wang, X., Zeng, T., & Wang, L. (2017). Numerical simulation of transient blood flow through the left coronary artery with varying degrees of bifurcation angles. Journal of Mechanics in Medicine and Biology, 17(1), 1750005. https://doi.org/10.1142/S0219519417500051