
 ?Mathematical formulae have been encoded as MathML and are displayed in this HTML version using MathJax in order to improve their display. Uncheck the box to turn MathJax off. This feature requires Javascript. Click on a formula to zoom.
Abstract
Despite the widespread use of pultruded Fibre-reinforced Polymers (FRP) profiles, there is still a lack of standardised guidelines for the design of bending test setups on the structural-size level to match the structural stability demands of real applications in construction. This study investigates and compares the structural instability failure modes of lateral-torsional buckling, local buckling, and web crippling of I-shape pultruded FRP profiles under three-point and four-point bending. A novel modelling approach capable of capturing the longitudinal and sectional instabilities was established and verified against published experimental data and against the theory. The validated modelling approach was used to perform parametric studies on the bending test setup parameters, namely the span-to-depth ratio L/d and shear span-to-depth ratio a/d. The effect of these parameters on the failure modes and their thresholds was investigated and their interactions were characterised. Guidelines and recommendations were proposed for consideration when designing test setups and span lengths of I-shape pultruded FRP beams to widen the use of these profiles with more confidence in broader structural applications.
1. Introduction
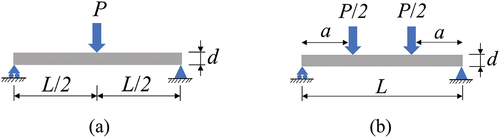
Pultruded Fibre-reinforced Polymers (FRP) profiles are growingly utilised in construction and infrastructure sectors due to their excellent corrosion resistance, cost-effective manufacturing process, and high strength-to-weight ratio (Aldoumani et al., Citation2016; Onyelowe et al., Citation2022). I-shape profiles represent more than 40.6% of the used pultruded FRP sections in civil structural applications, such as beams and panels in buildings and girders and decks in marine structures and bridges (Alhawamdeh, Alajarmeh, Aravinthan, Shelley, Schubel, Mohammed, et al., Citation2021). These profiles are prone to structural instability failure modes under compressive stresses, such as Euler buckling, lateral-torsional buckling, local buckling, and web crippling due to their application-driven slenderness and low anisotropic stiffness (F. Ascione et al., Citation2015, Citation2016). The bending behaviour, structural stability, and failure mode of pultruded FRP beams depend on the load arrangement, boundary conditions, and profile dimensions, all of which are significant parameters when setting up the test configuration (Alhawamdeh, Alajarmeh, Aravinthan, Shelley, Schubel, Mohammad, et al., Citation2021). The two most common bending test setups documented in the literature are the three-point and four-point bending shown in Figure . The span-to-depth ratio (L/d) in three-point bending and the shear span-to-depth ratio (a/d) along with the L/d ratio in four-point bending are key parameters responsible for configuring these test setups and controlling the results (Muttashar et al., Citation2016). In four-point bending, the shear span (a) is defined as the clear distance between the supporting point and the adjacent loading point at which the shear force remains constant (Xin et al., Citation2017).
Figure 1. Typical bending test setups: (a) three-point bending and (b) four-point bending.
However, there is still a lack of knowledge and standardised guidelines for the design of bending test setups on the structural-size level of these profiles. It is important to accurately characterise the structural behaviour and failure modes of these beams using the appropriate test setups that match the loading and supporting conditions and dimensions of the targeted applications in construction. Investigating the effect of the bending test setup parameters (L/d and a/d ratios) is essential to develop standardised provisions and guidelines for test setup configurations for these profiles on the structural-size level. This will widen the use of these profiles in broader civil structural applications with more confidence in their characteristic properties resulting from these tests.
The available standards and guidelines on bending test setup details present recommendations and configurations to characterise the flexural behaviour of FRP composites for specific applications and limited failure modes (ASTM D7249/D7249M–20, Citation2020; ASTM D8019–15, Citation2016). The ASTM D8019–15 (ASTM D8019–15, Citation2016) describes the test setup used to estimate the flexural strength of FRP cross-arms using three-point bending. The considered failure mode is local buckling of the compression flange with a span-to-depth ratio (L/d) > 16.0. The ASTM D7249/D7249M–20 (ASTM D7249/D7249M–20, Citation2020) reports the test setup used to assess the flexural strength of sandwich FRP beams and panels using four-point bending with a span-to-depth ratio (L/d) > 20.0. Following these standards, more studies and guidelines are needed to cover all the possible structural instability failure modes of structural-size profiles and report the effect of the associated test setup parameters on these failure modes comprehensively.
Many studies investigated the structural behaviour of pultruded FRP profiles subjected to three-point (Borowicz & Bank, Citation2011; Laudiero et al., Citation2013; Madenci et al., Citation2020) or four-point (Alhayek et al., Citation2022; Guades et al., Citation2014; Singh & Chawla, Citation2018) bending. However, only few studies examined the effect of the test setup parameters (L/d and a/d ratios) on the structural instability failure modes. The effect of the shear span-to-depth ratio was studied experimentally for hollow box pultruded FRP beams subjected to four-point bending (Muttashar et al., Citation2016). The investigated range was 1.2 ≤ a/d ≤8.0 with local buckling of the top flange and crushing of the thick web (web height/web thickness = 14.2) as the two dominant failure modes. The flexural behaviour of the experimentally tested beams was significantly affected by the shear span-to-depth ratio as increasing the a/d ratio (a/d > 7.5) increased the bending stress contribution by 85% while decreasing the a/d ratio (a/d < 5.0) increased the shear stress contribution by 50%. The flexural and torsional moduli of I-shape pultruded FRP profiles subjected to three-point and four-point bending were investigated experimentally for a range of span-to-depth ratios (Roberts & Al-Ubaidi, Citation2002). Three different cross-sectional sizes were studied with 7.5 ≤ L/d ≤30.0 for three-point bending and 19.0 ≤ L/d ≤30.0 and 3.2 ≤ a/d ≤7.5 for four-point bending. A close correlation was found between the flexural and torsional rigidities obtained from these test setups but the associated failure modes were not studied. The flexural behaviour of pultruded FRP sheet piles subjected to four-point bending was investigated for two different span-to-depth ratios of 8.0 and 17.0 (Wang et al., Citation2016). The influence of the L/d ratio was insignificant on the load capacity because of the localised debonding failure between the joined pairs. However, the deformation increased significantly for long-span specimens. The flexural capacity of hollow square and rectangular GFRP profiles was studied under three-point bending for various span-to-depth ratios (Estep et al., Citation2016). An analytical model was proposed to predict the failure load based on the L/d ratio. The accuracy of the model varied from high when 10.0 < L/d ≤42.0 with a bending failure in the tension flange to low when 4.0 ≤ L/d < 6.0 with a local buckling in the compression flange. Most of the available literature discussed the effect of L/d and a/d ratios on the test setups without covering the entire design space of these parameters. Moreover, the effect of these parameters on all the structural instability failure modes of I-shape FRP beams subjected to three-point and four-point bending was not reported holistically.
Conducting a parametric study to investigate the entire design space of the test setup parameters and their effect on the failure modes is not feasible using experimental or analytical approaches due to the limited experimental resources and unavailable closed-form equations, respectively. Consequently, a literature review was undertaken to explore the suitable numerical modelling approach for investigating the bending test setup parameters and their effect on the structural instability of I-shape pultruded FRP profiles. Numerical approaches such as the Finite Strip Method (FSM), Generalised Beam Theory (GBT), and Finite Element Method (FEM) are generally preferred (Kreja, Citation2011; Trang et al., Citation2022). FEM represents the suitable approach to simulate the bending test setups of I-shape pultruded FRP beams due to its superior flexibility and accuracy in modelling complex failure modes and versatile boundary and loading conditions (Alhawamdeh, Alajarmeh, Aravinthan, Shelley, Schubel, Mohammed, et al., Citation2021; Koloor SS et al., Citation2018; Lamberti et al., Citation2022).
However, commercial FEM software programs do not provide one analysis type convenient for modelling all types of structural instabilities (Xu et al., Citation2013). Alternatively, specific analysis methods are usually preferred depending on the targeted failure mode whether it is localised across the section or extended along the profile length (Sayyad & Ghugal, Citation2017). Moreover, the mechanism of handling the geometric imperfections during the FE analysis significantly affects the resulting buckling behaviour of the pultruded profile (F. Ascione, Citation2014). For example, the modified Riks (Arc-length) method is preferred for global instabilities such as global buckling and lateral-torsional buckling due to its load-incremental approach. Nevertheless, this method faces difficulties when simulating local instabilities like local buckling and web crippling because such sectional instabilities require the bifurcation point (i.e. buckling point) to be predefined by the user (Alhawamdeh, Alajarmeh, Aravinthan, Shelley, Schubel, Kemp, et al., Citation2021). The explicit dynamic analysis and Newton method (dynamic implicit analysis) are more suitable to track local instabilities such as local buckling and web crippling. However, the explicit dynamic analysis comprises some numerical parameters (e.g. artificial damping and mass scaling coefficients) that should be estimated correctly by experience to ensure accurate results (Hale & Ng, Citation2021). In addition, the dynamic implicit analysis requires the geometric imperfection history to locate the bifurcation point (L. Ascione et al., Citation2015). These limitations on different analysis methods raise the need for a comprehensive numerical approach capable of capturing both the global and local structural instabilities along the profile length and across the profile section. This numerical modelling approach is developed in this research based on the FEM with a variable step size algorithm.
This study aims to investigate the structural instability failure modes of I-shape pultruded FRP profiles subjected to three-point and four-point bending. A novel modelling approach was established to capture lateral-torsional buckling, local buckling, and web crippling using artificially imposed variable geometric imperfection functions guided by scaled shape functions capturing the longitudinal and sectional deformations and instabilities. The validated modelling approach was used to perform parametric studies on the bending test setup parameters, namely the span-to-depth ratio L/d and shear span-to-depth ratio a/d. The effect of these parameters on the structural instability failure modes was investigated and quantified. The thresholds between the instability failure modes were characterised graphically and statistically using failure maps and regression analysis. In addition, the interactions between the anisotropy ratio () and test setup parameters were studied. These parametric studies aimed to introduce the appropriate test setup configurations to match the structural stability demands of real applications in construction. These parametric studies provide guidelines and recommendations for accurate testing and characterisation of the bending behaviour and structural instability failure of I-shape pultruded FRP beams. This will widen the use of these profiles with more confidence in broader civil structural applications.
2. Numerical modelling approach
2.1. Material model and mesh
The material model including the elastic behaviour and the progressive failure behaviour was assembled using Abaqus/CAE 2019. The elastic behaviour of the FRP profile was simulated using elastic lamina material definition since it is compatible with laminated shells defined by two-dimensional plane stress formulation (Simulia, Citation2019). The input stiffness properties of the lamina consisted of the modulus of elasticity in the longitudinal direction (E1), the modulus of elasticity in the transverse direction (E2), the in-plane shear modulus of elasticity (G12), the out-of-plane shear modulus of elasticity (G23), and the in-plane Poisson's ratio (). Since unidirectional laminae are considered transversely isotropic materials (Barbero, Citation2017), the value of the out-of-plane shear modulus (G13) and (G12) were assumed to be equal.
The progressive failure was simulated by a nonlinear analysis of geometry implementing the large displacement formulation and the Newton incremental method in the standard solver (Simulia, Citation2019) to capture all nonlinearities from the material failure, boundary conditions, and geometry. The Hashin damage model (Simulia, Citation2019) was used to define the progressive failure of fibres and matrix (resin). This model considers four failure modes: fibre failure in tension (rupture) and compression (buckling and kinking) and matrix failure in tension (cracking under transverse tension and shearing) and compression (crushing under transverse compression and shearing), as shown in Table . Each failure mode consists of a damage initiation criterion and a damage evolution (progressive failure) criterion.
Table 1. Failure modes and associated damage formulae utilised in the Hashin damage model Simulia, (Citation2019)
The strength limits controlling the damage initiation criteria comprise the longitudinal compressive () and tensile (
) strengths, the transverse compressive (
) and tensile (
) strengths, and the shear strengths in the longitudinal (
) and transverse (
) directions. When the damage initiation criterion is met for a specific failure mode (the related factor reaches a value of 1.0), the damage evolution criterion is triggered for the related failure mode. The damage evolution algorithm calculates the area under the stress-displacement curve of the element, which is equivalent to the energy release. The fracture energy components of the longitudinal compressive (
) and tensile (
) fracture energies and the transverse compressive (
) and tensile (
) fracture energies determine the ultimate energy required to cause the collapse of the element.
The damage stabilisation scheme in Abaqus/CAE 2019 was applied along with the Hashin damage model to convert the tangent stiffness matrix into a positive equivalent for sufficient time steps to prevent analysis difficulties, divergence, and errors accompanying the modelling of material failure. The damage evolution algorithms are damped by relaxing the time in the vicious system through a coefficient of viscosity introduced by the solver (Simulia, Citation2019).
The FRP profile was simulated using the in-plane general-purpose quadrilateral (8-node) continuum shell (SC8R) element. This element is rendered as a three-dimensional geometry allowing for a more accurate through-thickness seeding, modification, and analysis compared to conventional shells (Simulia, Citation2019). Thus, it represents one of the best options to model laminated shells. The hourglass modes (i.e. inaccurate deformation of the mesh caused by artificial energy generated in the structure) were mitigated and the kinematic response was accurately captured by increasing the number of elements through the thickness. The optimal element size to achieve accurate and converged results with the available computational resources was determined through a mesh sensitivity study. An element size with an edge length of 4 mm was selected along with four elements through the thickness.
2.2. Continuously variable step size for structural instability
Generally, geometric imperfections are used with multiple roles in FEM applications. One of their applications is to simulate the effect of out-of-straightness and manufacturing imperfections on the structural stability of FRP profiles by introducing the imperfections, measured experimentally or provided by the manufacturer, as initial nodal displacements in the model (Nguyen et al., Citation2015). Geometric imperfections can also be used for pure numerical purposes to assist the FE solver in locating the buckling point (Nguyen et al., Citation2023). Such imperfections are usually extracted as buckling modes from eigenvalue buckling analysis and then used as initial nodal displacements in the first step of a following non-linear buckling analysis to simulate a specific buckling type (Nguyen et al., Citation2013). In these applications, the geometric imperfections are defined and scaled by the user before the analysis to target a specific buckling type. In addition, these imperfections are introduced only once in the first step of non-linear buckling analysis with no further assessment or update during the analysis. Alternatively, the new modelling approach was designed to track the structural instability failure modes of lateral-torsional buckling, local buckling, and web crippling using variable geometric imperfection functions guided by scaled shape functions capturing the longitudinal and sectional deformations and instabilities. The modelling approach overrides the step size of time calculated by the FE solver and replaces it with a Continuously Variable Step Size (CVSS) at the beginning of each step. The CVSS was implemented and automated as a code in the FEM script using Python 3.9.1 programming language due to the compatibility between this language and the Abaqus kernel (i.e. the script interpreter) (Alhawamdeh et al., Citation2022). Abaqus/standard was used as an FE solver to undertake the nonlinear buckling analysis as discussed in the previous section.
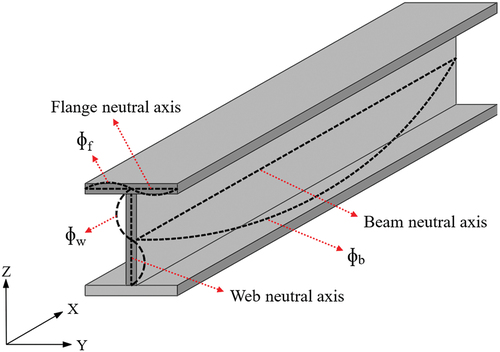
The CVSS is calculated based on an artificially imposed geometric imperfection function ѱ(x,y,z) that considers the effect of the profile dimensions and bending test setup parameters (L/d and a/d ratios). The ѱ(x,y,z) function consists of three shape functions tracking the deformation of the beam across the section and along the span. ɸb(x,y,z), ɸf(x,y,z), and ɸw(x,y,z) represent the shape functions defined to trace the deformation of the beam, flange, and web neutral axes, respectively, as shown in Figure . Each shape function is defined as a path of nodes in the FE model and is assigned to capture a specific failure mode. The ɸb(x,y,z), ɸf(x,y,z), and ɸw(x,y,z) functions are designed to capture the lateral-torsional buckling of the beam, local buckling of the top flange, and web crippling, respectively Appendix A.
Figure 2. Three shape functions capturing the structural instability of the I-shape pultruded FRP beam.
The geometric imperfection function of the FRP profile is represented mathematically as the summation of the shape functions scaled depending on the intensity of their relevant deformations:
where is the geometric imperfection function. ɸb(x,y,z), ɸf(x,y,z), and ɸw(x,y,z) are the shape functions of beam, flange, and web, respectively. ɣb(t), ɣf(t), and ɣw(t) are the shape function weights of the beam, flange, and web, respectively, as functions of the analysis time. These weights are updated from the path of field nodes at the beginning of each step and are calculated as follows:
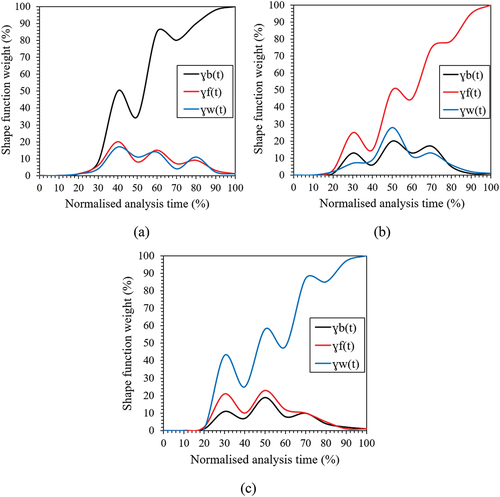
Where δb, δf, and δw represent the normalised displacement of the beam, flange, and web shape functions, respectively. The normalised displacement is obtained by dividing the shape function displacements by the maximum displacement attained by the shape function at time t. This displacement represents a quantitative measure of the deformation intensity of each shape function. Contrary to the default analysis methods available in commercial FEM software, the proposed modelling approach guides the solver to the bifurcation point (i.e. buckling point) using the shape functions and their weights. The default analysis methods are eye-blinded and need the user’s assistance with providing predefined constant geometric imperfections to lead the solver to the accurate failure mode. Conversely, the proposed approach provides an automated tool to compute the variation in the geometric imperfections along the analysis time and update the step size by tracking the deformation of the shape functions and calculating their weights. If lateral-torsional buckling is the dominant failure mode, the normalised displacement of the beam shape function (δb) becomes large compared to the normalised displacements of the flange (δf) and web (δw). Consequently, the weight of the beam shape function (ɣb(t)) increases compared to the weights of the flange (ɣf(t)) and web (ɣw(t)) shape functions. Thus, the geometric imperfection function ѱ(x,y,z) will be updated with a larger out-of-straightness located along the beam length compared to a lower out-of-straightness across the beam section. This will obtain a larger (faster) step size after each step as the solution converges towards the accurate failure mode. The same procedure applies if the local buckling of the flange or web crippling is the dominant failure mode. Figure depicts the typical response of the shape function weights versus the analysis time when each structural instability failure mode (lateral-torsional buckling, local buckling, or web crippling) dominates the solution.
Figure 3. Typical response of shape function weights versus the analysis time: (a) when lateral-torsional buckling is the dominant failure mode, (b) when local buckling is the dominant failure mode, and (c) when web crippling is the dominant failure mode.
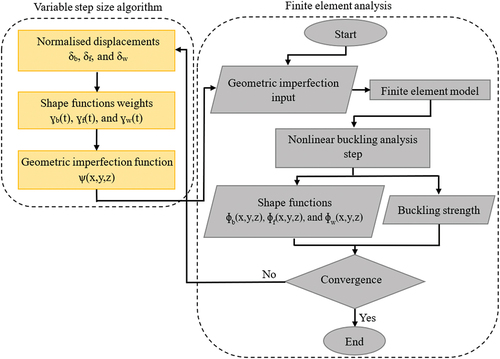
The step size is adjusted after each step based on the updated geometric imperfection function, which guides the solver closer to the buckling point. When the updated geometric imperfection function attains a closer shape to the accurate failure mode, the analysis converges smoothly towards the solution with a high weight of that specific failure mode. Thus, the solver increases the step size to speed up the analysis with high certainty. Conversely, when the analysis diverges slowly from the solution, the weight of the shape functions is decreased. Consequently, the solver decreases the step size to slow down the analysis as the certainty of the results is low. This will enable the solver to accurately locate the convergence trend (i.e. locate the buckling point) benefiting from the small time steps. When the solution convergence is reattained, the weight of the relevant shape function increases again causing the solver to increase the step size again (speed up the analysis). Figure summarises the new modelling approach introduced in this study incorporating the CVSS algorithm and Abaqus finite element analysis. This modelling scheme was combined and automated using Python 3.9.1 programming language because of its compatibility with Abaqus kernel (i.e. script interpreter) (Alhawamdeh et al., Citation2022).
Figure 4. Modelling scheme of variable step size FEM analysis.
This new modelling approach has two main advantages as it (i) efficiently locates the buckling (bifurcation) point by introducing updated geometric imperfections to guide the solver to the correct buckling type depending on the longitudinal and transverse deformations of the beam and (ii) reduces the computational cost (analysis time) by continuously adjusting the step size according to the solution convergence to avoid unnecessary small time steps. The proposed approach can simulate the structural instability failure modes of lateral-torsional buckling, local buckling, and web crippling under different bending test setup configurations. In the following section, three case studies of experimental tests were selected from the literature to verify the validity of the proposed approach.
3. Validation case studies
3.1. Background
Three experimental programs, each one addressing one structural instability failure mode, from published literature were considered as case studies to verify the proposed modelling approach. The first experimental study investigated the lateral-torsional buckling of I-shape pultruded FRP beams and was performed by (Nguyen et al., Citation2014). The second and third experimental studies examined the local buckling and web crippling of these beams and were conducted by (Yang et al., Citation2020) and (Fernandes et al., Citation2015), respectively. Table summarises the dimensions of the specimens and the test setup details of the three validation case studies.
Table 2. Dimensions and test setup details of the validation case studies
The same boundary and loading conditions of the experimental tests were simulated in the FE models. Cylindrical solid parts with three-dimensional geometry, discrete rigid definition, and a radius of 20 mm were used to model the supporting and loading fixtures. For the boundary conditions, all translational degrees of freedom were fixed at the profile ends. Unrestrained rotation was permitted for the rotational degrees of freedom. Regarding the loading condition, a quasi-static loading rate of 10.0 mm/min was applied at the loading points using a vertical downward translational degree of freedom. The boundary and loading conditions were assigned on the cylindrical fixtures and were kinematically connected to the profile using a tie contact definition.
The mechanical properties of the pultruded FRP profiles tested in the case studies were extracted from the relevant references, as shown in Table . EL and ET refer to the longitudinal and transverse elastic moduli, respectively. GLT and denote the in-plane shear modulus and in-plane Poisson’s ratio, respectively. These values were used in the FEM analysis to simulate the structural behaviour of the I-LTB, I-LB, and I-WC I-shape beam specimens subjected to lateral-torsional buckling, local buckling, and web crippling failure modes, respectively. The intended experimental failure modes were guaranteed to be obtained as the same experimental test setup parameters (i.e. L/d and a/d) of the case studies were used in the FE models. All the profiles in these case studies were characterised by a high slenderness ratio of the web (web height/web thickness ≥20.0), which alleviated the shear deformation effects that usually occur in thick cross-sectional elements subjected to transverse loading, such as the web (Correia et al., Citation2011).
Table 3. Characteristic mechanical properties of the I-shape pultruded FRP profiles used in the validation case studies
3.2. Results comparison
The validity of the new modelling approach was assessed by comparing the numerical results against the experimental results in terms of the failure mode and buckling strength. Moreover, the proposed CVSS analysis was compared with the default Abaqus/standard analysis in terms of solution convergence and analysis speed. Figure depicts the experimental failure modes (cited from the aforementioned references) versus the CVSS FEM failure modes for all the considered structural instabilities of lateral-torsional buckling, local buckling of the flange, and web crippling. The failure modes resulted from the new modelling approach matched the experimental failure modes reported in the literature.
Figure 5. Experimental versus CVSS-FEM failure modes of the validation case studies: (a) lateral-torsional buckling of I-LTB (experimental photo cited from Nguyen et al. (Citation2014)), (b) web crippling of I-WC (experimental photo cited from Fernandes et al. (Citation2015)), and (c) local buckling of I-LB (experimental photo cited from Yang et al. (Citation2020)).
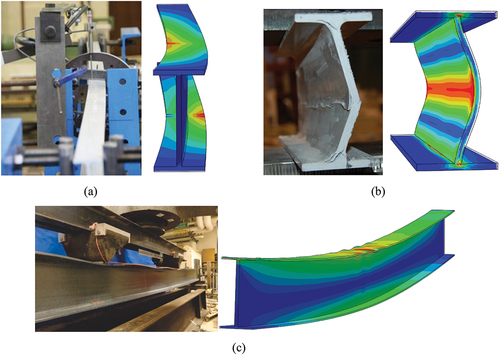
The numerical buckling strength obtained from the CVSS FEM analysis was also compared against the experimental buckling strength extracted from the relevant literature. In addition, the theoretical buckling strength of each failure mode was calculated from the available closed-form equations (Bank, Citation2006) and was compared against the FEM results. Table presents a comparison between these results of the I-shape FRP beam specimens for the same test setup parameters provided in the case studies. The percentile error between the FEM and the experimental and theoretical buckling strengths was 5.95% and 4.04%, respectively, for the specimen dominated by lateral-torsional buckling (I-LTB). Under local buckling failure, the error between the FEM and the experimental and theoretical buckling strengths of specimen I-LB was 6.47% and 4.33%, respectively. The percentile error between the FEM and the experimental and theoretical buckling strengths was 5.39% and 4.49%, respectively, for the I-WC specimen which failed by web crippling. These results emphasised the satisfactory agreement between the proposed modelling approach and the published data and theory.
Table 4. Numerical versus experimental and theoretical buckling strength results of the validation case studies of I-shape FRP beams subjected to bending
The CVSS FEM analysis was compared against the default Abaqus/standard analysis to examine the solution convergence and analysis speed, as shown in Figure . Both methods used the large displacement formulation and the Newton incremental method along with the elastic lamina material definition and Hashin damage model. The only difference between the two methods is the step size calculations at the beginning of each step, as discussed in section 2.2. Unlike the default analysis method, the CVSS analysis continuously examines and updates the step size based on a variable geometric imperfection function guided by scaled shape functions capturing the longitudinal and sectional deformations and instabilities.
Figure 6. Solution convergence of the CVSS analysis against default Abaqus/Standard analysis for the validation case studies.
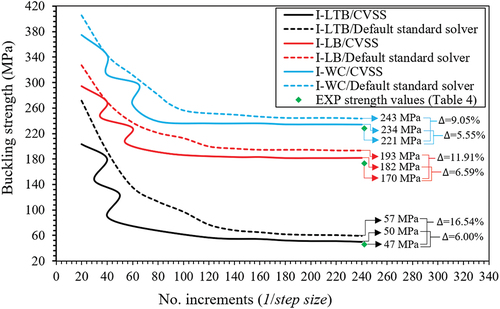
When the number of increments (steps) in the analysis is increased, each step size is decreased resulting in a slow analysis with high computational cost. Conversely, when the number of increments is decreased, each step size is increased resulting in a fast analysis with low computational cost. The CVSS analysis was 1.24, 1.27, and 1.33 faster than the default analysis for the I-LTB, I-LB, and I-WC specimens dominated by lateral-torsional buckling, local buckling, and web crippling, respectively. The web crippling analysis of the I-WC specimen was the fastest followed by the I-LB specimen and then the I-LTB specimen. This was referred to as the effect of the model size (i.e. the number of elements in the model) on the computational efficiency since the size of the I-LTB FEM model was the largest followed by the I-LB and then the I-WC model. In terms of the buckling strength, it is noted that the new modelling approach obtains closer values to the experimental results with lower percentile error compared to the default FE analysis, as presented in Figure . This was referred to as the effect of the CVSS algorithm in simulating the geometric imperfections required for faster and more accurate buckling analysis.
This new modelling approach proved its capability and accuracy as a robust numerical tool that can capture the different structural instability failure modes present in bending tests. It can be used to perform parametric studies on the bending test setup parameters (i.e. span-to-depth ratio L/d and shear span-to-depth ratio a/d). In the following section, comprehensive parametric studies were undertaken on these parameters in order to conclude testing guidelines and recommendations for accurate characterisation of the bending behaviour and structural instability failure of pultruded FRP profiles. Consequently, the reliability of the characteristic properties of these profiles obtained based on the appropriate test setup configurations matching the demands of the intended applications will increase. This will widen the use of these profiles with more confidence in broader civil structural applications. It is worth noting that FRP profiles with variable mechanical properties across the section are out of scope in the following parametric studies. The proposed modelling approach can be applied to such profiles but with minor changes to the composite layup definition in Abaqus (i.e. defining each structural element in the cross-section as an independent part in the model) in order to assign the provided mechanical properties for each part of the cross-section accordingly.
4. Parametric study on the test setup parameters
In this section, the validated modelling approach was used to undertake parametric studies on the bending test setup parameters, namely the span-to-depth ratio L/d and shear span-to-depth ratio a/d. The effect of these parameters on the structural instability failure modes of lateral-torsional buckling, local buckling, and web crippling was investigated and quantified. The threshold (i.e. the inflection point at which the failure mode changes to another one) between the failure modes was characterised graphically and statistically using failure maps and regression analysis, respectively, to establish the relationship between the test setup parameters and the shift of failure mode. In addition, the interaction between the anisotropy of I-shape pultruded FRP profiles and test setup parameters was studied. These parametric studies were aimed to provide testing guidelines and recommendations for accurate characterisation of the bending behaviour and structural instability failure of pultruded FRP profiles.
4.1. Effect of span-to-depth ratio (L/d)
The results of the parametric study on the effect of the L/d ratio on the buckling capacity and failure mode of I-shape pultruded FRP beams were highlighted by generating failure maps. These failure maps are shown in Figures for three-point and four-point bending tests, respectively. The buckling strength of each failure mode was normalised to provide universal representative results applicable to other I-shape profiles with different material strengths and layup properties. The normalised strength () was introduced by dividing the buckling strength
(obtained from a structural-level test) by the ultimate material strength
(obtained from a coupon test):
Figure 7. Failure map showing the effect of span-to-depth ratio on I-shape pultruded FRP profiles subjected to three-point bending with different anisotropy ratios.
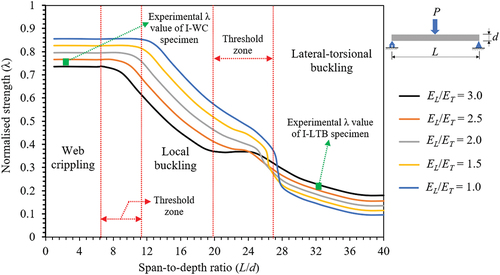
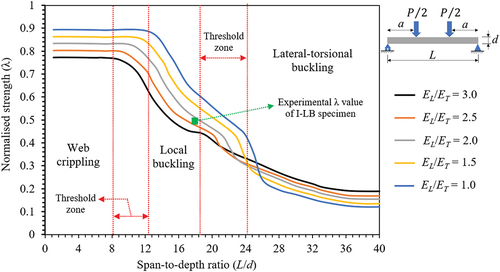
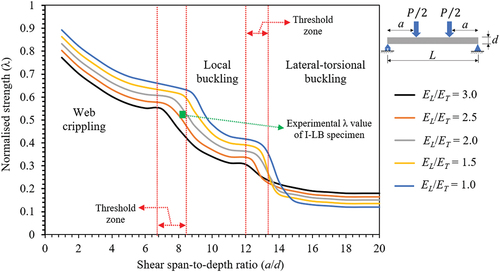
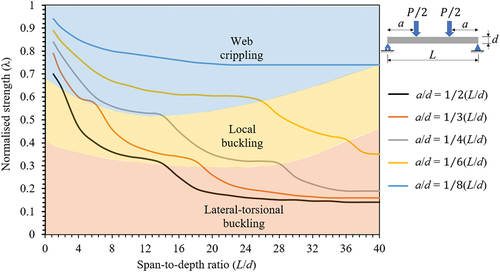
Figure 8. Failure map showing the effect of span-to-depth ratio on I-shape pultruded FRP profiles subjected to four-point bending with different anisotropy ratios ().
The ultimate material strength was considered as the average of the characteristic compressive strength values reported in the three validation case studies (342.0, 296.0, and 318.0 MPa from (Nguyen et al., Citation2014; Yang et al., Citation2020), and (Fernandes et al., Citation2015), respectively), which equals 318.7 MPa. The characteristic compressive strength was selected as the normalisation standard value since it controls the ultimate capacity of FRP laminated beams, which generally collapse by a compressive failure of fibres of the top flange under bending (Alhawamdeh, Alajarmeh, Aravinthan, Shelley, Schubel, Mohammad, et al., Citation2021). The generated failure maps were also checked against the published experimental data of the three validation case studies. These failure maps can be used to estimate the buckling strength and failure mode of I-shape FRP beams with different configurations of the bending test setup parameters without the need for large experimental programs but only a limited number of experiments to verify and correlate the results against these charts. The data presented in Figures were used to statistically estimate the relationship between the span-to-depth ratio and anisotropy ratio and the normalised strength by performing a polynomial regression analysis using the statistical analysis software Minitab 19 (Minitab-19, Citation2017). The resulted regression formulae for three-point and four-point bending tests are presented in Equationequations 6(6)
(6) and Equation7
(7)
(7) , respectively. Each formula consists of three polynomials each one describes a specific failure zone starting from lateral-torsional buckling, local buckling, and web crippling bounded by
,
, and
for three-point bending and
,
, and
for four-point bending (when
), respectively. The coefficient of determination R2 that describes the accuracy of the regression model was 0.93 and 0.91 for three-point and four-point bending, respectively.
Moreover, the threshold boundaries between the failure zones were shifted when comparing the effect of the L/d ratio on three-point versus four-point bending, as shown in Figures . The web crippling extended on a larger failure zone by 1.14 in four-point compared to three-point bending. This was referred to the smaller distance between the loading and supporting points in four-point bending compared to three-point bending for the same L/d ratio, which increased the transverse concentrated load on the web at the cost of decreasing the compressive stress on the top flange. Thus, the web crippling failure was extended over a larger zone and the local buckling failure zone was reduced under four-point bending. This behaviour led to a higher web crippling strength under four-point up to 3.9% compared to three-point bending as the load is distributed over two loading points in four-point bending, which alleviated the concentrated stress, compared to one loading point in three-point bending.
On the contrary, lateral-torsional buckling and local buckling extended on smaller failure zones by 0.91 and 0.88, respectively, in four-point compared to three-point bending. This behaviour in the lateral-torsional buckling zone was referred to the longer unbraced span (i.e. the distance between the supporting point and the nearest loading point) in three-point (that is L/2) compared to four-point bending (that is a) for the same L/d ratio. Consequently, the lateral-torsional buckling capacity was higher under four-point bending by up to 12.6% compared to three-point bending due to the two bracing points (loading points) in four-point bending against only one bracing point at mid-span in three-point bending. The smaller failure zone of local buckling in four-point bending was referred to the higher compressive stress concentrated on the top flange at one loading point in three-point bending compared to the lower compressive stress distributed on two loading points in four-point bending. The concentrated compressive stress on the top flange was higher by up to 7.2% (depending on the anisotropy ratio) under three-point bending, thus, the local buckling strength was higher under four-point bending by up to 7.2%.
Overall, the web crippling capacity was the highest followed by the local buckling capacity and then the lateral-torsional buckling capacity. This was referred to the inverse relationship between the nominal capacity of the beam and the span length. Another factor was the difference in the stress nature and distribution between these failure modes. In web crippling, the stress of concern across the section is bearing stress caused by the transverse compression loading. Conversely, the stress of concern in local buckling and lateral-torsional buckling is bending stress (longitudinal compressive stress on the top flange), with a torsional stress effect added in lateral-torsional buckling.
The effect of the laminate anisotropy ratio (i.e. the longitudinal-to-transverse elastic moduli ratio) was also examined in the failure maps, as shown in Figures . The lateral-torsional buckling strength increased up to 16.1% and 11.9% when the
ratio increased from 1.0 up to 3.0 under three-point and four-point bending, respectively. Conversely, the local buckling and web crippling strengths increased up to 35.3% and 41.7% under three-point bending and up to 30.6% and 46.2% under four-point bending, respectively, when the
ratio decreased from 3.0 up to 1.0. This was referred to as the effect of increasing
on enhancing the longitudinal rigidity of the beam, which reduces the lateral displacement accompanying lateral-torsional buckling of the beam about its neutral axis. Thus, the lateral-torsional buckling strength is increased. On the other hand, increasing
enhances the sectional rigidity of the flange and web, which reduces the sectional displacement accompanying local buckling of the flange or web crippling. Consequently, the local buckling or web crippling strength is increased. In addition, the effect of laminate anisotropy was decreased when the L/d ratio increased to reach the lateral-torsional buckling zone. This was referred to as the dominant influence of the beam span length on the lateral-torsional buckling strength compared to the laminate layup properties.
Moreover, the anisotropy ratio influenced the threshold boundaries between the failure zones. Increasing the ratio decreased the size of web crippling and local buckling failure zones up to 0.68 and 0.74 under three-point bending and up to 0.66 and 0.75 under four-point bending, respectively. This was referred to as the effect of the low value of transverse modulus (when increasing the
ratio) on decreasing the sectional stability and the related buckling capacities. Thus, a beam with a low value of transverse modulus requires a shorter span to attain the same web crippling or local buckling capacity of a beam with a high value of transverse modulus and a longer span. On the contrary, decreasing the
ratio enhanced the sectional stability and increased the web crippling and local buckling capacities. Consequently, the size of the related failure zones increased by up to 1.47 and 1.35 under three-point bending and up to 1.51 and 1.33 under four-point bending, respectively. The beam with higher values of transverse modulus and L/d ratio can attain the same buckling capacity of a beam with lower values of transverse modulus and L/d ratio.
4.2. Effect of shear span-to-depth ratio (a/d) on four-point bending
The effect of the shear span-to-depth ratio (a/d) on the normalised buckling strength () and failure mode of I-shape beams subjected to four-point bending was examined for different anisotropy ratios, as shown in Figure . The statistical analysis software Minitab 19 (Minitab-19, Citation2017) was used to statistically estimate the relationship between the shear span-to-depth ratio and anisotropy ratio and the normalised strength by performing a polynomial regression analysis. The resulted regression formulae for the four-point bending test are presented in Equationequation 8
(8)
(8) . Each formula consists of a second-order polynomial that describes a specific failure zone starting from lateral-torsional buckling, local buckling, and web crippling bounded by
,
, and
, respectively, when
. The coefficient of determination R2 that describes the accuracy of the regression model was 0.89. The anisotropy interaction with the a/d ratio was similar to its interaction with the L/d ratio. Increasing the
ratio enhanced the lateral-torsional buckling resistance and decreased the size of web crippling and local buckling failure zones. In addition, the effect of laminate anisotropy was decreased when the a/d ratio increased to reach the lateral-torsional buckling zone.
Figure 9. Failure map showing the effect of shear span-to-depth ratio on I-shape pultruded FRP profiles subjected to four-point bending with different anisotropy ratios ().
Generally, the loading points move closer to the supporting points when the a/d ratio is decreased, which increases the beam’s tendency to fail by web crippling. On the contrary, when the a/d ratio is increased, the loading points move closer to the mid-span and the four-point bending becomes closer to the three-point bending. Consequently, the beam’s tendency to fail by local buckling or lateral-torsional buckling is increased depending on the L/d ratio.
The interaction between the L/d and a/d ratios was investigated to map the entire design space of the four-point bending test setup, as shown in Figure . This interaction was significant since the failure mode, as a function of the L/d ratio, was changed (shifted) depending on the a/d ratio. EquationEquation 9(9)
(9) describes the threshold boundaries between the different failure modes as resulted from the polynomial regression analysis (R2 = 0.86). Each failure zone is bounded by a second-order polynomial that passes through all the inflection points (i.e. the points at which the slope suddenly changes) of all a/d curves. This design chart (Figure ) can be used to predict the instability failure mode and its related buckling strength
based on the test setup parameters.
Figure 10. Failure map showing the interaction between the span-to-depth ratio and shear span-to-depth ratio of I-shape pultruded FRP profiles subjected to four-point bending.
The failure mode shifts to lateral-torsional buckling () when L/d ≥14.2 and
. Whereas the failure mode transfers to local buckling (
) when 36.5 > L/d ≥7.6 and
. Increasing the a/d ratio reduces the L/d ratio required to attain lateral-torsional buckling or local buckling as the four-point bending transfers closer to three-point bending. The failure mode transfers to web crippling (
) for any L/d ratio with
or when L/d ≤26.4 and
or when L/d ≤14.8 and
. Decreasing the a/d ratio increases the tendency to web crippling failure as it transfers the bending test setup closer to transverse bearing test setup subjected to transverse compression.
5. Conclusions
In this research, a numerical study was undertaken to investigate the structural instability failure modes of lateral-torsional buckling, local buckling, and web crippling of I-shape pultruded FRP profiles under bending. A novel modelling approach was established and verified against published experimental data and against the theory. The modelling approach introduces a Continuously Variable Step Size (CVSS) FE analysis to continuously examines and update the time step size based on artificially imposed variable geometric imperfection functions guided by scaled shape functions capturing the longitudinal and sectional deformations and instabilities. The validated modelling approach was used to perform parametric studies on the bending test setup parameters, namely the span-to-depth ratio L/d and shear span-to-depth ratio a/d. The effect of these parameters on the structural instability failure modes was investigated and quantified. The thresholds (i.e. the inflection points at which the failure mode changes to another one) between the instability failure modes were characterised graphically and statistically using failure maps and regression analysis. In addition, the interactions between the anisotropy ratio () of I-shape pultruded FRP profiles and test setup parameters were studied. These parametric studies aimed to introduce the appropriate test setup configurations to match the structural stability demands of real applications in construction. These parametric studies provide guidelines and recommendations for accurate testing and characterisation of the bending behaviour and structural instability failure of I-shape pultruded FRP beams. The following conclusions were summarised based on this study:
The new modelling approach proved its capability and accuracy as a robust numerical tool that can capture different structural instability failure modes present under bending with low computational cost. The proposed modelling approach was faster by up to 33.0% compared to the default FEM analysis.
When comparing three-point bending versus four-point bending, the lateral-torsional buckling, local buckling, and web crippling failure modes extended on 0.91, 0.88, and 1.14 of the L/d range under four-point bending compared to three-point bending, respectively. The related buckling strengths were higher under four-point bending by up to 12.6%, 7.2%, and 3.9%, respectively, compared to three-point bending for the same L/d ratio.
The web crippling strength is dominated by the a/d ratio while the lateral-torsional buckling and local buckling strengths are both significantly affected by the L/d and a/d ratios. The percentile influence of the L/d and a/d ratios on the normalised buckling strength (
) was estimated to be 61.8% and 38.2%, 53.5% and 46.5%, and 3.1% and 96.9% for the lateral-torsional buckling, local buckling, and web crippling failure modes, respectively.
The laminate anisotropy ratio
The interactions between the L/d and a/d ratios in four-point bending were significant in shifting the failure modes. The failure mode shifts to lateral-torsional buckling (
The findings in this research are limited to I-shape cross-sectional geometry subjected to bending loading. Future studies that consider other cross-sectional shapes and loading conditions are needed in order to develop the current modelling approach to include other structural instability failure modes. Such studies will enhance the understanding and provide comprehensive recommendations and design guidelines for different types of test setups and failure modes.
Acknowledgments
The author gratefully acknowledges the technical support provided by Tafila Technical University to complete this work.
Disclosure statement
No potential conflict of interest was reported by the author(s).
Data availability statement
The data presented in this study are available on request from the corresponding author.
Additional information
Funding
Notes on contributors

Mohammad Alhawamdeh
Mohammad Alhawamdeh is an assistant professor at Tafila Technical University in Jordan. He is a specialised researcher in numerical simulation and optimisation of composites. Alhawamdeh holds Ph.D. (2022) and M.Sc. (2016) in structural engineering. He is a skilled designer using computer-aided software and programming languages, such as Abaqus, Python, and MATLAB. Alhawamdeh is a motivated researcher who interacts with analytical, experimental, and numerical approaches. His field of research includes composites analysis and design, numerical optimisation of composites, and finite element modelling. His work aims to develop advanced composite pultrusion for civil infrastructure applications and enable rapid commercialisation of pultruded profiles in this sector.
References
- Aldoumani, N., Haddad Khodaparast, H., Cameron, I., Friswell, M., Jones, D., Chandrashaker, A., & Sienz, J. (2016). The robustness of carbon fibre members bonded to aluminium connectors in aerial delivery systems. Cogent Engineering, 3(1), 1225879. https://doi.org/10.1080/23311916.2016.1225879
- Alhawamdeh, M., Alajarmeh, O., Aravinthan, T., Shelley, T., Schubel, P., Kemp, M., & Zeng, X. (2021). Modelling hollow pultruded FRP profiles under axial compression: Local buckling and progressive failure. Composite Structures, 262, 113650. https://doi.org/10.1016/j.compstruct.2021.113650
- Alhawamdeh, M., Alajarmeh, O., Aravinthan, T., Shelley, T., Schubel, P., Mohammad, A., & Zeng, X. (2021). Modelling flexural performance of hollow pultruded FRP profiles. Composite Structures, 276, 114553. https://doi.org/10.1016/j.compstruct.2021.114553
- Alhawamdeh, M., Alajarmeh, O., Aravinthan, T., Shelley, T., Schubel, P., Mohammed, A., & Zeng, X. (2021). Review on local buckling of hollow box FRP profiles in civil structural applications. Polymers, 13(23), 4159. https://doi.org/10.3390/polym13234159
- Alhawamdeh, M., Alajarmeh, O., Aravinthan, T., Shelley, T., Schubel, P., Mohammed, A., & Zeng, X. (2022). Design optimisation of hollow box pultruded FRP profiles using mixed integer constrained Genetic algorithm. Composite Structures, 302, 116247. https://doi.org/10.1016/j.compstruct.2022.116247
- Alhayek, A., Syamsir, A., Supian, A. B. M., Usman, F., Asyraf, M. R. M., & Atiqah, M. A. (2022). Flexural creep behaviour of pultruded GFRP composites cross-arm: A comparative study on the effects of stacking sequence. Polymers, 14(7), 1330. https://doi.org/10.3390/polym14071330
- Ascione, F. (2014). Influence of initial geometric imperfections in the lateral buckling problem of thin walled pultruded GFRP I-profiles. Composite Structures, 112, 85–22. https://doi.org/10.1016/j.compstruct.2014.02.002
- Ascione, L., Berardi, V. P., Giordano, A., & Spadea, S. (2015). Pre-buckling imperfection sensitivity of pultruded FRP profiles. Composites Part B: Engineering, 72, 206–212. https://doi.org/10.1016/j.compositesb.2014.12.014
- Ascione, F., Feo, L., Lamberti, M., Minghini, F., & Tullini, N. (2016). A closed-form equation for the local buckling moment of pultruded FRP I-beams in major-axis bending. Composites Part B Engineering, 97, 292–299. https://doi.org/10.1016/j.compositesb.2016.04.069
- Ascione, F., Lamberti, M., & Razaqpur, G. (2015). Modifications of standard GFRP sections shape and proportions for improved stiffness and lateral-torsional stability. Composite Structures, 132, 265–289. https://doi.org/10.1016/j.compstruct.2015.05.005
- ASTM D7249/D7249M-20. (2020). Standard test method for facesheet properties of sandwich constructions by long beam flexure. American Society for Testing and Materials, 15(3), 10. https://doi.org/10.1520/D7249_D7249M-20
- ASTM D8019-15. (2016). Standard test methods for determining the full section flexural modulus and bending strength of fiber reinforced polymer crossarms assembled with center mount brackets. American Society for Testing and Materials, 08(3), 6. https://doi.org/10.1520/D8019-15
- Bank, L. C. (2006). Composites for construction: Structural design with FRP materials. John Wiley & Sons. https://doi.org/10.1002/9780470121429
- Barbero, E. J. (2017). Introduction to composite materials design. CRC Press. https://doi.org/10.1201/9781315296494
- Borowicz, D. T., & Bank, L. C. (2011). Behavior of pultruded fiber-reinforced polymer beams subjected to concentrated loads in the plane of the web. Journal of Composites for Construction, 15(2), 229–238. https://doi.org/10.1061/(ASCE)CC.1943-5614.0000082
- Correia, J. R., Branco, F. A., Silva, N. M. F., Camotim, D., & Silvestre, N. (2011). First-order, buckling and post-buckling behaviour of GFRP pultruded beams. Part 1: Experimental study. Computers & Structures, 89(21–22), 2052–2064. https://doi.org/10.1016/j.compstruc.2011.07.005
- Estep, D. D., GangaRao, H. V. S., Dittenber, D. B., & Qureshi, M. A. (2016). Response of pultruded glass composite box beams under bending and shear. Composites Part B: Engineering, 88, 150–161. https://doi.org/10.1016/j.compositesb.2015.11.008
- Fernandes, L. A., Gonilha, J., Correia, J. R., Silvestre, N., & Nunes, F. (2015). Web-crippling of GFRP pultruded profiles. Part 1: Experimental study. Composite Structures, 120, 565–577. https://doi.org/10.1016/j.compstruct.2014.09.027
- Guades, E., Aravinthan, T., & Islam, M. M. (2014). Characterisation of the mechanical properties of pultruded fibre-reinforced polymer tube. Materials & Design, 63, 305–315. https://doi.org/10.1016/j.matdes.2014.06.018
- Hale, P., & Ng, E.-G. (2021). 3D finite element model on drilling of CFRP with numerical optimization and experimental validation. Materials, 14(5), 1161. https://doi.org/10.3390/ma14051161
- Koloor SS, R., Khosravani, M. R., Hamzah, R. I. R., & Tamin, M. N. (2018). FE model-based construction and progressive damage processes of FRP composite laminates with different manufacturing processes. International Journal of Mechanical Sciences, 141, 223–235. https://doi.org/10.1016/j.ijmecsci.2018.03.028
- Kreja, I. (2011). A literature review on computational models for laminated composite and sandwich panels. Open Engineering, 1(1), 59–80. https://doi.org/10.2478/s13531-011-0005-x
- Lamberti, M., Maurel-Pantel, A., Lebon, F., & Ascione, F. (2022). Cyclic behaviour modelling of GFRP adhesive connections by an imperfect soft interface model with damage evolution. Composite Structures, 279, 114741. https://doi.org/10.1016/j.compstruct.2021.114741
- Laudiero, F., Minghini, F., & Tullini, N. (2013). Postbuckling failure analysis of pultruded FRP beams under uniform bending. Composites Part B: Engineering, 54, 431–438. https://doi.org/10.1016/j.compositesb.2013.06.009
- Madenci, E., Özkılıç, Y. O., & Gemi, L. (2020). Experimental and theoretical investigation on flexure performance of pultruded GFRP composite beams with damage analyses. Composite Structures, 242, 112162. https://doi.org/10.1016/j.compstruct.2020.112162
- Minitab-19. (2017) . Minitab reference manual: Statistical software. Minitab Inc. State College, PA.
- Muttashar, M., Karunasena, W., Manalo, A., & Lokuge, W. (2016). Behaviour of hollow pultruded GFRP square beams with different shear span-to-depth ratios. Journal of Composite Materials, 50(21), 2925–2940. https://doi.org/10.1177/0021998315614993
- Nguyen, T. T., Chan, T. M., & Mottram, J. T. (2013). Influence of boundary conditions and geometric imperfections on lateral–torsional buckling resistance of a pultruded FRP I-beam by FEA. Composite Structures, 100, 233–242. https://doi.org/10.1016/j.compstruct.2012.12.023
- Nguyen, T. T., Chan, T. M., & Mottram, J. T. (2014). Lateral-torsional buckling resistance by testing for pultruded FRP beams under different loading and displacement boundary conditions. Composites Part B: Engineering, 60, 306–318. https://doi.org/10.1016/j.compositesb.2013.12.025
- Nguyen, T. T., Chan, T. M., & Mottram, J. T. (2015). Lateral–torsional buckling design for pultruded FRP beams. Composite Structures, 133, 782–793. https://doi.org/10.1016/j.compstruct.2015.07.079
- Nguyen, T. T., Selvaraj, S., Chan, T.-M., & Mottram, J. T. (2023). Influence of combined imperfections on lateral-torsional buckling behaviour of pultruded FRP beams. Composite Structures, 304, 116385. https://doi.org/10.1016/j.compstruct.2022.116385
- Onyelowe, K. C., Ebid, A. M., Mahdi, H. A., Soleymani, A., Jayabalan, J., Jahangir, H., Samui, P., & Singh, R. P. (2022). Modeling the confined compressive strength of CFRP-jacketed noncircular concrete columns using artificial intelligence techniques. Cogent Engineering, 9(1), 2122156. https://doi.org/10.1080/23311916.2022.2122156
- Roberts, T. M., & Al-Ubaidi, H. (2002). Flexural and torsional properties of pultruded fiber reinforced plastic I-Profiles. Journal of Composites for Construction, 6(1), 28–34. https://doi.org/10.1061/(ASCE)1090-0268(2002)6:1(28)
- Sayyad, A. S., & Ghugal, Y. M. (2017). Bending, buckling and free vibration of laminated composite and sandwich beams: A critical review of literature. Composite Structures, 171, 486–504. https://doi.org/10.1016/j.compstruct.2017.03.053
- Simulia, D. S. (2019). Abaqus 2019 analysis user’s guide. Dassault Syst Provid RI.
- Singh, S. B., & Chawla, H. (2018). An investigation of material characterization of pultruded FRP H- and I-beams. Mechanics of Advanced Materials and Structures, 25(2), 124–142. https://doi.org/10.1080/15376494.2016.1250021
- Trang, T., Pham, T., Hu, Y., Li, W., & Lin, S. (2022). A quick stress calculation method for flexspline in harmonic actuators based on the finite element method. Cogent Engineering, 9(1), 2138123. https://doi.org/10.1080/23311916.2022.2138123
- Wang, J., Liu, W., Liang, R., GangaRao, H., & Wan, L. (2016). Analytical and experimental study on flexural behavior of pultruded fibre reinforced polymer sheet piles. Journal of Composite Materials, 50(24), 3415–3429. https://doi.org/10.1177/0021998315621369
- Xin, H., Mosallam, A., Liu, Y., Wang, C., & Zhang, Y. (2017). Analytical and experimental evaluation of flexural behavior of FRP pultruded composite profiles for bridge deck structural design. Construction and Building Materials, 150, 123–149. https://doi.org/10.1016/j.conbuildmat.2017.05.212
- Xu, J., Zhao, Q., & Qiao, P. (2013). A critical review on buckling and post-buckling analysis of composite structures. Frontiers in Aerospace Engineering, 2(3), 157–168.
- Yang, J.-Q., Liu, T., & Feng, P. (2020). Enhancing flange local buckling strength of pultruded GFRP open-section beams. Composite Structures, 244, 112313. https://doi.org/10.1016/j.compstruct.2020.112313
Appendix A.
List of notations
ѱ: geometric imperfection function of the profile (mm)
ɸb, f, w: shape function of the beam, flange, or web, respectively (mm)
ɣb, f, w: shape function weight of the beam, flange, or web, respectively (%)
δb, f, w: normalised displacement of the beam, flange, or web, respectively
: normalised buckling strength
: in-plane Poisson’s ratio of the profile
a/d: shear span-to-depth ratio of the beam
d: cross-sectional height of the beam (mm)
EL: longitudinal elastic modulus of the profile (MPa)
ET: transverse elastic modulus of the profile (MPa)
GLT: in-plane shear modulus of the profile (MPa)
L/d: span-to-depth ratio of the beam
L: span length of the beam (mm)