
Abstract
Traditional value stream mapping (VSM) has played substantial role in reducing lean wastes in the manufacturing sector overall as well as specifically within automotive companies. However, it provides only a static view of linear production systems with limited process details. This research is conducted in the case of leather industry. The case study is challenged with work -in- progress inventory, unnecessary processes, long waiting time, and long lead time. Therefore, the purpose of this research is to address literature gaps and challenges faced by a case leather company and enhance operational efficiency by combining VSM with discrete event simulation. Product matrix analysis is used to categorize leather goods into product families and select a representative product. Data collection involves direct observation (Gemba-walk) and report reviews. Numerical results from the enhanced current state VSM (ECSVSM) quantify value-added time, non-value-added time, value-added ratio, Takt Time, and total production lead time as 2198.24 s, 14.59 d, 0.54%, 230.1 s, and 14.67 d, respectively. This ECSVSM data is then applied to develop a simulation model of the As-Is system. Based on findings from the ECSVSM and As-Is simulation, shop floor wastes are identified. Alternative scenarios are proposed to mitigate these wastes, with one scenario selected along with additional proposals involving 5S, supermarkets, and layout adjustments. A future state VSM incorporates these solutions. Results demonstrate major improvements, including enhanced operational efficiency up 8.16%, and reductions in non-value-added time by 42.9%, lead time by 42.72%, alongside increased value-added ratio by 55.56% and lowered key waste categories.
Reviewing Editor:
1. Introduction
Currently, the Ethiopian manufacturing industry is facing challenges to remain competitive in today’s dynamic market situation. Enhancing operational efficiency is one strategy that assists this industry to be sufficiently competent in the market. The operational efficiency of manufacturing industries is measured in terms of parameters such as cycle time, inventory level, takt time and manufacturing lead-time.
Value stream mapping (VSM) is a prominent tool for enhancing operation efficiency in the manufacturing industry. It helps to eliminate industrial waste, which hinders the operational efficiency of this industry, through in-depth visualization of the entire production process of the industry. According to Rother and Shook (Citation1999) and Venkataraman et al. (Citation2014), VSM is a pencil and paper tool that is used to envisage the flow of material and information throughout the value stream, and identify sources of wastes and appropriate ways for improvement.
Several scholars (Lacerda et al., Citation2016; Patil et al., Citation2021; Saravanan et al., Citation2018; Singh & Sharma, Citation2009; Sophian et al., Citation2022; Suhardi et al., Citation2020; Venkataraman et al., Citation2014; Yuvamitra et al., Citation2017) have used traditional (classical) VSM as a tool to identify and reduce wastes of manufacturing industries, and thereby improve their operations efficiency. However, this tool is not effective in reducing lean wastes, thereby enhancing the operational efficiency of the production process with complex (multiple) production processes (Braglia et al., Citation2009). Moreover, the tool does not explore the dynamic behavior (process variability) of the production system over time (Atieh et al., Citation2015; Aziz et al., Citation2017; Dinis-Carvalho et al., Citation2014; Luz et al., Citation2021, Citation2022; Rother & Shook, Citation1999). Likewise, it is constructed by taking snapshots of the production processes through direct observation along the flow and recording what happens on the floor. Thus, the level of detail provided by this tool is limited (Braglia et al., Citation2009). Hence, to address such problems, traditional VSM needs to be enhanced using additional tools, such as simulation, in the production system (Atieh et al., Citation2015; Braglia et al., Citation2006; Stadnicka & Litwin, Citation2019).
Few scholars have applied the simulation approach as an additional tool to enhance the level of detail and consider process variability during the shop floor mapping of production systems. For instance, (Alvandi et al., Citation2016; Andrade et al., Citation2016; Aziz et al., Citation2017; Bait et al., Citation2020; Schmidtke et al., Citation2014; Stadnicka & Litwin, Citation2019) used this approach to incorporate process uncertainty and augment details in the mapping process. However, all these scholars (except Alvandi et al. (Citation2016) and Bait et al. (Citation2020), who attempted to use both time and energy data) are limited to enhancing classical VSM through time data. In addition, the impact of inventory levels over time on lean parameters, such as waiting time, throughput, and TPLT, was not incorporated in their studies. Moreover, these scholars have focused on the application of enhancing classical VSM in manufacturing industries in general, and automotive industries in particular. Little attention has been given to its application in the leather industry, and this problem is acute in the Ethiopian leather industry. Hence, to the best of the researchers’ knowledge, none of the prior studies have attempted to enhance the level of details of classical VSM, together with identifying improvement scenarios and their dynamic behavior over time in the leather industry. Thus, the objective of this research is to fill these knowledge gaps and thereby enhance the operational efficiency of the leather industry through a hybrid of value stream mapping and discrete event simulation.
This study contributes to the body of knowledge in four ways. First, it enhances the classical VSM via three types of data (time, quality and energy). In previous studies, most scholars have attempted to augment classical VSM using time data (Braglia et al., Citation2009; Dinis-Carvalho et al., Citation2014; Lacerda et al., Citation2016; Suhardi et al., Citation2020; Patil et al., Citation2021), and a few other scholars (Bait et al., Citation2020; Seth et al., Citation2017) have attempted to enhance it using both time and energy data. Hence, the enhanced map is nomenclated as Time, Quality and Energy VSM (authors’ perspective). Second, it developed a conceptual framework, as the methodological approach of this research, which was used to integrate enhanced current state VSM with discrete event simulation (DES). Third, it validates the application of the extended VSM to the leather industry. Fourth, it considers process variability during the mapping of the shop floor production system and investigates the dynamic behavior of inventory levels on waiting time, throughput, and TPLT in a synchronized manner.
The remainder of this paper is organized as follows: Section 2 presents the literature review; Section 3 presents case company problems and research methodology; Section 4 deals with the results of the study; Section 5 presents the discussion; Section 6 presents research implications; Section 7 concludes the findings of the research and the last section present the limitations and future research agendas.
2. Literature review
In this section, state – of – the - art literature related to this research topic was reviewed.
2.1. Concept of lean manufacturing
The concept of lean manufacturing was developed after the Second World War in the Toyota Production System. This concept originated from two Japanese Engineers, Taiichi Ohno and Shigeo Shingo, who competed with the mass production system of the USA (Kaswan et al., Citation2019). Lean manufacturing refers to a manufacturing paradigm that aims to differentiate between the value-added and non-value- added activities of a manufacturing system with continuous improvement, ultimately reducing and eliminating waste and maximizing productivity (Bait et al., Citation2020; Seth et al., Citation2017). In a production system, activities that utilize resources without adding any value to a product, and thus, customers are unwilling to pay are defined as waste. Accordingly, over-production, transportation, inventory, waiting, motion, over-processing, defects, and unused creativity (skill) are categorized as lean manufacturing wastes (Gupta & Kundra, Citation2012).
2.2. Lean manufacturing (LM) tools
Many LM tools have been used in industries not only to reduce waste, but also to eliminate it. According to numerous scholars (Abdulmalek & Rajgopal, Citation2007; Gupta & Kundra, Citation2012; Kaswan et al., Citation2019; Oliveira et al., Citation2017; Solding & Gullander, Citation2009), the widely mentioned LM tools in the literature with the goal of assisting organizations to identify and eliminate wastes continuously, and ultimately enhance operation efficiency with reduced production costs are 5S, Just-in-time (JIT), Kanban, Poka–Yoke (error-proofing), Value-Stream Mapping (VSM), Heijunka (Production Smoothing), Kaizen, Single-Minute Exchange of Die (SMED), Total Quality Management (TQM) and Total Productive Maintenance (TPM).
Thus, of the above LM tools, VSM was used in this study to identify and reduce the waste of the case company because of the following unique features:
It provides insight into the flow of materials and information in the entire process (value streams) graphically, which fosters the modeling of the production process. Thus, value - added and non-value - added activities are visualized, and improvements are triggered by highlighting waste (Seth et al., Citation2017).
It integrates production planning and demand forecasting with production scheduling and shop floor control (Seth et al., Citation2017).
Flexibility and adaptability for different application areas. It is applicable to any business venture, such as manufacturing, service, and construction (Aziz et al., Citation2017; Seth et al., Citation2017).
It provides relevant information related to the production time and inventory levels of the entire production process (Braglia et al., Citation2009).
It provides a user-friendly language to discuss the waste, throughput rate, bottlenecks, cycle time and tack time of the entire production process.
2.3. Applications of LM
Based on the evidence of the extant literature, the applications of LM in the manufacturing industry were reviewed in detail. Accordingly, 25.45%, 20%, 14.54%, 12.73%,12.73%, 9.1%, and 5.45% of the reviewed papers were done in the case of the automotive industry, Basic and fabricated metal industry, textile and apparel industry, food and beverage industry, other industries (such as electrical and electronic, glass, tire industries), plastics industry, and leather and leather product industry, respectively. These results show that the application of LM is predominantly validated in the automotive, basic and fabricated metal, and textile and apparel industries. Moreover, it depicts that the application of LM in other manufacturing industries, such as the textile and apparel industry, food and beverage industry, plastics industry, and leather and leather product industry, is promising as well. However, as evidenced by these results, less attention has been given to explore the application of LM in the leather and leather product industry despite its potential benefits, as evidenced by the literature analysis. While Alaya (Citation2016) and Sudhakara et al. (Citation2020) asserted LM can be applied across industries, the results suggest further research is warranted in some areas like leather. The summarized LM applications in the literature are presented in .
Table 1. Overview of LM applications in literature in the context of manufacturing industry.
2.4. LM Implementation
The effectiveness of lean tools for LM implementation in the manufacturing industry has been studied by many scholars. For instance, Zahraee (Citation2016) conducted an empirical study aimed at identifying effective practices and tools of LM implementation in the manufacturing industry. The findings of his study indicated that processes and equipment, planning and control, supplier relationship, human resources and customer relations are significant practices for LM implementation in the Iranian manufacturing industry. The study also revealed that Kaizen, 5S, setup time reduction, cellular manufacturing, continuous flow, equipment layout, product design simplicity and error proof equipment are crucial to implement LM in the manufacturing industry. Katsigiannis et al. (Citation2024) investigated the effect of lean tools on LM implementation in the manufacturing industry. The results of their study showed that JIT and Heijunka provided LM implementation with a significant positive impact. Correia et al. (Citation2018) presented lean line balancing as an LM implementation tool to reduce the bottleneck of manual assembly line. The findings of their study demonstrated that this tool provided essential benefit for the studied assembly line. Moreover, Alaya (Citation2016) explored whether VSM as an important lean tool to lead any industry to lean. The results of their study validated that it could transform industries towards lean. Schoeman et al. (Citation2020) also validated the relevance of VSM to practice the LM approach in manufacturing industry in general and specifically in metal industry.
Similarly, Dhiravidamani et al. (Citation2018) investigated the impact of lean tools namely Kobetsu-Kaizen and VSM on LM implementation in the automotive industry. The findings of the study showed that both tools have provided many benefits in reducing lead time, non-value-added time, set-up time and number of operators required. Prasad et al. (Citation2020) addressed the challenge of implementing LM in the textile industry, due to inflexible automatic machinery with high volume/low product variety, by proposing an LM implementation framework. Andreadis et al. (Citation2017) studied practical and managerial issues surrounding the implementation and management of VSM in the manufacturing industry. Their study argued that implementing VSM provided reduced lead time, cycle time, inventory, and improved productivity as compared to the implementation of other lean tools, such as TPM, JIT and Jidoka. Likewise, Bashar et al. (Citation2024) explored the barriers to lean implementation within the apparel industry. The findings of their study highlight that the primary obstacles to implementing LM include a lack of understanding of the lean manufacturing system, the manufacturing process, the company culture and resistance from employees. Berhe et al. (Citation2023) proposed and validated a framework and implementation procedure for the implementation of integrated Kaizen in manufacturing industries. The proposed framework resulted promising improvement in productivity, delivery time, quality, 5S practice, and waste management. However, less focus has been given to validating and implementing LM specifically in the leather industry despite its importance.
Overall, this literature review indicates various lean tools’ effectiveness while also identifying opportunities to further explore LM in understudied sectors like leather manufacturing.
2.5. VSM and simulation
The concept of process mapping was established in 1980 by Japanese pioneers, Taiichi Ohno and Shigeo Shingo, at the Toyota Production System to visualize the flow of materials and information in the assembly plant, identify sources of waste, and finally to either reduce or eliminate waste. Ohno and Shingo, for the first time, named the mapping tool ‘Material and Information Flow Mapping’. This name has been changed to ‘Value Stream Mapping’ after Mike Rother and John Shook published a book entitled ‘Learning to See’. The book was the blue print for researchers and practitioners exploring the application of VSM to reduce and eliminate wastes and thereby maximize operational efficiency and product quality.
According to Rother and Shook (Citation1999), VSM is a pencil and paper tool that is used to envisage the flow of material and information throughout the value stream, and to identify the source of waste and appropriate ways for improvement. The value stream refers to all activities (value -added and non- value added activities) required to convert raw material into finished goods and deliver them to customers (Rother & Shook, Citation1999). The VSM is composed of two basic states: current- state VSM and future- state VSM. The current- state VSM provides a graphical representation of the flow of material and information in the value stream at the time of review. It provides information regarding the WIP, cycle time, process time and changeover time. Moreover, it assists in analyzing and identifying the sources of waste. Future-state VSM is constructed based on the proposed improvement approaches, which reduce waste through a lean tool (Andrade et al., Citation2016; Atieh et al., Citation2015).
The VSM has been used as a powerful tool to achieve lean manufacturing. Khalid et al. (Citation2014) argued that VSM fosters an organization’s transformation to lean manufacturing by visualizing the flow of material and information, and providing them with a blueprint for strategic planning. It is an effective tool for identifying and eliminating waste (Andrade et al., Citation2016; Dinis-Carvalho et al., Citation2014). Furthermore, it reduces inventory, which results in a reduction in throughput time (Atieh et al., Citation2015); and is practically applicable in any business activity (Gurumurthy & Kodali, Citation2011; Seth et al., Citation2008).
Over the past decade, a vast number of scholarly studies have focused on practicing traditional VSM to either reduce or eliminate industrial waste. On the one hand, for example, using this tool, Singh and Sharma (Citation2009) reduced the lead time, processing time, work-in-process inventory (WIP), and manpower requirement of a manufacturing firm; Venkataraman et al. (Citation2014) reduced manufacturing lead time and defects in automotive manufacturing plants; Lacerda et al. (Citation2016) reduced the cycle time and work force requirements of the automotive industry; Suhardi et al. (Citation2020) reduced and eliminated motion waste of a textile industry that resulted in a reduction of production time and improvement of operational efficiency; Alaya (Citation2016) diagnosed wastes and prepared LM implementation planning for the auto part manufacturing industry; Salwin et al. (Citation2021) reduced inventory waste and maximize the production rate of the steel pipe industry; Patil et al. (Citation2021) achieved a reduction in lead time and WIP, and gain in production output. Similarly, Saravanan et al. (Citation2018) used VSM as a lean tool to enhance the efficiency of a medium scale gearbox manufacturing company. The findings of their study showed that this tool provided interesting benefits in reducing production lead time and Takt time and enhancing the productivity of a company.
Despite the tremendous benefits of traditional VSM, it has limitations. It provides static (snapshot) information regarding the production system. It does not consider the process variability (dynamic behavior) of value streams (Aziz et al., Citation2017; Dinis-Carvalho et al., Citation2014; Luz et al., Citation2021, Citation2022; Rother & Shook, Citation1999). Moreover, it is limited to mapping simple and linear (single - route) production systems with single - product families (Aziz et al., Citation2017; Braglia et al., Citation2009; Gurumurthy & Kodali, Citation2011). Likewise, it is constructed by taking snapshot of the production processes through direct observation along the flow and recording what happens on the floor. Thus, the level of detail provided by this tool is limited (Braglia et al., Citation2009). Hence, to overcome these limitations scholars have proposed two approaches: extended and simulation.
The extended approach aims to enhance the level of detail provided by the traditional VSM. Several scholars have attempted to include additional information on the classical VSM using this approach. Dinis-Carvalho et al. (Citation2014) proposed a waste identification diagram to quantify waste associated with transportation and visualize information related to the utilization of both value - added and non-value -added activities, together with other performance indicators (productivity, resource utilization, and throughput time). Braglia et al. (Citation2006) introduced an alternative and innovative framework for the structural application of VSM in the complex production processes. The proposed framework, that is improved value stream mapping, enhanced the details of the classical VSM. It was developed by integrating the classical VSM approach with additional tools derived from manufacturing engineering. Seth et al. (Citation2017) proposed a generalized VSM application for both simple and complex production environments. Moreover, they provided additional information regarding energy wastage and rework through the Taguchi method. Bait et al. (Citation2020) expanded the level of detail of classical VSM by proposing an extended version of the VSM. They argue that the extended version is capable of having a broad and complete view of the entire process. Hence, this approach focuses on increasing the level of details provided by classical VSM so that it can be applied to production processes with multiple flows (complex) merging together. However, process variability, which has a significant impact on the production cost, lead time and operational efficiency, was not considered in this approach.
Scholars have used analytical and simulation approaches as complementary tools to enhance the traditional (classical) VSM and incorporate process variations (uncertainty) in the mapping process. Braglia et al. (Citation2009) included process variation in VSM using statistical analysis, fuzzy theory, and analytical approaches that helped to record and evaluate the variability encountered in the value streams. Liu and Yang (Citation2020) proposed triangular fuzzy numbers and normal fuzzy numbers to depict process variability in VSM. Lu et al. (Citation2011) proposed a lean pull system implementation procedure that considers manufacturing system variability and demand uncertainty with complex processes and multiple products using a multiple - criteria decision-making method. Mohanraj et al. (Citation2015) enhanced the traditional VSM by integrating it with fuzzy quality function deployment to enable the scientific prioritization of improvement potentials. Seyedhosseini et al. (Citation2013) applied the fuzzy set theory to incorporate process variation and visualize value streams. However, fuzzy theory results in the over estimation of process variation because it relies on the opinions of experts.
In recent years, scholars have attempted to address the limitations of the analytical approach by using a simulation approach as a conjunction tool with the traditional VSM. Simulation is a production system model tool used to create a comprehensive view of a real system (current state map) and evaluate alternative scenarios for future state maps (McDonald et al., Citation2002). It allows the dynamic analysis (stochastic simulation) of the production system over time required to identify potential improvements to the existing system, As-Is, and introduces new improvement approaches for the To-Be system (Bait et al., Citation2020). Similarly, it explores the various opportunities for process improvement and the impact of the proposed changes before implementation without incurring costs (Yiicesan et al., Citation2002). Andrade et al. (Citation2016) considered the process uncertainty encountered in auto-parts companies by enhancing traditional VSM using simulation. The study resulted in a 7% reduction in production - lead time and a 10% improvement in resource utilization. Aziz et al. (Citation2017) applied discrete event simulation (DES) as a supplementary tool to extend the traditional VSM for process variation optimization of road surface operations. This study has resulted in significant improvements in improving resource utilization and operational efficiency. Schmidtke et al. (Citation2014) proposed DES to enhance the traditional VSM and model complex processes, including variability in great detail. The findings of the study depicted a shop floor lead – time reduction from 11.4 to 1.4 d. Alvandi et al. (Citation2016) attempted to augment traditional VSM using DES and proposed a methodology to evaluate the dynamic behavior of energy flow in a multi – product manufacturing system. However, they neglected the variations in power demand and production time in their proposed methodology.
More recently, Bait et al. (Citation2020) proposed criteria for expanding traditional VSM and guiding value stream analysis via simulation. The proposed criteria were limited to linear production systems. Stadnicka and Litwin (Citation2019) presented how the integration of traditional VSM with continuous simulation (system dynamics) increases the possibility of waste identification and elimination in the automotive industry. De Souza et al. (Citation2018) identified improvement opportunities for future-state maps of suppliers of university hospitals by considering process variability through a combination of VSM and Monte Carlo simulation. The findings of the study show that the combination enables the identification opportunities for improvement, which provides a more realistic condition of the current state. Although the contributions of these scholars to extending the traditional VSM using simulation and consider process variability and complexity are undeniable, the level of such research is found at the infant stage. These scholars focused either on enhancing the level of detail provided by traditional VSM or identifying improvement potentials for the to-be state using simulation as a supportive tool.
On the other hand, other scholars have proposed value models aimed to mitigate the environmental impact of product wastes after its end of useful life. For instance, Shirodkar et al. (Citation2006) and Kumar et al. (Citation2007) proposed a model to characterize the value flow during a product life cycle. They suggested that customer perception and recovery capability play vital role in the product life cycle thereby reducing the environmental waste of used products. Vadrevu et al. (Citation1994) suggested a value model to understand and measure the value of a product during its life-cycle. Similarly, Sutherland et al. (Citation1997) suggested a simple model aimed at estimate a product value at any time over its life – cycle. Ortegon (Citation2014) presented a model that assists in creating value for products to complete their useful life, thereby providing crucial economic and environmental benefits. Gunter (Citation2004) developed an analytical model to manage inventories during the remanufacturing of end- of -use products. However, all these scholars have focused on reducing the waste (inventory waste) of consumed products by enhancing product value through the circular manufacturing paradigm. They advocated identifying used products from customers, bringing them to manufacturing sites for recycling (recovery stage), and then sending them back to end users. However, this research has focused on reducing different wastes (such as inventory, motion, defects, transportation, over- production, and waiting) at the shop floor of the leather industry (manufacturing components of a supply chain) via a lean manufacturing paradigm.
2.6. Parameters for value stream analysis
Lean metrics aimed at measuring the operational/process/efficiency of the value streams of the entire production process in the manufacturing industry were identified from the literature. lists the lean metrics identified for the analysis of the current state map.
Table 2. Parameters/metrics/for current state analysis of classical VSM.
illustrates types the of metrics used to evaluate the current state of classical VSM for manufacturing. Hence, lead time (47.83%) cycle time (43.5%), change over time (30.43%), WIP (30.43%), value – added time (21.74%), manpower (17.4%), processing time (17.4%), and uptime (13.04%) are the most widely applied metrics in the literature to conduct value stream analysis of classical (traditional) VSM for the manufacturing sector.
presents literature review results related to the types of metrics used to perform the current state analysis of the extended VSM for the manufacturing industry. Accordingly, lead time (43.48%), value added time (39.13%), change-over-time (37.8%), cycle time (34.8%), manpower (26.1%), shift (17.39%), non-value added time (13.04), resource utilization (13.04%), WIP (13.04%), uptime(13.04%), energy (13.04%), processing time (13.04%), waiting time (13.04%), scrap (13.04%), throughput time (8.7%), output rate (8.69%), good – quality output (8.69%), delivery time (8.69%), available working time (8.69%), MTTR (8.69%), and MTBF(8.69%) are the common metrics in the reviewed literature for analyzing the current state of extended VSM. Hence, this research used these lean parameters (parameters used by many prior researchers to extend the level of details of classical VSM) to augment the classical VSM. The current state analysis of the extended VSM provides a sufficient level of detail required to integrate the VSM with the simulation.
Table 3. Parameters/metrics/for current state analysis of extended VSM.
2.7. The research gap
The research gaps identified from the reviewed literature are summarized below:
Limited research incorporates variability analysis to enhance traditional value stream mapping (VSM). Approaches that integrate variability remain underdeveloped.
Findings on extended VSM application are difficult to generalize across all industries, as most focus on manufacturing generally or automotive specifically. Less attention is paid to industries like leather and such a problem is acute in the case of the Ethiopian leather industry.
While challenges of classical VSM are addressed by a few scholars through simulation integration, no studies investigate the impact of improvement scenarios on operational metrics via enhanced VSM-simulation models.
Proposed process mapping models consider time or combine time with energy, but enriching VSM with time, energy, and quality attributes simultaneously is lacking.
Overall, opportunities remain to further develop enhanced VSM approaches, broaden industry applications, particularly for leather, expand the operational metrics assessed, and fully leverage integrated VSM-simulation modeling for improvements analysis and scenario-based decision support.
3. Research methodology
3.1. Case study
This research was conducted at Company XYZ, a leading leather products manufacturer located in Addis Ababa, Ethiopia (company name changed for confidentiality). XYZ produces a variety of leather goods including document cases, briefcases, ladies’ handbags, luggage, school bags, leather jackets, and soccer balls across multiple production lines. Despite variations, the core production processes are common, including cutting, dispatching, preparation, stitching and finishing. Raw material from tanneries is first cut to pattern designs. Pieces are then dispatched, sorted and prepared by lining according to patterns. Prepared work enters stitching assembly, where items are constructed, then finishing for final assembly.
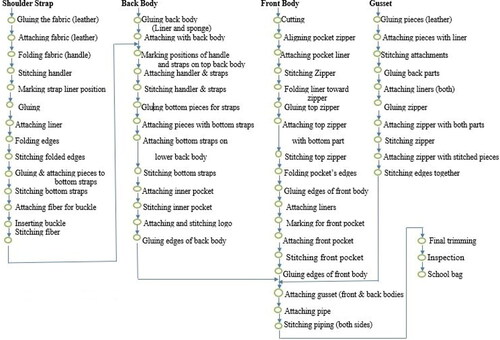
Currently operating one daily shift of nine hours including breaks, XYZ strives to meet local and international demand. However, production faces challenges including high work-in-process inventory, long travel distances, unnecessary processes, wait times and lead times. Shop floors also lack organization. Seeking solutions, this study focused on one product, school bags, to analyze assembly workflows and address inefficiencies constraining XYZ's operational effectiveness. Detailed school bag processes and activities are depicted in . By undertaking lean interventions, this research aims to support XYZ in overcoming challenges and enhancing production performance.
Figure 1. Assembly process chart.
3.2. Ethical approval statement
In order to clarify the ethical approval of our research within the Ethiopian context, it is important to provide a brief explanation about the nature of this research. Our research is categorized under non-interventional, specifically employed quantitative research approach, and didn’t involve any individual medical interventions or experimental procedures. We used on-site observations (Gemba-walk) and document reviews to collect relevant data from the case study company.
Prior to data collection, we read the national research ethics guideline of the Federal Democratic Republic of Ethiopia (FDRE). According to Proclamation No.1263/2021, developing this ethical guideline for research and endorsing the research ethics are authorized to the Ministry of Education (MoE) of FDRE. The MoE developed and approved the national research ethics guideline in 2022. This guideline provided authority to the National Research Ethics Review Board and Institutional Research Ethics Review Committee mandated to conduct ethical reviews at the national and institutional levels, respectively. In this regard, we contacted the Addis Ababa institute of Technology, Addis Ababa University, Institutional Research Ethics Review Committee, and explained the purpose of the research and its methodology. We received written ethical approval from this committee to conduct our research. After reviewing the ethical approval letter, the school of Mechanical and Industrial Engineering of Addis Ababa Institute of Technology, Addis Ababa University, Ethiopia, wrote permission and a support letter to the case company. Verbally, the company granted informed consent to collect necessary operational data. In fact, our research didn’t need human participation during the data collection stage. However, to further enhance our results related to the verification and validation of VSM-based simulation model at the data analysis stage, we invited a few experts. We explained the verification and validation purposes and requested permission. In this regard, the ethical guideline clearly states that the informed consent of the research participant shall be approved either in writing or verbally. It also states that the privacy of the research participant shall be respected and confidentiality shall be maintained. Thus, the experts provided verbal informed consent and were assured of anonymity to protect their privacy.
3.3. Data collection methods
The state- of- the- art literature related to the topic of this research was reviewed in detail to understand the recent body of knowledge in the literature and identify research gaps. Gemba-walk, interviews and company reports were used to collect the relevant data from the case company. Gemba-walk, a Japanese term that refers to observation, was used to observe the actual work place on the shop floor and understand what is done, how it is done, and to fully understand the problems that affect the flow of material and information in the value streams. Additionally, the company’s daily, weekly, and monthly production and quality reports were used to understand product demand, WIP, scarp products, and quantity of orders from both customers and the production department.
3.4. Methods of developing enhanced VSM
The VSM procedures proposed by Rother and Shook (Citation1999) were adapted to develop an enhanced VSM. Accordingly, the following steps were performed:
Selecting product family: After completing the critical observation of the shop floor activities of the case company, one product family was selected based on customer demand data collected from the company’s report. A product family with more customer demand than others was selected to develop the VSM.
Identifying parameters/metrics/required to extend classical VSM: The most widely used metrics to extend classical VSM were identified from the literature. As mentioned in , important metrics aimed at measuring the value streams on the shop floor in terms of operation efficiency, availability, quality, and cost were clearly identified. A stop watch was used to record the time - related data for each operation/process/of the selected product family. Ten observations were collected per process. Quality and energy data were also collected from unstructured interview and company reports.
Drawing enhanced current state VSM: The entire process of the product family was mapped, using standard icons, to visualize the flow of information and material throughout the value streams.
Analyzing Enhanced VSM: A detailed analysis of the developed current state map was performed in terms of identified performance measurement metrics, and potential area of improvements (waste) were identified.
3.5. Methods of integrating VSM with simulation and conducting experiment
The enhanced VSM analysis results were used as inputs to develop a simulation model of the current state for the selected product family. There are three common types of simulation: DES, Continuous simulation and Monte Carlo simulation. These three types of simulations are defined as follows: DES aims to model a system by which the state of a system changes only at discrete- points in time (Banks et al., Citation2005); Continuous Simulation deals with the modeling of a system in which the state variable changes continuously over time (Fortier & Michel, Citation2003); and Monte Carlo simulation refers to modeling a system that is affected by randomness, and it helps to use generated random numbers to estimate some functions of a probability distribution (Brandimarte, Citation2014). This research used DES to enhance the traditional VSM, unlike to other simulation types:
It has a high degree of flexibility and capability to accurately depict state fluctuations during the production process (Aziz et al., Citation2017).
It is applicable for depicting virtual models and dynamic changes in the of processes of a discrete manufacturing company. Fortunately, this study used a discrete type of case company.
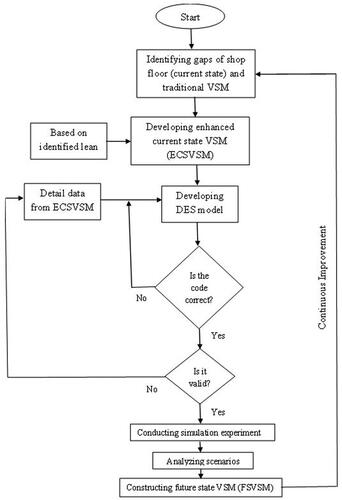
As shown in , a conceptual framework was developed to integrate DES and VSM.
Figure 2. Conceptual integration model for VSM and DES.
Although there are multiple DES software applications in the market, such as Arena, AutoMod, Extend, FlexSim, Micro Saint, ProModel, QUEST, SIMUL8, WITNESS, FlexSim has been selected to extend classical VSM because of its user-friendliness, rich functionality and capability to depict important information such as throughput, content, machine state, and utilization.
Hence, the developed simulation model was validated by crosse-checking the output of the simulation model with the real system. Opinions of selected experts form the case company were also used to further validate the simulation model. Once the validation of the developed simulation model was checked and corrected, a simulation experiment was conducted to clearly visualize the behavior of the material and information flow in the current value streams over time. This experiment aimed to identify the source of waste and propose improvement potentials (scenarios) targeted to either reduce or eliminate the identified waste.
3.6. Proposing scenarios and develop future VSM
Possible improvement scenarios were proposed to leverage the operational efficiency of the value streams in addition to other performance metrics identified in the literature. The proposed scenarios were included in the simulation model, and an experiment was conducted to identify a better scenario and its impact on the performance of value streams over time. Subsequently, a future – state VSM was developed by incorporating the proposed scenarios into the extended VSM. Likewise, the results of the future – state VSM were compared with the current - state VSM in terms of the identified metrics for the extended VSM.
4. Result
4.1. Product family selection
A product family refers to a group of products that common processing routes and machines throughout the value streams. Hence, the product matrix was used to categorize leather products into product families. The results of the product matrix are presented in . The complexity and frequency of processes (processing routes shared by products), together with product demand, were used to select one family among the four product families categorized in . Hence, using these criteria product family one was selected for this study. Of the products categorized under product family one, the school bag was selected for the value stream mapping process because it is the most demanded and frequently manufactured product, as confirmed during observation and review of the company’s monthly, weekly, and daily production reports, as compared to other products in the family.
Table 4. Product matrix.
4.2. Developing enhanced VSM
The parameters (lean metrics) used to augment classical VSM are presented in . Thus, these metrics were applied to develop the current state VSM, and identify wastes and potential improvement scenarios that lead to operational improvements to the company. It is essential to depict the chronological sequence of the assembly operations of the school bag, SB001 model, which is required to conduct a detailed visualization of the value streams. Likewise, the observation time for each assembly operation was recorded. The assembly process chart of the selected product family is shown in .
According to the company’s report, the average daily demand for school bags (SB001 model) was 120 pcs. Using this data, takt time, the rate at which the unit of product needed to meet customer demand is manufactured was computed by taking the ratio of net available working time per day (27,612 s) to the average daily demand. The company starts and completes operations at 8:00 AM and 12:00 PM respectively for the morning session and resumes and completes operations at 1:00 PM and 5:00 PM, respectively for the afternoon session. Twenty minutes were allowed for tea breaks in the morning session only. Likewise, lunch breaks were allowed from 12: 00 PM to 1:00 PM. It has only one shift per day. Hence, the Takt time was 230.1 s. This implies that to satisfy the daily demand, one PC of the product should be produced every 230.1 s. The Takt time is significantly different from the average cycle time of each operation (process) of the value streams required to convert RM into finished goods (school bags). This deviation illustrates that the production processes (operations) were not well balanced. To balance the production process, the value of the average cycle time should be either equal to or near the Takt time.
Furthermore, the value - added time (VA) and non-value-added time (NVA) of the entire value stream of the selected product were quantified in the shop floor mapping process. Thus, the value streams of the school bag consist of 2198.24 s and 14.59 d of VA and NVA, respectively. NVA is waste incorporated in the value streams, and it should be either eliminated or reduced to leverage operational efficiency. Activities included under NVA are categorized as either necessary non- value - added (NNVA), unavoidable waste, or unnecessary non-value- added (UNNVA), avoidable waste, activities. Of the 14.59 NVA days, 51.41% are NNVA (RM inspection, design and pattern making, and final inspection). In addition, the value-added ratio aimed at measuring the efficiency of processes (value streams) was computed by taking the ratio of VA to total production lead time (TPLT). The value of the TPLT is determined by summing both the VA and NVA. The number of days a unit (pc) waits until it is processed by the next process is included in the TPLT determination. Hence, the total work- in-progress inventories in the value streams are converted into waiting days by dividing the total pcs waiting by the average daily demand; ex. 70 pcs are waiting for the lining process, and thereby, its equivalent waiting days becomes
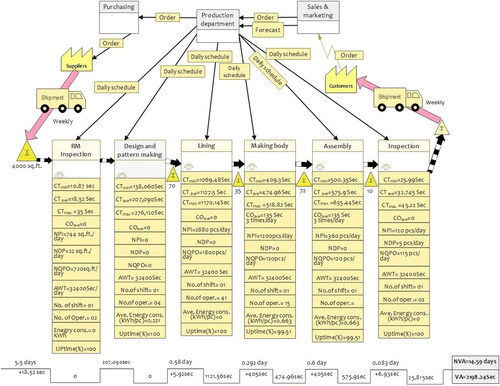
Where, A1: Design and Pattern Making; A2: Cutting; A3: Stitching Zipper pocket; A4: Punching; A5: Stitching front body; A6: Preparing Body; A7: Installing rivet and buckle; A8: Stitching front body with zipper; A9: Stitching locks with front body; A10: Stitching front body with Zipper; A11: Stitching Inner Layers; A12: Burnishing; A13: Stitching liner with surface leather; A14: Stitching layers with body; A15: Stitching Back body; A16: Stitching handler and strap; A17: Attaching inflator; A18: Stitching front and back bodies; A19: Stitching sleeves; A20: Stitching Zipper; A21: Stitching handler with front and back body; A22: Assembling sleeves with body; A23: Stitching back body with strap; A24: Stitching gusset/side gusset; A25: Stitching Collar; A26: Assembling front and back bodies with gusset; A27: Stitching buttons; A28: Piping; A29: Stitching hem; A30: Ironing; A31: Trimming 0.58 d (70 pcs/120 pcs/d). Thus, the value-added ratio becomes 0.54%. This result reveals that there is a significant chance of enhancing the efficiency of the value stream by either reducing or eliminating NVA activities. The researchers could not obtain an acceptable level of value-added ratio for the manufacturing industry in general and the leather industry, particularly in the extant literature. However, the results clearly indicate that there is a huge gap between value – added and non-value-added times. This gap illustrates that most shop floor activities are non-value-added activities (waste) that potentially reduce the operational efficiency of the leather sector. A summary of the enhanced current state (ECS) VSM for the aforementioned product is shown in . To improve the quality of the figure for ECSVSM, cutting, dispatching, and preparation processes were categorized into the lining process; making the front body, making the shoulder strap and making back body processes were categorized into making body; sub-assembly, gusset, and final assembly processes were categorized into assembly process; trimming and final inspection processes were categorized into the inspection process.
Figure 3. Summary of enhanced current state VSM.
4.3. Developing simulation model
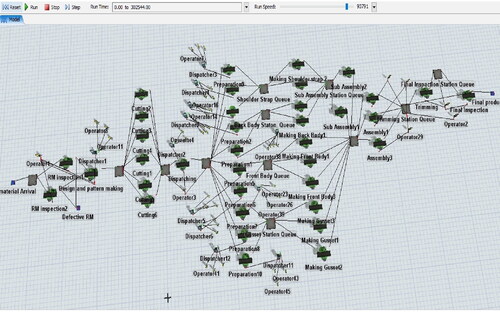
The FlexSim simulation software, version 19.0.0, was used to develop the simulation model for the existing value streams of the selected product. The data provided by the enhanced current-value stream map were used as inputs to develop the simulation model. Moreover, the assembly process chart shown in was used to gain insight into sequence operations while developing the simulation model. The aim of the developed simulation model was to consider the dynamic behavior of the process over time.
The process variation of the school bag value streams was considered in the simulation model by fitting the recorded observed cycle time of each process (operation) into an appropriate probability distribution. EasyFit software, version 3.0.0, was used to select an adequate distribution type and perform the goodness-of-fit experiment. There are three types of goodness-of-fit techniques: Kolmogorov-Smirnov (K-S), Anderson Darling, and Chi Squared tests. Thus, the K-S test was applied to test the goodness of fit because, unlike the remaining tests, it is applicable to any sample size. The location, scale, and shape parameters for each process in the FlexSim logic were clearly encoded while fitting the process time to the distribution. After incorporating process variation into the FlexSim logic, a simulation model of the value streams for the selected product family was developed. The constructed simulation model is shown in . The maximum design and pattern-making cycle time was used to determine the value of the replication length. Thus, the simulation model was run for 2 weeks (302,544 s). A zero-warm-up period was used to simulate the model because the statistical values of the processes in the model reset immediately to their normal values before the next run was started.
Figure 4. As-Is simulation model.
4.3.1. Simulation model verification and validation
The model was verified by carefully debugging the Flex script for each Flexsim object and their respective parameters in the logic field. Likewise, the logic fields for all connections were checked. The observed problems (Flex script error) were corrected using a system console sampler. Hence, the debugging process confirmed that the As-Is simulation model was well coded. Moreover, we contacted three software experts from the school of Electrical and Computer Engineering at Addis Ababa institute of technology. We informed the purpose of getting them. Hence, the experts carefully checked the simulation code for syntax errors, logic errors, math errors, etc. Run debugging tools to trace model execution and check for correct decision points. They corrected minor errors to the Flex script. Finally, they confirmed that the simulation model was well coded and ready for the simulation experiment.
Likewise, validation of the simulation model was performed by computing the percentage of error with respect to the output of the real system and the simulation model. In two weeks, the company produced 1320 pcs of school bags with the SB001 model. The as-is simulation model experiment resulted in 1261 pcs of school bags for the same run period. According to Kelton et al. (Citation2010), the percentage error of the simulation model should not exceed 10%. Thus, the percentage error for the simulation model was 4.47%. The error result reveals that there is no significant difference between the outputs of the real system and the simulation model.
Moreover, we invited five experts (two deputy general managers, one production manager, one production planner, and one sales and marketing manager) from the case company to objectively evaluate the proposed simulation model. In one and a half hour facilitated discussion, the panel evaluated the model objectively. We first created awareness around the simulation software used and the purpose of modeling the system. The panel then carefully observed how the school bag assembly processes were represented virtually versus on the factory floor. Additionally, they compared simulation outputs such as historical production quantities, average process cycle times, work-in-progress levels, and resource utilization against real system performance metrics. Upon thorough examination, the expert panel concluded the developed simulation model provides an accurate digital representation of their production setup and workflow processes. Their assessment involved prudently scrutinizing process recreations and output performance metrics to validate the model’s functionality and fidelity. This expert validation approach utilizing managers deeply familiar with operations offered robust confirmation that the simulation effectively captures and portrays key aspects of the actual manufacturing system under study.
4.3.2. As-Is simulation experiment result
The results of the simulation experiment for the existing system are presented in terms of total waiting time and total WIP inventory. A summary of the simulation results is presented in . presents the total waiting time and WIP inventory along each station of the school bag value streams after conducting two working-week simulation experiments. Hence, the results demonstrate that the back body, sub-assembly, RM inspection, assembly, and preparation stations have the maximum queue waiting time for the next process in their respective order, followed by the shoulder strap station. A long waiting time is the driving factor for bottleneck processes(operation), sources of shop floor waste, observed in the production processes. Thus, back body, sub-assembly, RM inspection, assembly, and preparation operations are identified as bottleneck operations as compared to other operations in the entire value streams of school bag production. These bottleneck operations contribute significantly to the computed NVA, as shown in . Likewise, the aforementioned stations have the maximum number of WIP inventories waiting for the next process. Inventories (pcs) are kept in the queue without adding value to the product, rather, they reduce the operational efficiency of the value stream.
Table 5. As- Is simulation experiment results for waiting time and WIP inventory.
The summarized results of the simulation experiment, in terms of waiting time, WIP level, percentage utilization, throughput, and quality, are presented in .
Table 6. As-Is simulation experiment summary.
The result of the percentage utilization of the entire process ensures that the value streams (production processes) of the case company are not balanced. Hence, unbalanced production processes aggravate the accumulation of NVA across the value streams. In addition, the operational (production) efficiency of the value streams is computed by taking the ratio of the total number of good product outputs to the total input to the source (store). Accordingly, the operational efficiency is 86.72%.
4.3.3. Waste identification
Based on the As-Is simulation experimental results and the detailed data incorporated in the enhanced current VSM, value stream wastes that affect the operational efficiency of the production process were identified. Thus, the following wastes were distinguished.
Inventory waste: - For two weeks of the simulation run, 133- pcs were kept in buffer, without adding value, across the value streams of the shop floor production processes. The inventory waste observed during the shop floor mapping process is depicted in .
Waiting waste: - Work-in-progress pcs are forced to wait for a total of 24,982.2 seconds to get services by the next production processes. The observed waiting time across the selected value streams of the product family is shown in .
Over-production waste: - This occurs was because of the dynamic nature of product demand. The production process produces 126 pcs (120 pcs normal demand and 6 pcs as safety stock) per day, and the safety stock is stored until the new demand absorbs it. The over-production waste observed during the shop floor mapping process is shown in .
Transportation waste: - To produce one unit of product, operators are forced to travel approximately 36.25 m on the shop floor, starting from the RM store to the finished goods store. Traveling this distance every day to bring WIP from one station to another is a waste to the operator as well as the company. Thus, this waste should be reduced, and operational efficiency should be enhanced. The observed transportation waste across the value streams of the product family is shown in .
Defect waste: - As per the simulation experiment results, defective products were identified in both the RM inspection and final inspection stations.
Waste related to motion: - Awkward motion of the operators was observed during the mapping period. The unnecessary motion of the operators in the cutting station was visualized. Operators in the cutting station perform cutting operations in the standing position. Awkward motion together with the standing position has a great chance of concentrating fatigue on operators. As a result, their performance is reduced. The performance reduction of operators is a waste to the company, and it needs to be either reduced or eliminated. The observed waste related to motion is shown in .
Figure 6. WIP waiting for the process.
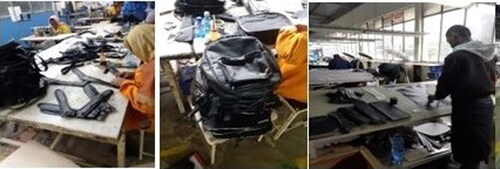
Figure 7. Over produce WIP in various stations and finished goods.

Figure 8. Overview of transport distance in shop floor value streams.
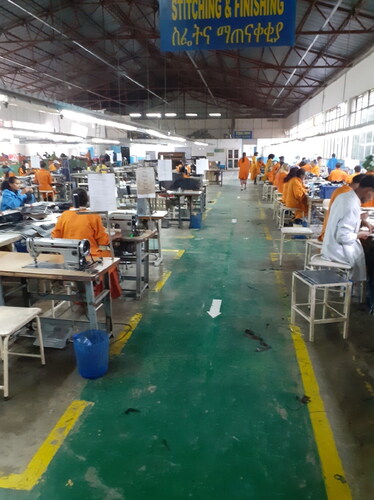
Figure 5. WIP inventories in various station queue.
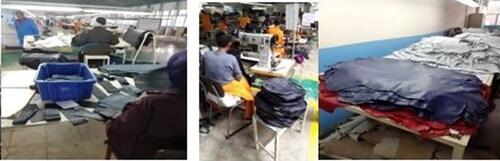
Figure 9. Cutting operation in standing position.

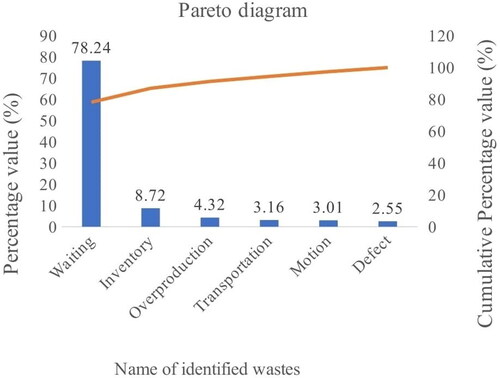
The identified shop floor waste was prioritized using a Pareto diagram. The different numerical values of the aforementioned wastes were converted into equivalent time units. Hence, the equivalent time value of inventory waste is 2782.12 s ((Total WIP in 2 weeks)/(average demand in 2 weeks) * net- working hour per day*3600 s) = ((133/1320) *7.67*3600) = 2782.18 s). A similar method was used for the remaining waste. The equivalent time value results for each identified waste are summarized in .
Table 7. Equivalent time value of identified wastes.
Thus, the equivalent time value results for each identified waste were used to draw a Pareto diagram. shows the percentage and cumulative percentage values of the identified wastes in the shop floor value streams. The diagram illustrates that waiting and inventory wastes have a major contribution (≥80%) to the total equivalent time value. Hence, these two major wastes received special attention in this research because addressing these wastes would have a significant impact, unlike other identified wastes, in reducing NVA activities observed in the shop floor value streams, thus, the operational efficiency of the value streams could be leveraged.
Figure 10. Pareto diagram for identified wastes.
4.3.4. Investigating impacts of WIP inventory
We investigated the impact of varying WIP levels on the total waiting time, TPLT, and throughput using simulation experiments. To investigate the impact of the WIP on the aforementioned parameters, the total WIP (133 pcs) found in the experimental results of the As-Is simulation model was used as the initial WIP value. Hence, the dynamic behavior of the production system over time is graphically described in terms of the abovementioned parameters in . As shown in , the WIP inventory value remains relatively stable until midway through the run length, but then sharply increases afterward. In addition, the average waiting time per run and average cycle time per hour exhibit substantial variation between maximum and minimum values for these metrics.
Figure 11. Sample experiment results for 133 WIP level.
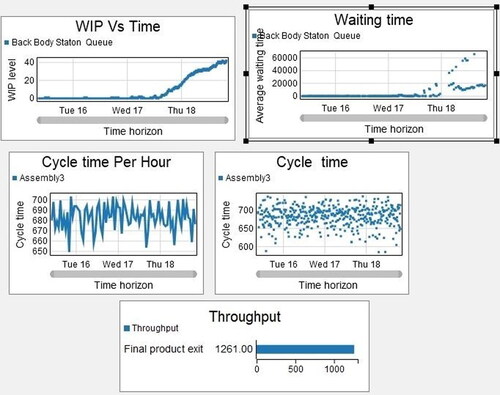
These results indicate the assembly lines are not well balanced. Specifically, the dramatic surge in WIP value after the midpoint suggests a bottleneck is developing over time. Meanwhile, the wide ranges for waiting times and cycle times at the process-level point to imbalance and inefficiencies across operations. Five different WIP values, including the initial WIP value, were used to carry-out distinct experiments and present their results. The simulation results for the varying WIP levels for the specified parameters are presented in .
Table 8. Impact of varying WIP level.
The results in reveal that WIP levels have a positive impact on waiting time and TPLT and a negative impact on throughput.
4.3.5. Proposing solutions
Five different scenarios have been proposed to address the major shop floor wastes identified to date. A description of each scenario is provided below:
Scenario one: Adding one more operator for all processes identified as bottleneck operations (processes). This scenario aims to enhance the capacity of the bottleneck processes.
Scenario Two: Adding one more operator for the making back body, sub- assembly, RM, and assembly processes, and adding three more operators for the preparation process. Adding more resources for preparation were considered in this scenario because, unlike other processes, it has more than 85% resource utilization. This scenario aims to distribute manpower resources uniformly, and as a result, bottleneck processes will be reduced.
Scenario Three: Combining the dispatching process with the cutting process and adding one more operator to all the bottleneck processes.
Scenario Four: Combining both scenario two and three.
Scenario Five: Combining the dispatching process with the cutting and trimming processes with the assembly process and adding one more operator to identified bottleneck processes.
The summarized simulation experiment results for the proposed scenarios are depicted in .
Table 9. Summarized results of simulation experiment for proposed scenarios.
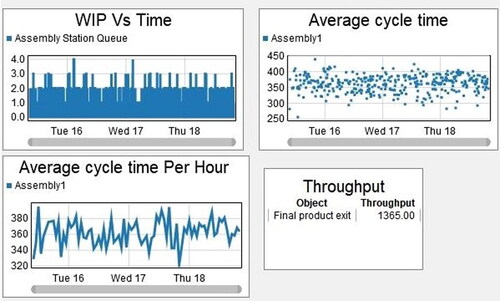
Based on the results in , the best scenario was selected to represent the To- Be simulation model for shop floor value streams. Accordingly, scenario four was selected. The developed To- Be simulation model for all value streams of the shop floor for the selected product family is depicted in . The simulation experiment, shown in , of the To-Be model shows the dynamic behavior of value streams of the shop floor over time for a selected product family. The simulation experiment, shown in , of the To-Be model shows the dynamic behavior of value streams of the shop floor over time for a selected product family. As shown in , the WIP inventory value remains relatively uniform over the run time in the To-Be simulation model. Furthermore, the average waiting time per run and average cycle time per hour exhibit little difference between minimum and maximum values. These results demonstrate that the To-Be model successfully reduces bottlenecks and establishes a more balanced assembly line when compared to the As-Is model. Specifically, the steady WIP inventory level throughout production indicates the To-Be line avoids issues like intermittent blockages that can develop. Additionally, the minimal variance in waiting times and cycle times at both aggregate and process levels provides evidence that operations are more smoothed and leveled. The To-Be simulation thus achieves an improved, more efficient flow through balancing the assembly processes. This suggests implementing the proposed changes can optimize resource utilization while stabilizing production metrics like WIP inventory and throughput times within the real system.
Figure 12. Developed To-Be simulation model.
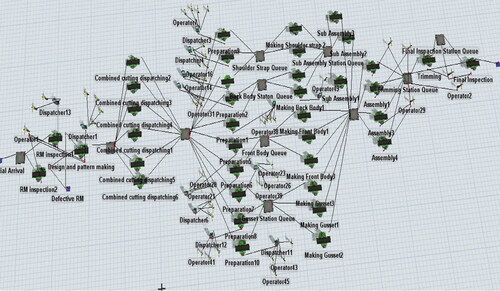
Figure 13. Dynamic behavior of sample value stream in the To-Be model.
In addition to the scenarios discussed above, the following solutions were proposed and synchronized with the selected scenario to enhance the problem-solving level. Moreover, it addressed the transportation waste visualized in the current state of VSM. Based on the results of the literature reviewed in LM implementation, the authors proposed and validated (using To-Be simulation experiment) the integration of multiple lean approaches, such as, 5S, pull system (supermarket), layout and line balancing, to achieve a future state with balanced flow and optimized resource utilization.
5S: - This lean technique was proposed for use in both the combined cutting-dispatching and preparation processes. In both processes, various pieces are available in a disorganized manner. Thus, it assists assigned operators sorting and preparing those cut pieces based on their respective patterns.
Supermarket: - This pull system was proposed for use in both RM storage and design and pattern- making areas. The sister companies deliver raw materials weekly. They are in Addis Ababa. However, the raw material will be kept for 5.5 days in stored until it is processed on the shop floor. The probability of suppliers’ disturbance due to uncertainty for the case company is low compared to those suppliers located abroad because both the case company and its suppliers are found in the same location. Thus, an average of 2000 sq.ft. of leather will be ordered and delivered to the case company twice a week, hence, the level of inventory kept in the store and its waiting days for the process will be reduced by half. Similarly, the company needs one to two weeks of operation to complete the design and pattern-making processes. Fortunately, as suggested by the design team, the operation could be completed within 4 to 7 d only if all assigned staff were engaged fully in the design operation. Thus, the supermarket aims to order the design team to deliver the required products via these days.
Layout modification: - The modified layout has reduced the total travel distance from 36.25 meter to 19.3 meter. Moreover, the existing layout is disorganized, resulting in unnecessary workplace usage. Thus, modification of the existing layout has improved space utilization, thereby, reducing the transportation and work-place (space) waste visualized across the entire shop floor value streams. A cost-benefit analysis was conducted to validate the cost-effectiveness of scenario-based and layout -modification solutions to the company. The results reveal that the solutions would result in additional profits for the company.
Line balancing: - It balances the assembly lines by redistributing work tasks and ensuring uniform cycle times across processes. This eliminates bottlenecks and stabilizes flow. The selected scenario (scenario four) was used to reduce bottleneck at body assembly stations.
A future - state VSM (FSVSM) was constructed by incorporating the proposed solutions into the enhanced current- state VSM. The total work-in-progress (WIP) inventories found at the end of the simulation experiment for the selected scenario were converted into equivalent waiting days using the same technique applied in the enhanced current state VSM, except for the average daily demand value. A minor modification was performed on the average daily demand value. According to the company’s production department report, the average monthly demand (for August and September 2022) is forecasted to increase by 8%. Using simple mathematics, the average daily demand for the selected product family was 129 pcs.
Likewise, the takt time for future state VSM is 214.05 s. The developed future- state VSM is depicted in . To improve the quality of the figure for the FSVSM, combined cutting dispatching and preparation processes were categorized into the lining process; making the front body, making the shoulder strap, and making back body processes were categorized into making body; sub-assembly, gusset and final assembly processes were categorized into assembly process; and trimming and final inspection processes were categorized into the inspection process. The results of both the ECSVSM and FSVSM are presented in in terms of the identified parameters (metrics). The major wastes identified via Pareto analysis were significantly reduced in the FSVSM using the proposed solutions. Likewise, the takt time result for the FSVSM reveals that the deviation between the average cycle time of processes (operations) and takt time is minimized, and as a result, bottleneck processes are reduced. The NVA in the FSVSM is reduced by 42.9%, which implies that the identified wastes are well reduced. Moreover, the TPLT in the FSVSM is reduced by 42.72%, which assists the company in early product delivery. Consequently, customer satisfaction was enhanced. The VA ratio result for FSVSM shows that the gap between the value addition and non-value addition times is deduced by 55.56%. Furthermore, the transportation waste in the FSVSM was reduced by 46.76%. The average utilization of the FSVSM is enhanced by 28.58%, which reveals that the line balancing problem is addressed significantly. In addition, the operational efficiency of the entire value stream improved by 8.16% using the proposed solutions.
Figure 14. Developed future state VSM.
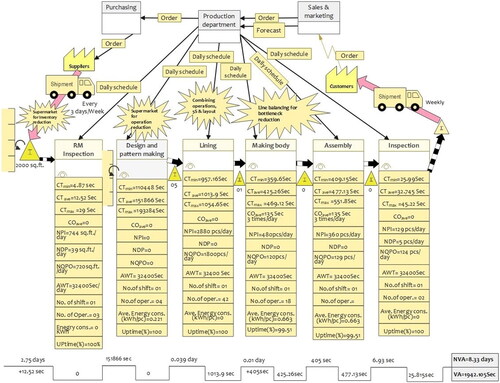
Table 10. Result comparison.
5. Discussion
This research validated the application of simulation-based ECSVSM in the leather industry. A product family was selected to visualize key metrics like Takt time, VA, NVA, and VA ratio across the value streams. The results showed a significant difference between Takt time (230.1 s) and average process cycle times, illustrating an imbalanced production system. Moreover, the large gap between VA (2198.24 s) and NVA time (14.59 d), plus the low VA ratio (0.54%), demonstrated that few working hours actually added value. These results of ECSVSM provided substantial insights into lean improvements. A simulation model incorporating process variability studied value stream behavior over time. Metrics like waiting times, resource utilization, WIP, throughput and efficiency identified bottleneck processes wasting time and inventory. Similarly, the results of percentage resource utilization across processes also indicate the value streams of the case company are not well balanced. Specifically, the lack of uniform utilization demonstrates uneven workload distribution that contributes to process bottlenecks. When processes are unbalanced, non-value- added activities like waiting accumulate throughout the value streams.
This research identified major lean wastes in the shop floor value stream using a Pareto chart. Alternative solutions (scenarios) were proposed to address the identified wastes and validated through simulation experiments. Identified lean metrics were used to evaluate scenario performance. The best performing scenario was selected. The selected scenario was further enhanced by integrating multiple lean tools, including 5S, supermarkets, layout modifications, and line balancing. A To-Be simulation model validated the integrated solutions, showing reductions in TPLT (by 42.72%), NVA (by 42.9%), average utilization (by 28.58%), along with improved operational efficiency (by 8.16%) and higher value-added ratio (55.56%). Furthermore, significant benefits were realized through lower wait times, reduced work-in-process inventory, unused labor, and increased throughput. These results are in line with the findings of Reda and Dvivedi (Citation2022b, Citation2022a) who investigated the application of VSM in the leather industry; and Liu and Yang (Citation2020) and Reda and Dvivedi (Citation2023) who studied the impact of VSM based simulation approach in the leather industry. Thus, the results of this research validated that the LM approach could be an effective waste minimization tool in the leather industry.
6. Theoretical and managerial implications
6.1. Theoretical implications
This study makes a substantial contribution to the body of knowledge. First, the study validated the application of enhanced VSM in the leather industry, which is characterized as a complex production system, where the components of a leather product come from different assembly lines and join together. As described in Sections 1 and 2.3, most previous research has focused on its application in the automotive industry. Little emphasis has been placed on its application in the leather industry. This study is the first to validate the application of the extended VSM in the Ethiopian leather industry. The findings of the research could be applied in sectors engaged in assembling components to obtain finished good items (such as the footwear industry, vehicle assembly, garment, and other assembly industries). Second, the research augmented the level of detail of traditional VSM using time, quality, and energy data. The previous research has played an undeniable role in eliminating industrial waste using the traditional VSM approach. However, it provided limited information about the material and information flows of shop floor activities in the production system of the product family under study. Third, prior research has paid less attention to incorporating variability in the mapping process while visualizing the shop-floor activities of a product family. Thus, this research included process variability (using DES) while augmenting the level of details of traditional VSM by fitting recorded observations into an appropriate probability distribution. Moreover, it developed a conceptual framework as a methodological approach aimed at integrating both enhanced VSM and DES. Fifth, the research investigated the dynamic impact of shop floor inventory of a product family over time on waiting time, throughput, and TPLT. The results illustrated that inventory (WIP) has a positive impact on waiting time and TPLT, but it has a negative impact on throughput. Hence, controlling inventory in the shop-floor is a crucial mechanism to reduce shop floor waste in the leather industry.
6.2. Managerial implications
This study has several managerial implications. First, it provides managerial insight into various industrial wastes and their impact on performance (lean metrics). It helps companies’ production, supply chain, marketing, and procurement manages to easily understand the types of waste that may be available on their shop floor and their impacts. Second, the findings of the study could assist managers (manufacturing sector) in alleviating shop floor problems of their companies. This helps be sensitive to the various wastes observed on the shop floor. Third, the research could assist the concerned government body (policy makers) to create awareness about the cumulative influence of industrial wastes on the operational efficiency of the manufacturing industry in general and the leather industry in particular. Thus, policy-makers could pay attention to shop floor waste while drafting policies and strategies to bring sustainable competitive advantage to the manufacturing sector.
7. Conclusion
The aim of this research was to the enhance operational efficiency of the leather manufacturing industry through a hybrid of value stream mapping and discrete event simulation. This research was conducted in the case of the XYZ leather company located in Addis Ababa, Ethiopia. It addressed both the limitations of the extant literature and the challenges faced by the company in a synchronized manner. Gemba-walk, interviews and company reports were used to collect the relevant data from the case company. Moreover, state of a art literature review was conducted to identify the widely used lean parameters/metrics for extending the details of current VSM and potential research gaps. Similarly, a conceptual framework was constructed to integrate VSM and DES.
A product matrix was used to categorize the leather products into product families. Therefore, a school bag (leather) was selected for this study. An assembly process chart was constructed. The ECSVSM was developed based on the collected shop floor data. The numerical results of ECSVSM in terms of VA, NVA, VA ratio, takt time and TPLT are 2198.244 s, 14.59 d, 0.54%, 230.1 s and 14.67 d, respectively. The data incorporated in the ECSVSM were used to develop a simulation model for the As-Is system. Similarly, the shop floor process variability was considered in the simulation model. The results of the As-Is simulation model experiment revealed that the back body, sub-assembly, RM inspection, assembly, and preparation processes are bottleneck processes and causes of waste, as compared to other processes of shop floor value streams. It also showed that inventory, waiting, over-production, transportation, defects, and motion waste are challenges for the company. According to the Pareto diagram analysis, waiting and inventory wastes were found to be major wastes on the shop floor.
Moreover, a simulation experiment was conducted to investigate the impact (dynamic behavior) of varying WIP inventory levels on the total waiting time, TPLT, and throughput. The results revealed that WIP levels have a positive impact on waiting time and TPLT, but a negative impact on throughput. Hence, to address the challenges of shop floor value streams, five scenarios were proposed. The results of the simulation experiment for each scenario were numerically computed in terms of the lean parameters. Accordingly, scenario four was selected as the best scenario. A To-Be simulation model was constructed based on the selected scenario. In addition, 5S, supermarket, and layout modifications were proposed and synchronized with the selected scenario to further enhance the quality of the proposed solution. The FSVSM was developed by incorporating the proposed solutions into the ECSVSM. Thus, NVA and TPLT resulted in FSVSM reductions of 42.9% and 42.72%, respectively. The VA ratio increased by 55.56% in the FSVSM. Moreover, transportation waste in the FSVSM was reduced by 46.76%. These results demonstrate that the major wastes were significantly reduced in the FSVSM through the proposed solutions. Similarly, the average utilization and operational efficiency of the FSVSM were enhanced by 28.58% and 8.16%, respectively. These results confirmed the application of lean tools, such as simulation based extended VSM, plays a vital role in reducing lean wastes and improving operational efficiency shop floor value streams at the leather industry. This research has substantial theoretical and managerial implications.
8. Limitation and future research agenda
This study has some limitations, similar to other research articles. This was limited to a single leather company. The results may not generalize to other companies in the industry without further replications. It was limited to visualizing only one component of the supply chain (the manufacturing component) under uncertainty (process variation). Moreover, the impacts of other LM tools, such as, JIT, Kanban, Poka–Yoke), Heijunka, SMED, TQM and TPM, on the reduction of lean waste in the leather industry were not studied in this research. While Zahraee (Citation2016) assessed these tools in Iranian manufacturing, the findings may not apply to other country contexts.
Finally, we propose the following future research agendas: (i) to increase generalizability of this study, further study needs to be conducted by considering the remaining supply chain components of leather industries with uncertainty using the technique applied in this research; (ii) empirical study needs to be done to investigate and prioritize the effect of abovementioned lean tools on LM implementation in leather industries and generalize the findings of similar previous research;(iii) validate findings on dynamic inventory behavior, wait times, throughput etc. through additional case studies in the leather sector;(iv) transparency in information and material flows of value streams of leather industry is essential to visualize entire value streams and identify areas of improvement. Hence, to improve information and material flows of value streams of the leather industry, the simulation based VSM need to be supported by I4.0 technologies such as, internet of things (IoT). Anosike et al. (Citation2021) argued the operational performance of manufacturing industries can be improved by integrating lean tools with IoT. Thus, exploring synergies between lean and Industry 4.0 integration would generate valuable insights to guide continuous process enhancements in the digital manufacturing era.
Notation
| CTmin | = | Minimum cycle time |
| CTave | = | Average cycle time |
| CTmax | = | Maximum cycle time |
| COave | = | Average change over time |
| NPI | = | Net product (raw material) input |
| NDP | = | Net defective products |
| NQPO | = | Net quality product output |
| AWT | = | Available working time |
| No. of shift | = | Number of shifts |
| No. of oper. | = | Number of operators |
| Ave. Energy cons. | = | Average energy consumption (KWh/pc) |
Authors contributions
The authors confirm contribution to the paper as follows: Conception and design: Wogiye Wube, Eshetie Berhan, and Daniel Kitaw; Data collection: Wogiye Wube; The drafting of the paper: Wogiye Wube and Gezahegn Tesfaye; Analysis and interpretation of the data: Wogiye Wube, Eshetie Berhan, Daniel Kitaw, and Gezahegn Tesfaye; Revising it critically for intellectual content: Wogiye Wube, Eshetie Berhan, Daniel Kitaw, and Gezahegn Tesfaye; The final approval of the version to be published: Wogiye Wube, Eshetie Berhan, Daniel Kitaw, and Gezahegn Tesfaye.
Data availability statement
The data that support the findings of this study are available from the corresponding author, upon reasonable request.
Disclosure statement
No potential conflict of interest was reported by the author(s).
Additional information
Notes on contributors
Wogiye Wube Woldemicael
Wogiye Wube Woldemicael is a PhD candidate in Mechanical Engineering at Addis Ababa University, Addis Ababa, Ethiopia. He holds an MSc. degree in Production Engineering and Management from Bahir Dar University, Bahir Dar, Ethiopia. His research interests include Lean manufacturing, Optimization, Closed -loop supply chain management, Artificial intelligence, Sustainable closed -loop supply chain management, Circular economy, and Operations management.
Eshetie Berhan
Eshetie Berhan is currently an Associate Professor of Industrial Engineering at Addis Ababa University with a PhD in Mechanical Engineering. He has published several research papers in leading journals. He has served as a Director of Research, Technology Transfer, and University Industry Linkage at Addis Ababa Institute of Technology, Addis Ababa university. His research interests include Simulation, Marketing management, Optimization, Logistics, Production planning, Operations management, Supply chain management, and Artificial intelligence.
Daniel Kitaw
Daniel Kitaw is currently Professor of Industrial Engineering at Addis Ababa University with a PhD in Industrial Engineering. He has published several research papers in leading journals. He has served as a department head at Addis Ababa University. He has been participating in many projects at national level. His research interests involve Quality management, Logistics, Inventory management, Production planning, Production and operations management, and Lean manufacturing.
Gezahegn Tesfaye
Gezahegn Tesfaye is an Assistant Professor of Industrial Engineering at Addis Ababa University. He holds PhD in Mechanical Engineering from Addis Ababa University. Currently, he is a department head at Addis Ababa University. He has published 11 papers in the peer-reviewed journals. His research interests include Quality management, Sustainable supply chain, Product-life cycle management, Innovation systems, and Linear programing.
References
- Abdulmalek, F. A., & Rajgopal, J. (2007). Analyzing the benefits of lean manufacturing and value stream mapping via simulation : A process sector case study. International Journal of Production Economics, 107(1), 223–236. https://doi.org/10.1016/j.ijpe.2006.09.009
- Agyapong-Kodua, K., Ajaefobi, J. O., & Weston, R. H. (2009). Modelling dynamic value streams in support of process design and evaluation. International Journal of Computer Integrated Manufacturing, 22(5), 411–427. https://doi.org/10.1080/09511920802527574
- Akçagün, E., Dal, V., & Yilmaz, A. (2012). Using value stream mapping at apparel industry : a case study using value stream mapping at apparel industry: a case study. 6th International Textile, Clothing & Design Conference - Magic World of Textiles.
- Alaya, L. B. F. (2016). VSM a powerful diagnostic and planning tool for a successful Lean implementation: a Tunisian case study of an auto parts manufacturing firm Tunisian case study of an auto parts manufacturing firm *. Production Planning & Control, 27(7–8), 1–16. https://doi.org/10.1080/09537287.2016.1165305
- Ali, S. M., Haque, M. N., Sarker, R., Kandasamy, J., & Vlachos, I. (2024). Improving changeover techniques in apparel manufacturing through single minute exchange of die: implications for benchmarking. Benchmarking: An International Journal, 31(6), 1–17. https://doi.org/10.1108/BIJ-11-2022-0718
- Alvandi, S., Li, W., Schönemann, M., Kara, S., & Herrmann, C. (2016). Economic and environmental value stream map (E2VSM) simulation for multi-product manufacturing systems. International Journal of Sustainable Engineering, 9(6), 354–362. https://doi.org/10.1080/19397038.2016.1161095
- Andrade, P. F., Pereira, V. G., & Del Conte, E. G. (2016). Value stream mapping and lean simulation: a case study in automotive company. The International Journal of Advanced Manufacturing Technology, 85(1-4), 547–555. https://doi.org/10.1007/s00170-015-7972-7
- Andreadis, E., Garza-reyes, J. A., & Kumar, V. (2017). Towards a conceptual framework for value stream mapping (VSM) implementation: an investigation of managerial factors. International Journal of Production Research, 55(23), 7073–7095. https://doi.org/10.1080/00207543.2017.1347302
- Anosike, A., Alafropatis, K., Garza-Reyes, J. A., Kumar, A., Luthra, S., & Rocha-Lona, L. (2021). Computers in Industry Lean manufacturing and internet of things – A synergetic or antagonist relationship ? Computers in Industry, 129, 103464. https://doi.org/10.1016/j.compind.2021.103464
- Atieh, A. M., Kaylani, H., Almuhtady, A., & Al-Tamimi, O. (2015). A value stream mapping and simulation hybrid approach: application to glass industry. The International Journal of Advanced Manufacturing Technology, 84(5–8), 1573–1586. https://doi.org/10.1007/s00170-015-7805-8
- Aziz, Z., Qasim, R. M., & Wajdi, S. (2017). Improving productivity of road surfacing operations using value stream mapping and discrete event simulation. Construction Innovation, 17(3), 294–323. https://doi.org/10.1108/CI-11-2016-0058
- Bait, S., Di Pietro, A., & Schiraldi, M. M. (2020). Waste reduction in production processes through simulation and VSM. Sustainability, 12(8), 3291. https://doi.org/10.3390/su12083291
- Banks, J., Carson, J., Nelson, B. L., & Nicol, D. (2005). Discrete-event system simulation. In J. H. Fabrycky, and W. J. Mize (Ed.), Prentice hall international series in industrial and systems engineering (4th ed.). Prentice Hall.
- Bashar, A., Hasin, A. A., Sakib, N., & Bashar, N. B. (2024). Lean implementation barriers in the apparel industry in Bangladesh. International Journal of Lean Six Sigma, 15(4), 906–924. https://doi.org/10.1108/IJLSS-12-2022-0249
- Baumer-Cardoso, M. I., Campos, L. M. S., Pfeifer, P., Santos, P., & Frazzon, M. E. (2020). Simulation-based analysis of catalyzers and trade-offs in Lean & Green manufacturing. Journal of Cleaner Production, 242, 118411. https://doi.org/10.1016/j.jclepro.2019.118411
- Berhe, H. H., Gebremichael, H. S., & Tsegay, B. K. (2023). Development, validation and verification of innovative integrated Kaizen philosophy (CI) framework and its implementation procedure for enhancing manufacturing industries sustainable competitiveness. International Journal of Quality & Reliability Management, 40(10), 2463–2518. https://doi.org/10.1108/IJQRM-08-2022-0258
- Braglia, M., Carmignani, G., & Zammori, F. (2006). A new value stream mapping approach for complex production systems. International Journal of Production Research, 44(18–19), 3929–3952. https://doi.org/10.1080/00207540600690545
- Braglia, M., Frosolini, M., & Zammori, F. (2009). A leading journal of supply chain management uncertainty in value stream mapping analysis. International Journal of Logistics Research and Applications, 12(6), 435–453. https://doi.org/10.1080/13675560802601559
- Brandimarte, P. (2014). Handbook in Monte Carlo simulation applications in financial engineering, risk management, and economics (Vol. 59). John Wiley & Sons, Inc.
- Busert, T., & Fay, A. (2021). Information quality focused value stream mapping for the coordination and control of production processes. International Journal of Production Research, 59(15), 4559–4578. https://doi.org/10.1080/00207543.2020.1766720
- Cabrera, J., Corpus, O., Maradiegue, F., & Merino, J. C. A. (2020). Improving quality by implementing lean manufacturing, SPC, and HACCP in the food industry: a case study. South African Journal of Industrial Engineering, 31(4), 194–207. https://doi.org/10.7166/31-4-2363
- Caldas-Miguel, J., Carvallo-Munar, E., Leon-Chavarri, C., Raymundo, C., Mamani-Macedo, N., & Dominguez, F. (2020). Purchasing and quality management lean manufacturing model for the optimization of delivery times in SMEs in the food sector. 2020 International Conference on Applied Human Factors and Ergonomics (pp. 478–485). https://doi.org/10.1007/978-3-030-50791-6_61
- Correia, D., Silva, F. J. G., Gouveia, R. M., Pereira, T., & Ferreira, L. P. (2018). Improving manual assembly lines devoted to complex electronic. Procedia Manufacturing, 17, 663–671. https://doi.org/10.1016/j.promfg.2018.10.115
- De Souza, L. B., Tortorella, G. L., Cauchick-Miguel, P. A., & Nascimento, D. (2018). Application of value stream mapping and Monte Carlo simulation in a university hospital. Proceedings of the International Conference on Industrial Engineering and Operations Management (pp. 596–606).
- Dhingra, A. K., Kumar, S., & Singh, B. (2019). Cost reduction and quality improvement through Lean-Kaizen concept using value stream map in Indian manufacturing firms. International Journal of System Assurance Engineering and Management, 10(4), 792–800. https://doi.org/10.1007/s13198-019-00810-z
- Dhiravidamani, P., Ramkumar, A. S., Ponnambalam, S. G., & Subramanian, N. (2018). Implementation of lean manufacturing and lean audit system in an auto parts manufacturing industry – An industrial case study. International Journal of Computer Integrated Manufacturing, 31(6), 579–594. https://doi.org/10.1080/0951192X.2017.1356473
- Dinis-Carvalho, J., Moreira, F., Bragança, S., Costa, E., & Alves, A. (2014). Waste identification diagrams. Production Planning & Control, 26(3), 235–247. https://doi.org/10.1080/09537287.2014.891059
- Dom, D., Mendoza-Muñoz, I., Montoya-Reyes, M. I., Vargas-Bernal, O. Y., & Jacobo-Galicia, G. (2023). Design and implementation of integral ergo-value stream mapping in a metal-mechanical company to improve ergonomic and productive conditions: A case study. Logistics, 7(4), 100. https://doi.org/10.3390/logistics7040100
- Fortier, P. J., & Michel, H. E. (2003). Computer systems performance evaluation and prediction (Vol. 59). Digital Press.
- Gavriluţă, A. C., Niţu, E. L., & Gavriluţă, C. A. (2021). Algorithm to use some specific lean manufacturing methods: Application in an industrial production process. Processes, 9(4), 641. https://doi.org/10.3390/pr9040641
- Gebeyehu, S. G., Abebe, M., & Gochel, A. (2022). Production lead time improvement through lean manufacturing. Cogent Engineering, 9(1),2034255. https://doi.org/10.1080/23311916.2022.2034255
- Grewal, C. (2008). An initiative to implement lean manufacturing using value stream mapping in a small company. International Journal of Manufacturing Technology and Management, 15(3/4), 404–417. https://doi.org/10.1504/IJMTM.2008.020176
- Gunter, K. (2004). Inventory and value management in demanufacturing facilities. Michigan Technological University.
- Gupta, A., & Kundra, T. K. (2012). A review of designing machine tool for leanness. Sadhana, 37(2), 241–259. https://doi.org/10.1007/s12046-012-0062-8
- Gurumurthy, A., & Kodali, R. (2011). Design of lean manufacturing systems using value stream mapping with simulation A case study. Journal of Manufacturing Technology Management, 22(4), 444–473. https://doi.org/10.1108/17410381111126409
- Helleno, A. L., Pimentel, C. A., Ferro, R., Santos, P. F., Oliveira, M. C., & Simon, A. T. (2015). Integrating value stream mapping and discrete events simulation as decision making tools in operation management. The International Journal of Advanced Manufacturing Technology, 80(5-8), 1059–1066. https://doi.org/10.1007/s00170-015-7087-1
- Heravi, G., & Firoozi, M. (2017). Production process improvement of buildings’ prefabricated steel frames using value stream mapping. The International Journal of Advanced Manufacturing Technology, 89(9-12), 3307–3321. https://doi.org/10.1007/s00170-016-9306-9
- Hmidach, S., Kihel, B. E., Kihel, Y. E., Amegouz, D., & Regad, Y. (2020). Optimizing warehouse logistics flows by integrating new technologies: Case study of an agri-food industry. 2020 IEEE 2nd International Conference on Electronics, Control, Optimization and Computer Science (ICECOCS) (pp. 1–5). https://doi.org/10.1109/ICECOCS50124.2020.9314501
- Issa, T. N. (2023). Implementing lean-kaizen for manufacturing operations improvement: a case-study in the plastics industry. International Journal of Industrial and Systems Engineering, 44(1), 118–139. https://doi.org/10.1504/IJISE.2023.130917
- Jasti, N. V. K., & Sharma, A. (2014). Lean manufacturing implementation using value stream mapping as a tool: A case study from auto components industry. International Journal of Lean Six Sigma, 5(1), 89–116. https://doi.org/10.1108/IJLSS-04-2012-0002
- Kaswan, M. S., Rathi, R., & Singh, M. (2019). Just in time elements extraction and prioritization for health care unit using decision making approach. International Journal of Quality & Reliability Management, 36(7), 1243–1263. https://doi.org/10.1108/IJQRM-08-2018-0208
- Katsigiannis, M., Pantelidakis, M., & Mykoniatis, K. (2024). Assessing the transition from mass production to lean manufacturing using a hybrid simulation model of a LEGO V automotive assembly line. International Journal of Lean Six Sigma, 15(2), 220–246. https://doi.org/10.1108/IJLSS-07-2022-0165
- Kelton, W. D., Sadowski, R. P., & Swets, N. B. (2010). Simulation with ARENA. 5th ed. New York: McGraw- Hill, 1–656.
- Khadijah, M., & Pratama, N. R. (2023). Implementation of lean manufacturing to reduce production cycle times and CO2 emission in gate-to-gate life cycle assessment in the biodegradable plastic industry. Proceedings of the 4th South American International Industrial Engineering and Operations Management, (pp. 568–579).
- Khalid, N. K., Hashim, A. Y., & Salleh, M. R. (2014). On value stream mapping and its industrial significance. Journal of Industrial and Intelligent information, 2(2), 88–90. https://doi.org/10.12720/jiii.2.2.88-90
- Kohata-Tirado, R., Morales-Arce, S., & Collao-Díaz, M. F. (2023). Production model based on 5S and SLP to improve efficiency in a food industry company. Proceedings of the 4th African International Conference on Industrial Engineering and Operations Management (pp. 69–81). https://doi.org/10.46254/AF04.20230014
- Kumar, D. V., Mohan, G. M., & Mohanasundaram, K. M. (2020). Lean supply chain management in garment industry using value stream mapping. International Journal of Services and Operations Management, 37(1), 133–143. https://doi.org/10.1504/IJSOM.2020.109440
- Kumar, S., Dhingra, A. K., & Singh, B. (2018a). Cost reduction by value stream mapping using Lean-Kaizen concept: A case study. International Journal of Productivity and Quality Management, 24(1), 12–32. https://doi.org/10.1504/IJPQM.2018.091166
- Kumar, S., Dhingra, A. K., & Singh, B. (2018b). Process improvement through Lean-Kaizen using value stream map: A case study in India. The International Journal of Advanced Manufacturing Technology, 96(5-8), 2687–2698. https://doi.org/10.1007/s00170-018-1684-8
- Kumar, S., Marawar, Y., Soni, G., Jain, V., Gurumurthy, A., & Kodali, R. (2023). A hybrid approach to enhancing the performance of manufacturing organizations by optimal sequencing of value stream mapping tools. International Journal of Lean Six Sigma, 14(7), 1403–1430. https://doi.org/10.1108/IJLSS-03-2022-0069
- Kumar, V., Shirodkar, P. S., Camelio, J. A., & Sutherland, J. W. (2007). Value flow characterization during product lifecycle to assist in recovery decisions. International Journal of Production Research, 45(18-19), 4555–4572. https://doi.org/10.1080/00207540701474633
- Lacerda, A. P., Xambre, A. R., & Alvelos, H. M. (2016). A value model for use in environmentally conscious design and manufacturing. International Journal of Production Research, 54(6), 1708–1720. https://doi.org/10.1080/00207543.2015.1055349
- Liu, Q., & Yang, H. (2020). An improved value stream mapping to prioritize lean optimization scenarios using simulation and multiple-attribute decision-making method. IEEE Access, 8, 204914–204930. https://doi.org/10.1109/ACCESS.2020.3037660
- Liu, Q., & Yang, H. (2020). Incorporating variability in lean manufacturing: A fuzzy value stream mapping approach. Mathematical Problems in Engineering, 2020, 1–17. https://doi.org/10.1155/2020/1347054
- Liu, Q., Yang, H., & Xin, Y. (2020). Applying value stream mapping in an unbalanced production line: A case study of a Chinese food processing enterprise. Quality Engineering, 32(1), 111–123. https://doi.org/10.1080/08982112.2019.1637526
- Lu, J. C., Yang, T., & Wang, C. Y. (2011). A lean pull system design analysed by value stream mapping and multiple criteria decision-making method under demand uncertainty. International Journal of Computer Integrated Manufacturing, 24(3), 211–228. https://doi.org/10.1080/0951192X.2010.551283
- Luz, G. P., Tortorella, G. L., Bouzon, M., Garza-Reyes, J., & Gaiardelli, P. (2022). Proposition of a method for stochastic analysis of value streams. Production Planning & Control, 33(8), 741–757. https://doi.org/10.1080/09537287.2020.1833377
- Luz, G. P., Tortorella, G. L., Gaiardelli, P., Sawhney, R., Preuss, G., & Tortorella, G. L. (2021). The Management of Operations A systematic literature review on the stochastic analysis of value streams. Production Planning & Control, 32(2), 121–131. https://doi.org/10.1080/09537287.2020.1713414
- McDonald, T., Van Aken, E. M., & Rentes, A. F. (2002). A leading journal of supply chain utilising simulation to enhance value stream mapping: A manufacturing case application. International Journal of Logistics Research and Applications, 5(2), 213–232. https://doi.org/10.1080/13675560210148696
- Mohanraj, R., Sakthivel, M., Vinodh, S., & Vimal, K. E. K. (2015). A framework for VSM integrated with Fuzzy QFD. The TQM Journal, 27(5), 616–632. https://doi.org/10.1108/TQM-11-2012-0088
- Mullisa, A. G., & Abdul-Kader, W. (2023). Performance improvement: A lean manufacturing case of metal tools factory. International Journal of Industrial and Systems Engineering, 44(4), 475–498. https://doi.org/10.1504/IJISE.2023.132721
- Myint, K., & Smutkupt, S. (2022). The improvement of the non-value-added activities in the 3-in-1 instant food production process by applying lean tools. Journal of Supply Chain Management, 16(2), 35–43.
- Oliveira, J., Sá, J. C., & Fernandes, A. (2017). Continuous improvement through “Lean Tools”: An application in a mechanical company. Procedia Manufacturing, 13, 1082–1089. https://doi.org/10.1016/j.promfg.2017.09.139
- Ortegon, K. E. (2014). Value characterization across the life cycle: A model to support value recovery from used wind turbines. Purdue University.
- Papetti, A., Menghi, R., Di, G., Germani, M., & Marconi, M. (2019). Resources value mapping : A method to assess the resource efficiency of manufacturing systems. Applied Energy, 249, 326–342. https://doi.org/10.1016/j.apenergy.2019.04.158
- Patil, A. S., Pisal, M. V., & Suryavanshi, C. T. (2021). Application of value stream mapping to enhance productivity by reducing manufacturing lead time in a manufacturing company: A case study. Journal of Applied Research and Technology, 19(1), 11–22. https://doi.org/10.22201/icat.24486736e.2021.19.1.1488
- Pérez, M. P., Rodríguez, Á. T. P., Martínez, E. M., & de la, P. (2022). Contribution to the sustainability of the plastics industry in Cuba through maintenance management. IFAC PapersOnLine, 55(10), 1918–1923. https://doi.org/10.1016/j.ifacol.2022.09.679
- Prasad, M. M., Dhiyaneswari, J. M., Jamaan, J. R., Mythreyan, S., & Sutharsan, S. M. (2020). A framework for lean manufacturing implementation in Indian textile industry. Materials Today, 33, 2986–2995. https://doi.org/10.1016/j.matpr.2020.02.979
- Ramani, P. V., & Lingan, L. K. (2022). Developing a lean model to reduce the design process cost of gas insulated switchgear foundation using value stream mapping – A case study. International Journal of Construction Management, 22(4), 669–677. https://doi.org/10.1080/15623599.2019.1644756
- Reda, H., & Dvivedi, A. (2022a). Application of value stream mapping (VSM) in low-level technology organizations: A case study. International Journal of Productivity and Performance Management, 71(6), 2393–2409. https://doi.org/10.1108/IJPPM-03-2021-0118
- Reda, H., & Dvivedi, A. (2022b). Decision-making on the selection of lean tools using fuzzy QFD and FMEA approach in the manufacturing industry. Expert Systems with Applications, 192, 116416. https://doi.org/10.1016/j.eswa.2021.116416
- Reda, H., & Dvivedi, A. (2023). Performance analysis of the footwear manufacturing assembly line: a case study using value stream mapping-simulation modelling. International Journal of Business Excellence, 31(3), 333–354. https://doi.org/10.1504/IJBEX.2023.134822
- Rother, M., & Shook, J. (1999). Learning to see (1st ed.). Lean Enterprise Institute.
- Saad, M., Idrees, M. D., Ansari, A., Sami, A., & Sajid, N. (2021). Improvement in the production process through value stream mapping in the textile industry. International Journal of Scientific and Technology Research, 10(05), 411–412.
- Salwin, M., Jacyna-Gołda, I., Bańka, M., Varanchuk, D., & Gavina, A. (2021). Using value stream mapping to eliminate waste: A case study of a steel pipe manufacturer. Energies, 14(12), 3527. https://doi.org/10.3390/en14123527
- Sangwa, N. R., & Sangwan, K. S. (2023). Leanness assessment of a complex assembly line using integrated value stream mapping : a case study. The TQM Journal, 35(4), 893–923. https://doi.org/10.1108/TQM-12-2021-0369
- Santosa, W. A., & Sugarindra, M. (2018). Implementation of lean manufacturing to reduce waste in production line with value stream mapping approach and Kaizen in division sanding upright piano, case study in: PT. X. MATEC Web of Conferences, 154, 01095. https://doi.org/10.1051/matecconf/201815401095
- Saravanan, V., Nallusamy, S., & George, A. (2018). Efficiency enhancement in a medium scale gearbox manufacturing company through different lean tools – A case study. International Journal of Engineering Research in Africa, 34, 128–138. https://doi.org/10.4028/www.scientific.net/JERA.34.128
- Schmidtke, D., Heiser, U., & Hinrichsen, O. (2014). A simulation-enhanced value stream mapping approach for optimisation of complex production environments. International Journal of Production Research, 52(20), 6146–6160. https://doi.org/10.1080/00207543.2014.917770
- Schoeman, Y., Oberholster, P., & Somerset, V. (2020). Value stream mapping as a supporting management tool to identify the flow of industrial waste: A case study. Sustainability, 13(1), 91. https://doi.org/10.3390/su13010091
- Seth, D., Seth, N., & Dhariwal, P. (2017). Application of value stream mapping (VSM) for lean and cycle time reduction in complex production environments: a case study. Production Planning & Control, 28(5), 398–419. https://doi.org/10.1080/09537287.2017.1300352
- Seth, D., Seth, N., & Goel, D. (2008). Application of value stream mapping for minimization of wastes in the processing side of supply chain of cotton seed oil industry in Indian context. Journal of Manufacturing Technology Management, 19(4), 529–550. https://doi.org/10.1108/17410380810869950
- Seyedhosseini, S. M., Taleghani, A. E., Makui, A., & Ghoreyshi, S. M. (2013). Fuzzy value stream mapping in multiple production streams: A case study in a parts manufacturing company. International Journal of Management Science and Engineering Management, 8(1), 56–66. https://doi.org/10.1080/17509653.2013.783190
- Shirodkar, P. S., Kumar, V., Jarvie, M. E., & Sutherland, J. W. (2006). Exploring value flow in the product life cycle to promote successful value recovery. Proceedings of Sustainable Manufacturing IV - Global Conference on Sustainable Product Development and Life Cycle Engineering, Sao Carlos, Sao Paulo, Brazil. LCA02.
- Singh, B., & Sharma, S. K. (2009). Value stream mapping as a versatile tool for lean implementation: An Indian case study of a manufacturing firm. Measuring Business Excellence, 13(3), 58–68. https://doi.org/10.1108/13683040910984338
- Singh, H., & Singh, A. (2013). Application of lean manufacturing using value stream mapping in an auto-parts manufacturing unit. Journal of Advances in Management Research, 10(1), 72–84. https://doi.org/10.1108/09727981311327776
- Solding, P., & Gullander, P. (2009). Concepts for simulation based value stream mapping. Proceedings of the 2009 Winter Simulation Conference (pp. 2231–2237).
- Sophian, A., Hasbullah, H., & Shaleh, I. (2022). Increasing production yield with a visual stream mapping (VSM) in the plastic material recycling industry. The International Conference on Industrial Engineering and Operations Management (pp. 1755–1763).
- Stadnicka, D., & Litwin, P. (2019). Value stream mapping and system dynamics integration for manufacturing line modelling and analysis. International Journal of Production Economics, 208, 400–411. https://doi.org/10.1016/j.ijpe.2018.12.011
- Sudhakara, P. R., Sałek, R., Venkat, D., & Chruzik, K. (2020). Management of non-value-added activities to minimize lead time using value stream mapping in the steel industry. Acta Montanistica Slovaca, 25(3), 444–454. https://doi.org/10.46544/AMS.v25i3.15
- Suhardi, B., Hermas Putri, K. S. M., Jauhari, W. A., & Ramirez, F. J. (2020). Implementation of value stream mapping to reduce waste in a textile products industry Implementation of value stream mapping to reduce waste in a textile products industry. Cogent Engineering, 7(1), 1842148. https://doi.org/10.1080/23311916.2020.1842148
- Sutherland, J. W., Daniel, C. M., Vadrevu, S., & Olson, W. W. (1997). Evaluating reuse and remanufacturing potential using a simple model for product value, concurrent product design and environmentally conscious manufacturing. Journal of Manufacturing Science and Engineering (ASME), 89, 263–274. https://doi.org/10.1115/IMECE1997-0025
- Toki, G. F. I., Ahmed, T., Hossain, M. E., Alave, R. K. K., Faruk, M. O., Mia, R., & Islam, S. R. (2023). Single minute exchange die (SMED): A sustainable and well-timed approach for Bangladeshi garments industry. Cleaner Engineering and Technology, 12, 100592. https://doi.org/10.1016/j.clet.2022.100592
- Utama, D. M., & Abirfatin, M. (2023). Sustainable lean six-sigma: A new framework for improve sustainable manufacturing performance. Cleaner Engineering and Technology, 17, 100700. https://doi.org/10.1016/j.clet.2023.100700
- Vadrevu, S., Sutherland, J. W., & Olson, W. W. (1994). A value model for use in environmentally conscious design and manufacturing. Manufacturing Science and Engineering, 68–1, 93–102.
- Venkataraman, K., Ramnath, B. V., Kumar, V. M., & Elanchezhian, C. (2014). Application of value stream mapping for reduction of cycle time in a machining process. Procedia Materials Science, 6, 1187–1196. https://doi.org/10.1016/j.mspro.2014.07.192
- Vinodh, S., Arvind, K. R., & Somanaathan, M. (2010). Application of value stream mapping in an Indian camshaft manufacturing organisation. Journal of Manufacturing Technology Management, 21(7), 888–900. https://doi.org/10.1108/17410381011077973
- Wen, X., Cao, H., Hon, B., Chen, E., & Li, H. (2021). Energy value mapping: A novel lean method to integrate energy efficiency into production management. Energy, 217, 119353. https://doi.org/10.1016/j.energy.2020.119353
- Yiicesan, E., Chen, C., L, J. S., & Chornes, J. M. (2002). The current and future status of simulation software. 2002 Winter Simulation Conference (pp. 1633–1640).
- Yildiz, E. Z., & Güner, M. (2013). Applying value stream mapping technique in apparel industry. Tekstil ve Konfeksiyon, 23(3), 393–400.
- Yuvamitra, K., Lee, J., & Dong, K. (2017). Value stream mapping of rope manufacturing: A case study. International Journal of Manufacturing Engineering, 2017, 1–11. https://doi.org/10.1155/2017/8674187
- Zahraee, S. M. (2016). A survey on lean manufacturing implementation in a selected manufacturing industry in Iran. International Journal of Lean Six Sigma, 7(2), 136–148. https://doi.org/10.1108/IJLSS-03-2015-0010
- Zahraee, S. M., Tolooie, A., Abrishami, S. J., Shiwakoti, N., & Stasinopoulos, P. (2020). Lean manufacturing analysis of a Heater industry based on value stream mapping and computer simulation. Procedia Manufacturing, 51(2019), 1379–1386. https://doi.org/10.1016/j.promfg.2020.10.192