
Abstract
The rapid expansion of technical infrastructure has brought about transformative changes in business operations. A notable consequence of this digital evolution is the proliferation of subscription-based services. With an increasing array of options for goods and services, customer churn has emerged as a significant challenge, posing a threat to businesses across sectors. The direct impact on earnings has prompted businesses to proactively develop tools for predicting potential client turnover. Identifying the underlying factors contributing to churn is crucial for implementing effective retention strategies. Our research makes a pivotal contribution by presenting a churn prediction model designed to assist businesses in identifying clients at risk of churn. The proposed model leverages machine learning classification techniques, with the customer data undergoing thorough pre-processing phases prior to model application. We systematically evaluated ten classification techniques, including Logistic Regression, Support Vector Classifier, Kernel SVM, KNN, Gaussian Naïve Bayes, Decision Tree Classifier, Random Forest, ADA Boost, XGBoost, and Gradient Boost. The assessment encompassed various evaluation metrics, such as ROC AUC Mean, ROC AUC STD, Accuracy Mean, Accuracy STD, Accuracy, Precision, Recall, F1 Score, and F2 Score. Employing 10-fold cross-validation and hyper parameter tuning through GridSearchCV and RandomizedSearchCV, we identified Random Forest as the most effective classifier, achieving an 85% Area Under the Curve (AUC) for optimal results.
1. Introduction
The cornerstone of business success lies in understanding the factors driving customer behaviour, whether it involves increased engagement or attrition. The initial crucial step toward gaining this insight is analysing customer movements, particularly identifying those who are transitioning their business elsewhere. This analytical endeavour enables a deeper exploration into the trends associated with departing consumers, facilitating the identification of improvement areas and the implementation of strategies to prevent further customer loss. A pervasive and challenging concern for organizations globally, spanning credit card companies, cable service providers, and telecommunication corporations, is the phenomenon of customer churn. Customer churn, defined as the percentage of customers discontinuing the use of a company’s goods or services within a specific time frame, poses a substantial challenge. This paper delves into the critical process of customer churn analysis as a method for quantifying and understanding this rate of customer attrition. It is the process of using your churn data to understand:
Which clients are quitting?
Why do they leave?
Which clients are most likely to leave soon?
What can you do to reduce churn?
The important reasons that a company should prioritizing customer churn analysis are
Shows product’s strengths and weaknesses
Uncovers opportunities for better communication
The churn rate reveals what percentage of customers discontinue business over time
Helps you predict and reduce further churn
Acts as a weapon during a crisis
Assists companies in understanding why customers don’t come back for more transactions
Addressing the challenge of customer churn involves adopting either a proactive or reactive approach. The proactive method aims to predict customer churn before the consumer terminates their association with the company, in contrast to the reactive approach, which responds only after the client cancels a subscription. Identifying and classifying customers into churners and non-churners would enable businesses to effectively target the churner group, offering incentives and fortifying relationships. Historically, businesses often relied on a reactive approach, extending incentives to clients only after they had already left, primarily due to technological limitations. However, contemporary advancements in technology empower businesses to embrace a proactive strategy, allowing them to forecast customer churn well in advance. This forecasting approach not only mitigates churn but also enhances business profitability (De et al., Citation2021). Leveraging machine learning methods can further refine predictive models, unveil customer behaviors, and empower businesses to make informed decisions based on extracted data insights (Mukhopadhyay et al., Citation2021). This paper analyzes the performance of different classification models of machine learning for predicting the customer churn. The performance of the models is evaluated using k-fold cross validation, AUC curves and other metrics.
The literature study section serves as a comprehensive exploration and synthesis of existing scholarly works relevant to the customer churn prediction. This section delves into the body of knowledge surrounding the subject, providing a historical context, theoretical frameworks, and empirical findings. Section 3 involves a systematic exploration and interpretation of the gathered data, employing statistical methods, visualizations, and analytical tools. The data analysis chapter not only presents descriptive statistics and patterns but also employs inferential statistics to draw conclusions about the broader population from which the data was sampled. The classification models section systematically explores and evaluates ten classification algorithms, such as decision trees, random forest, support vector machines, logistic regression, XGboost and neural networks, among others. The result analyzed in Section 5, where the outcomes of the study are comprehensively examined, interpreted, and discussed. This section not only contributes to the depth of understanding results generated by the classification methods, but also lays the groundwork for drawing meaningful conclusions and implications. The conclusions section serves as the culmination of the study, offering a synthesis of key findings and their broader implications.
2. Literature study
Customer churn prediction has been a popular study topic, especially in the telecom sector due its importance (Amin et al., Citation2017; Azeem et al., Citation2017; Coussement et al., Citation2017; Zhao et al., Citation2017). Numerous machine learning algorithms that combine multiple classifiers and individual classifiers have been researched in the literature (De Bock & Van den Poel, Citation2011; Lu et al., Citation2014; Tsai & Lu, Citation2009). The majority of the initial methods for solving this problem were centered on using individual classifiers, such as DT-based strategies, ANNs, and other statistical techniques (Dahiya & Bhatia, Citation2015; Kisioglu & Topcu, Citation2011; Qureshi et al., Citation2013; Sharma et al., Citation2011; Sharma et al., Citation2023).
With the help of the K Nearest Neighbor algorithm and Pearson Correlation, Sjarif et al. (Citation2019) proposed a method for predicting customer churn. Using a training and testing dataset with a 70:30 ratio, the algorithm is validated. Based on the results, it can be concluded that the K Nearest Neighbor algorithm outperforms the others.
For the purpose of predicting churn, Sjarif et al. (Citation2020) proposed the Multilayer Perceptron Method. In terms of a number of factors, the evaluation is contrasted with three classifiers, including Support Vector Machine, Naive Bayes, and Decision Tree. To determine the correlation between all the variables during the preprocessing phase, used normalization and Principal Component Analysis. Multilayer Perceptron is proven to perform better than other classifiers, and an international strategy is crucial to keeping customers from defecting to the company.
Rencheng Liu et al. (Citation2022) proposed an ensemble system-based customer churn prediction (CCP) that completely incorporates clustering and classification learning approaches. The initial evaluation of churn prediction datasets involves employing several clustering techniques, such as k-means, k-medoids, and random clustering. Subsequently, the system’s performance is evaluated using diverse ensemble techniques to enhance overall outcomes. The classifiers such as Gradient Boosted Tree (GBT), Decision Tree (DT), Random Forest (RF), Deep Learning (DL), and Naive Bayes (NB), are merged with the clustering techniques previously mentioned. The experimental results show that the stacking-based hybrid model (k-medoids-GBT-DT-DL) achieves the highest accuracy levels when compared to the bagging ensemble technique.
A revision on the advance of exclusive hybrid approaches for integrating numerous ensemble representations utilizing the ‘over manufacture and choose approach’ is presented by Ahmed et al. (Citation2020). The recommended ensemble methods are combinations of additional ensembles, as opposed to the basic concept of ensembles that combine different learners. It is suggested that two of these models, Boosted-Stacked Learners and Bagged-Stacked Learners, perform better than regular ensembles. A benchmark customer turnover dataset from the UCI repository is used in the experiments, together with a newly constructed dataset from a South Asian wireless telecom operator known as SATO. The innovative Boosted-Stacked learner and Bagged-Stacked learner outperformed existing state-of-the-art techniques in terms of accuracy.
Brena et al. (Citation2021) proposed a supervised machine-learning method to automatically evaluate both fluency and pronunciation of non-native English speakers. Several classifiers were trained to predict the level of a non-native English speaker based on the audio segments. The trained classifiers were tested for accuracy, precision, and other measures, and promising results were obtained, with accuracy values of 94% for fluency and 99.9% for pronunciation.
Given their superior performance across various tasks in comparison to traditional classifiers, ensemble approaches have garnered considerable research interest. Numerous ensembles have been applied in the field of Customer Churn Prediction, yielding outcomes that surpass those achieved by individual classifiers (Athanasopoulos et al., Citation2017; Blouin et al., Citation2016; Wang et al., Citation2016; Zhang et al., Citation2016).
By concentrating on user intents and defining the changes in prospect purposes for current carriers or services with regard to user intention, Nishimatsu and Inoue (Citation2023) aimed to create a method for extracting useful information for service sale policies. The authors provide a framework for user intent-based segmentation with the aim of understanding the existing market structure and developing appropriate service sales tactics for each category.
3. Data analysis
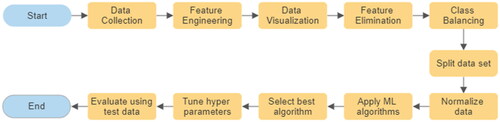
One of the biggest challenges is the quality of the data used in machine learning algorithms. The consistency, completeness, and quality of the data have an impact on the results’ accuracy. Results could be erroneous as a consequence of errors, omissions, duplications, or inconsistencies in the data. Furthermore, it may be difficult to fully comprehend the data if any attributes or values are missing from it, making it incomplete. shows the steps in the suggested model. Details of these steps are explained in the following sub-sections.
Figure 1. Steps in the proposed model.
3.1. Description of dataset
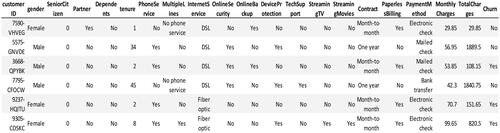
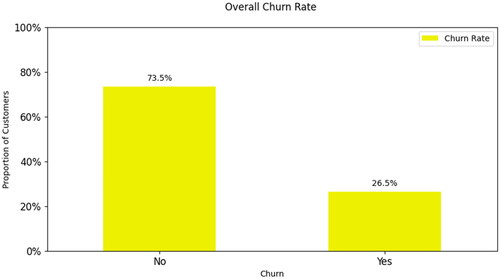
The dataset used in this study is collected from the Kaggle website. The dataset is with 7043 instances with 21 features including 20 independent and one dependent feature – Churn. Some of the important features of a customer includes – Gender, Senior Citizen, Tenure, Phone Service, Multiple Lines, Internet Service, Online Security, Online eBackup, Tech Support, Contract, Payment Method, Monthly charges etc., A sample dataset is presented in . Among 7043 instances, 5174 are with churn as No and 1869 are with churn as Yes. This clearly shows that the dataset is imbalance with 73.5% of churn as No and 26.5% of churn as Yes.
Figure 2. Dataset.
3.2. Data transformation/feature engineering
Among the features in the dataset, only 3 features are numeric and remaining 18 features are non-numeric which are to be encoded in to numerical format. The null or missing values in the numeric columns are filled with mean of the respective column. Label Encoder is applied on 6 features which are with two unique values and the assigned values are 0, 1. The remaining categorical features are encoded using one hot/dummy encoding. In this encoding, categorical data are represented as vectors of zero’s and ones. For each category, a separate dummy variable is used, and its value is set to 1 if the observation falls into that category and to 0 otherwise.
3.3. Data visualization
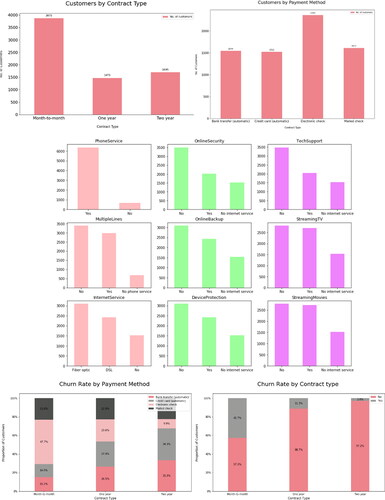
Data visualization, which states that after collecting data it is processed, and modelled, it must be visualized in order to make conclusions, is a crucial phase in the data science process. Finding data patterns are data visualization’s most crucial achievement. When all the data is presented to you in a visual format rather than a table, it is much simpler to spot data trends. The plots in the following shows distribution of data in few categorical features.
Figure 3. Distribution of data in categorical features.
3.4. Feature elimination
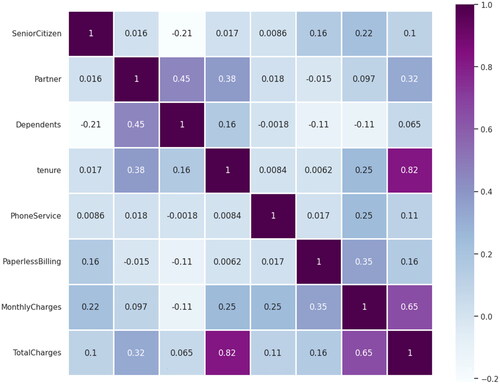
A statistical approach called correlation shows how one feature changes or moves in connection to another feature. It provides us with a general understanding of how closely the two features are related. We can anticipate one variable from the other if two variables are highly correlated. Finding the key features that other features depend on is facilitated by correlation. The correlation heat map in presents how the features are depend on one another and it is evident that TotalCharges is highly correlated to tenure and MonthlyCharges. Multi collinearity among the features is checked using Variance Inflation Factor (VIF) and features close VIF values are dropped.
Figure 4. Correlation heat map.
3.5. Handling class imbalance
An imbalanced classification problem is one in which the distribution of examples among the recognized classes is biased or skewed. Because the bulk of machine learning algorithms for classification were constructed on the premise that there should be an equal number of samples in each class, predictive modelling is challenged by imbalanced classifications. As a result, models consistently under predict outcomes, especially for the minority class. Research has suggested a number of solutions to handle this issue, including cost altering, under sampling, and oversampling. presents that distribution of samples among two classes of dependent feature – Churn and it is 73.5: 26.5. This problem is solved by using Synthetic Minority Oversampling Technique (SMOTE) and as result the two classes are balanced with 5174 samples in each class.
Figure 5. Weightage of classes of dependent feature – Churn.
4. Classification models
4.1. Split dataset
It is one of the most essential preprocessing phases before applying a machine learning algorithm. One of the simplest methods for overcoming overfitting and under fitting problems is dividing the dataset into train and test sets. The algorithm is trained using the train set. The test set is typically used to assess the model’s performance on a collection of unseen data. The data is split in the 80:20 ratio.
4.2. Feature scaling
A technique for normalizing the variety of independent features in data is called feature scaling. It is typically carried out during the data preprocessing step and is sometimes referred to as data normalization in the context of data processing. Feature scaling in machine learning would make the independent features to be in the same range. StandardScaler is applied on the both train and test data sets to normalize the data.
4.3. Importance of accuracy metrics
Accuracy metrics are crucial for evaluating the performance of classification models. Overall, accuracy metrics play a vital role in the development, evaluation, and optimization of classification models, ultimately contributing to the effectiveness and reliability of machine learning systems. Here are several reasons why accuracy metrics are important:
Performance Evaluation – Accuracy metrics provide a quantifiable measure of how well a classification model is performing. They help in assessing the effectiveness of the model in correctly predicting the class labels for the given dataset.
Comparison of Models – They enable the comparison of different classification models. By evaluating various metrics such as accuracy, precision, recall, F1-score, etc., one can determine which model performs better for a particular dataset.
Identifying Model Bias – These metrics can help in identifying biases present in the model.
Understanding Model Behavior – Accuracy metrics provide insights into how the model behaves under different conditions. Analyzing precision and recall can help in understanding how well the model performs in terms of minimizing false positives and false negatives respectively.
Optimization and Tuning – These serve as optimization objectives during the model training process. By optimizing the model to improve accuracy metrics, one can enhance the overall performance of the model.
Decision Making – Accuracy metrics assist in decision-making processes, such as whether to deploy a model into production or which model to choose for a specific application. Models with higher accuracy metrics are generally preferred as they are more reliable in making predictions.
4.4. Model selection
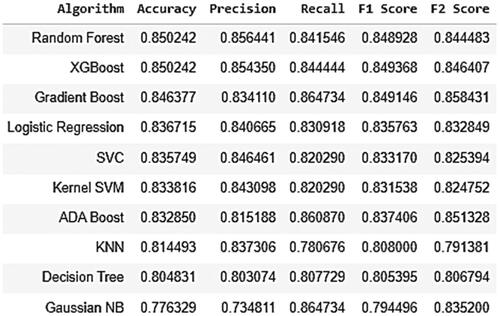
The Classification problem comes under supervised learning approach of machine learning used to identify the class of observations based on training data. In classification, the algorithm uses the dataset or interpretations delivered to learn how to classify the clarifications into several groupings (Helini et al., Citation2020; Narsimha et al., Citation2022; Ravi et al., Citation2023). In our case, a customer is classified as churn or no churn. In machine learning various classification algorithms are available and in this paper we applied ten algorithms viz., Logistic Regression, Support Vector Classifier, Kernel SVM, KNN, Gaussian Naïve Bayes, Decision Tree Classifier, Random Forest, ADA Boost, XGBoost and Gradient Boost. The performance of any classification algorithm is centered on the said assessment metrics. The input dataset is split into K groups of samples with equal sizes using the K-fold cross-validation procedure. These groups are treated as folds. The prediction function uses k-1 folds for each train set, while the left over folds are used for the test set. The results of the said classification algorithms are presented in and on train data. presents the outcomes of the same classification algorithms on test data.
Figure 6. Performance of classification algorithms.
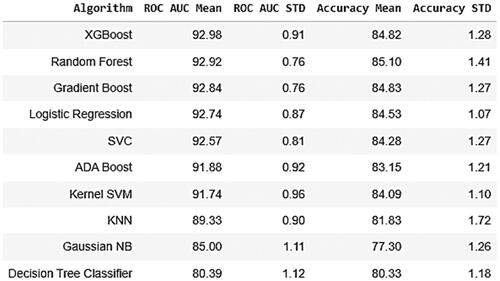
Figure 7. Accuracy metrics of classification algorithms on Train data.
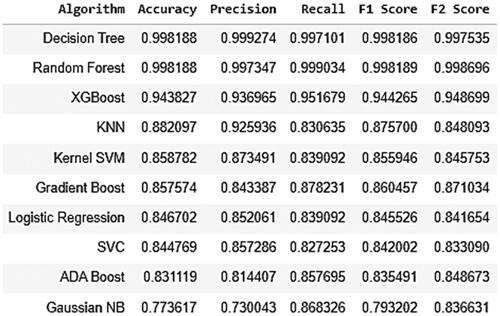
Figure 8. Accuracy metrics of classification algorithms on Test data.
5. Result analysis
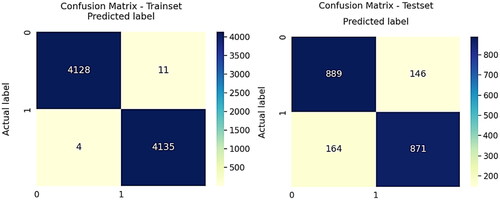
From the statics presented in , by considering the metric accuracy Decision Tree and Random Forest classifiers are performing better than the rest on train data. But on test data, Random Forest and XGBoost are performing better than Decision Tree classifier. When we look into the business challenge, our false negatives will be costly and hence we need to keep an eye onto other metrics besides accuracy. Considering this, Random Forest classifier is performing better than Decision Tree classifier in terms of ROC AUC Mean, Accuracy Mean, Accuracy STD, Recall, F1 Score and F2 Score. Also Random Forest is performing better than XGBoost except ROC AUC Mean, ROC AUC STD metrics. Even though the Random Forest classifier is giving 99.8188 accuracy with train data, the ten-fold cross validation is giving 85.23 which is almost same with test data 85.04. Confusion matrices for train set and test set are presented in .
Figure 9. Confusion matrices for train set and test set.
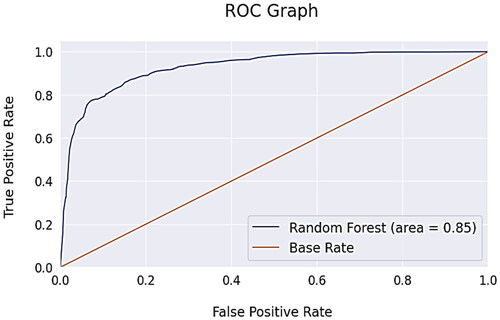
Area Under the Curve (AUC) of the Receiver Operating Characteristic (ROC) AUC-ROC curve helps to visualize how well our machine learning classifier performs over the binary classification problem of customer churn prediction. This curve plots over two parameters – True Positive Rate, False Positive Rate. The greater the AUC, the better the model does in distinguishing between the positive and negative classifications. shows the AUC ROC curve. Before concluding on this classifier it is fine-tuned on its hyper parameters using GridSearchCV and RandomizedSearchCV with ten-fold cross validation to overcome overfit problem. But no accuracy lift post hyper parameter tuning is noticed.
Figure 10. AUC-ROC graph.
6. Conclusion
For today’s businesses operating as subscription-based service providers, managing client churn, and particularly churn prediction, has become essential. Therefore, the goal of this study was to develop a system that can forecast customer churn in business. According to our findings, machine learning can forecast customer attrition with a high degree of accuracy. Using machine learning, we looked into a variety of customer churn prediction-related topics. We contribute to the development of a thorough understanding of how machine learning may be utilized for churn prediction by researching these factors that are recorded in the machine learning process.
In this paper, we tested on ten classification procedures on customer dataset to forecast customer churn. The pipeline of our model undergoes various data preprocessing steps which includes, understanding data through visualization, eliminating features based on correlation, VIF, handling class imbalance. The dataset is partitioned as train and test data in 80:20 ratio and the data is normalized before applying machine learning algorithms. The classification algorithms applied on the dataset are – Logistic Regression, Support Vector Classifier, Kernel SVM, KNN, Gaussian Naïve Bayes, Decision Tree Classifier, Random Forest, ADA Boost, XGBoost and Gradient Boost. Performance of these algorithms is analyzed using several metrics.
The discrepancy between the training accuracy (99.8188%) and test accuracy (85.04%) of Random Forest classifier suggests that the model is overfitting to the training data even after preprocessing data. In further study, the training data is to be augmented by including more variety, or additional data to help the model learn better generalization. A detailed analysis on error needs to be conducted to understand where the model is making mistakes. By addressing these areas, you can potentially improve the test accuracy of your Random Forest classifier and reduce the gap between training and test performance. This will lead to a more robust and generalizable model.
Authors’ contributions
Kathi Chandra Mouli, Ch V Raghavendran: conceived and designed the study, conducted experiments, analyzed data, and drafted the manuscript. V Y Bharadwaj, G Y Vybhavi: contributed to the study design, data collection, and analysis; provided critical revisions to the manuscript. C Sravani, Khristina Maksudovna Vafaeva, Rajesh Deorari, Laith Hussein: supervised the research and critically revised the manuscript for intellectual content. All authors have reviewed and approved the final version of the manuscript submitted.
Data availability
The data supporting the findings of this study is accessible and can be provided upon request from the corresponding author.
Disclosure statement
No potential conflict of interest was reported by the author(s).
Additional information
Funding
Notes on contributors
Kathi Chandra Mouli
Kathi Chandra Mouli working as an Assistant Professor in the Department of Computer Science and Engineering, Gokaraju Rangaraju Institute of Engineering and Technology, Bachupally, Hyderabad, Telangana, 500090. He has completed his M.Tech from Vaagdevi Institute of Technology and Science, Proddatur, Kadapa District, Andhra Pradesh, India. He has 10 Years of experience in teaching undergraduate and postgraduate programmes. He published 16+ papers in Various International Journals and presented papers at 2 National and International conferences and 1 patent. His research areas include Cloud Computing, Machine Learning, Deep Learning, and Computer Vision.
Ch. V. Raghavendran
Dr. Ch. V. Raghavendran working as a Professor in the Department of Information Technology, Aditya College of Engineering and Technology (A), Surampalem, Andhra Pradesh, India. He received Ph.D., in Computer Science and Engineering from Adikavi Nannaya University, Rajamahendravaram, AP in 2016. He has 28 years of experience in teaching undergraduate and postgraduate programmes. He published 50+ papers in various International Journals, presented papers in 35 National and International Conferences, and authored 9 books. He is acting as a reviewer, and board member for International Journals. His research areas include Machine Learning, Deep Learning, MANETs, and Computer Vision.
V. Y. Bharadwaj
V. Y. Bharadwaj, Assistant Professor in the Department of Computer Science & Business Systems, GRIET. He has completed his M.Tech from Hasvita Institute of Engineering and Technology, Hyderabad, and B.Tech from Vishnu Sree Institute of Technology, Hyderabad. He has Ten years of Experience; Six years of Industrial experience and four years of Teaching experience. He has 8 publications in various international journals and conferences, 2 book chapters, and 1 patent.
G. Y. Vybhavi
G. Y. Vybhavi working as an Assistant Professor in the Department of Computer Science and Engineering, Gokaraju Rangaraju Institute of Engineering and Technology, Bachupally, Hyderabad, Telangana, 500090. She has 2.6 years of Industry experience and 6 years of Experience in Teaching undergraduate programs. She has 6 Publications in various international journals and conferences and she has 1 Patent and 1 Book Chapter. Her research areas include Machine Learning, Cloud Computing, Internet of Things.
C. Sravani
C. Sravani working as an Assistant Professor in the Department of Computer Science and Engineering, Gokaraju Rangaraju Institute of Engineering and Technology, Bachupally, Hyderabad, Telangana, 500090. She has 2 years of Industry experience and 3 years of Experience in Teaching undergraduate programs. She has 4 Publications in various international journals and conferences and she has 1 Patent and 1 Book Chapter. Her research areas include Machine Learning, Deep Learning, Image Processing.
Khristina Maksudovna Vafaeva
Khristina Maksudovna Vafaeva is working at Lovely Professional University, Phagwara, Punjab, India.
Rajesh Deorari
Rajesh Deorari is working at Uttaranchal University, Dehradun, Uttarakhand, India.
Laith Hussein
Laith Hussein working at the College of Technical Engineering, The Islamic University, Najaf, Iraq.
References
- Ahmed, M., Afzal, H., Siddiqi, I., Amjad, M. F., & Khurshid, K. (2020). Exploring nested ensemble learners using overproduction and choose approach for churn prediction in telecom industry. Neural Computing and Applications, 32(8), 3237–3251. https://doi.org/10.1007/s00521-018-3678-8
- Amin, A., Anwar, S., Adnan, A., Nawaz, M., Alawfi, K., Hussain, A., & Huang, K. (2017). Customer churn prediction in the telecommunication sector using a rough set approach. Neurocomputing, 237, 242–254. https://doi.org/10.1016/j.neucom.2016.12.009
- Athanasopoulos, G., Song, H., & Sun, J. A. (2017). Bagging in tourism demand modeling and forecasting. Journal of Travel Research, 57(1), 52–68. https://doi.org/10.1177/0047287516682871
- Azeem, M., Usman, M., & Fong, A. (2017). A churn prediction model for prepaid customers in telecom using fuzzy classifiers. Telecommunication Systems, 66(4), 603–614. https://doi.org/10.1007/s11235-017-0310-7
- Blouin, K. D., Flannigan, M. D., Wang, X., & Kochtubajda, B. (2016). Ensemble lightning prediction models for the province of Alberta, Canada. International Journal of Wildland Fire, 25(4), 421–432. https://doi.org/10.1071/WF15111
- Brena, R. F., Zuvirie, E., Preciado, A., Valdiviezo, A., Gonzalez-Mendoza, M., & Zozaya-Gorostiza, C. (2021). Automated evaluation of foreign language speaking performance with machine learning. International Journal on Interactive Design and Manufacturing (IJIDeM), 15(2–3), 317–331. https://doi.org/10.1007/s12008-021-00759-z
- Coussement, K., Lessmann, S., & Verstraeten, G. (2017). A comparative analysis of data preparation algorithms for customer churn prediction: A case study in the telecommunication industry. Decis Support Syst. http://linkinghub.elsevier.com/retrieve/pii/S0167923616302020
- Dahiya, K., & Bhatia, S. (2015). Customer churn analysis in telecom industry. Reliability, Infocom Technologies and Optimization (ICRITO), (Trends and future directions), 1–6. https://doi.org/10.1109/ICRITO.2015.7359318
- De Bock, K. W., & Van den Poel, D. (2011). An empirical evaluation of rotation-based ensemble classifiers for customer churn prediction. Expert Systems with Applications, 38(10), 12,293–12,301.
- De, S., P, P., & Paulose, J. (2021 Effective ML techniques to predict customer churn [Paper presentation]. 2021 Third International Conference on Inventive Research in Computing Applications (ICIRCA) (pp. 895–902), Coimbatore, India. https://doi.org/10.1109/ICIRCA51532.2021.9544785
- Helini, K., Prathyusha, K., Sandhya Rani, K., & Raghavendran, C. V. (2020). Predicting coronary heart disease: A comparison between machine learning models. International Journal of Advanced Science and Technology, 29(3), 12635–12643. http://sersc.org/journals/index.php/IJAST/article/view/30385
- Kisioglu, P., & Topcu, Y. I. (2011). Applying Bayesian belief network approach to customer churn analysis: A case study on the telecom industry of turkey. Expert Systems with Applications, 38(6), 7151–7157. https://doi.org/10.1016/j.eswa.2010.12.045
- Liu, R., Ali, S., Bilal, S. F., Sakhawat, Z., Imran, A., Almuhaimeed, A., Alzahrani, A., & Sun, G. (2022). An intelligent hybrid scheme for customer churn prediction integrating clustering and classification algorithms. Applied Sciences, 12(18), 9355. https://doi.org/10.3390/app12189355
- Lu, N., Lin, H., Lu, J., & Zhang, G. (2014). A customer churn prediction model in telecom industry using boosting. IEEE Transactions on Industrial Informatics, 10(2), 1659–1665. https://doi.org/10.1109/TII.2012.2224355
- Mukhopadhyay, D., Malusare, A., Nandanwar, A., & Sakshi, S. (2021). An approach to mitigate the risk of customer churn using machine learning algorithms. In Joshi, A., Khosravy, M., & Gupta, N. (Eds.), Machine learning for predictive analysis. Lecture notes in networks and systems (Vol. 141). Springer. https://doi.org/10.1007/978-981-15-7106-0_13
- Narsimha, B., Raghavendran, C. V., Rajyalakshmi, P., Reddy, G. K., Bhargavi, M., & Naresh, P. (2022). Cyber defense in the age of artificial intelligence and machine learning for financial fraud detection application. International Journal of Electrical and Electronics Research, 10(2), 87–92. https://doi.org/10.37391/ijeer.100206
- Nishimatsu, K., & Inoue, A. (2023). User intent-based segmentation analysis for internet access services. International Journal of Strategic Decision Sciences, 14(1), 1–21. https://doi.org/10.4018/IJSDS.318643
- Qureshi, S. A., Rehman, A. S., Qamar, A. M., Kamal, A., & Rehman, A. (2013). Telecommunication subscribers’ churn prediction model using machine learning. In 2013 8th International Conference on Digital Information Management (ICDIM) (pp. 131–136). IEEE.
- Ravi, C., Raghavendran, C. V., Satish, G. N., Reddy, K. V., Reddy, G. K., & Balakrishna, C. (2023). ANN and RSM based modeling of Moringa Stenopetala seed oil extraction: Process optimization and oil characterization. International Journal on Recent and Innovation Trends in Computing and Communication, 11(7s), 329–338. https://doi.org/10.17762/ijritcc.v11i7s.7007
- Sharma, A., Panigrahi, D., & Kumar, P. (2011). A neural network based approach for predicting customer churn in cellular network services. International Journal of Computer Applications, 27(11), 26–31. https://doi.org/10.5120/3344-4605
- Sharma, V., Misra, J., & Singhal, S. (2023). Machine learning algorithms based advanced optimization of wire-EDM parameters: An experimental investigation into titanium alloy. International Journal on Interactive Design and Manufacturing (IJIDeM). https://doi.org/10.1007/s12008-023-01348-y
- Sjarif, N. N., Rusydi, M., Yusof, M., Hooi, D., Wong, T., Ya’akob, S., Ibrahim, R., & Osman, M. Z. (2019). A customer churn prediction using Pearson correlation function and K nearest neighbor algorithm for telecommunication industry.
- Sjarif, N., Azmi, N. F., Sarkan, H. M., Sam, S., & Osman, M. (2020). Predicting churn: How multilayer perceptron method can help with customer retention in telecom industry. IOP Conference Series: Materials Science and Engineering, 864(1), 012076. https://doi.org/10.1088/1757-899X/864/1/012076
- Tsai, C. F., & Lu, Y. H. (2009). Customer churn prediction by hybrid neural networks. Expert Systems with Applications, 36(10), 12547–12553. https://doi.org/10.1016/j.eswa.2009.05.032
- Wang, Y., Feng, D., Li, D., Chen, X., Zhao, Y., & Niu, X. (2016). A mobile recommendation system based on logistic regression and gradient boosting decision trees [Paper presentation]. 2016 International Joint Conference on Neural Networks (IJCNN) (pp. 1896–1902). IEEE. https://doi.org/10.1109/IJCNN.2016.7727431
- Zhang, W., Zou, H., Luo, L., Liu, Q., Wu, W., & Xiao, W. (2016). Predicting potential side effects of drugs by recommender methods and ensemble learning. Neurocomputing, 173, 979–987. https://doi.org/10.1016/j.neucom.2015.08.054
- Zhao, L., Gao, Q., Dong, X., Dong, A., & Dong, X. (2017). K-local maximum margin feature extraction algorithm for churn prediction in telecom. Cluster Computing, 20(2), 1401–1409. https://doi.org/10.1007/s10586-017-0843-2