
Abstract
Whole grains are rich in antioxidant components (AC), most of which are bound to fibre fraction and released during digestion. The study investigated the effect of digestive enzymes on the antioxidant properties of fibre-rich fractions from wheat (Triticum aestivum), finger millet (Eleusine coracana), pearl millet (Pennisetum typhoides) and sorghum (Sorghum bicolor). Coarse (CF) and fine fractions (FF) of milled flour were separated using a standard sieve and analysed for nutritional composition, AC extractable in different solvents and antioxidant activity (AA) in untreated and enzyme-treated fractions. The CF had a higher range of insoluble dietary fibre (17.26–20.93%) than FF (10.65–17.29%). The highest amount of polyphenols and flavonoids was extractable in different solvents from finger millet and pearl millet, respectively. FF of pearl millet showed higher total AA in all solvents. Enzyme-treated samples had a much higher content of AC as well as higher total AA. Free radical scavenging assay revealed that enzyme-treated millet flours had higher activity in comparison to wheat. Between fractions, wheat exhibited variable results. Among millets, CF of finger millet and FF of pearl millet and sorghum had higher AA. In conclusion, digestive enzyme treatment released more AC from grains, and exhibited a higher AA.
Public Interest Statement
Whole gains are nature’s gift to mankind and the benefits of including them in the diet are being recognized widely by scientists today. The present research investigates the health beneficial aspects of dietary fibre from whole grain cereal and millets. Most of the bioactive components in grains are bound to fibre fraction of the grain and released during digestion. This study tries to explore whether digestive enzymes can release more of these components and whether they also demonstrate a higher extent of antioxidant activity. The results clearly indicate that the process of digestion can release more antioxidant components from fibre-rich cereal fractions with higher antioxidant activity. While the coarse and fine fractions of wheat showed variable results, millet fractions showed a distinct pattern of activity, which was much higher than wheat. Hence, the study shows the positive aspects of whole grain nutrition, particularly for underutilized small millets.
Competing interests
The authors declare no competing interest.
1. Introduction
Cereals and millets are important part of dietaries in many ethnic populations. They are rich in dietary energy, vitamins, minerals, especially micronutrients such as iron and zinc, insoluble dietary fibre, and phytochemicals (Bouis, Citation2000). Smaller millets can be particularly rich in vitamins and minerals. Cereals contain a wide range of phytochemicals which act as direct free radical scavengers, co-factors of antioxidant enzymes or as indirect antioxidants (Fardet, Rock, & Rémésy, Citation2008). Antioxidant compounds in foods play an important role as a health-protecting factor. Scientific evidence suggests that antioxidants reduce the risk for chronic diseases including cancer and heart disease (Bancirova, Citation2010; Slavin, Citation2004). Primary sources of naturally occurring antioxidants in diets are whole grain cereals, fruits and vegetables. Most of the antioxidant compounds in a typical diet are derived from plant sources and belong to various classes of compounds with a wide variety of physical and chemical properties (Cukelj, Novotni, & Curie, Citation2010; Wang, Cao, & Prior, Citation1996).
Whole grains are rich sources of dietary fibre and as per the recent discoveries, they also are a good source of antioxidant components (AC) (Fan, Zhang, Yu, & Ma, Citation2006; Fardet, Citation2010). Bioactive components have the property of scavenging free radicals in human body, hence provide protection against many life-threatening non-communicable diseases. The role of antioxidant in health is increasingly been recognized, while AC from fruits and vegetables are readily available. In case of whole grains, most of them are bound to the fibre fraction and are released gradually during the course of digestion (Siddiqui & Prakash, Citation2014). Hence, whole grains provide the benefit of higher content of antioxidant than can be estimated in the grains as such. Dietary fibres are associated with polyphenols which increase their antioxidant capacity significantly. The determination of dietary fibre-antioxidant capacity can be useful to complete the characterization of fibre and estimate its potential health effects and applications or as a functional ingredient. The antioxidant capacity associated with dietary fibre can be measured in extracts and hydrolysates of dietary fibre by the most common antioxidant capacity methods (Pérez-Jiménez et al., Citation2008). The process of sieving or refining, which is a common pre-processing procedure for many products, can reduce the nutrient and fibre content of whole grains flours and also cause a consequent reduction in AC (Prakash, Citation2014).
In view of this, the present study was planned to investigate the role of digestion process in retaining the AC and activity in whole grain cereal and millets with special reference to fibre. The investigation included fractionation of selected grain flour into coarse (CF) and fine fractions (FF) using a standard sieve, and studying the effect of digestive enzymes following an in vitro simulated digestion procedure on the AC and activity of these two fractions.
2. Methodology
The grains selected for the study were one cereal and three millets, namely wheat (Triticum aestivum), finger millet (Eleusine coracana), pearl millet (Pennisetum typhoides) and sorghum (Sorghum bicolor). These were purchased from local market in one batch, cleaned of extraneous matter and milled. All chemicals used for the study were of analytical grade and purchased from Sd Fine Chemicals and Qualigens Chemicals Ltd., Mumbai, India. The enzymes used, namely pepsin (Batch No. 3-0060) and pancreatin (Batch No. 0-0864) were procured from Sigma Aldrich Co., USA. Glass double-distilled water was used and all experiments were carried out in duplicate.
The study design included sieving of milled grain flours to separate CF and FF, and analysis of these fractions for nutritional composition, bioactive components in different media and antioxidant activity. Subsequently, gelatinized flour factions were treated with digestive enzymes and analysed for bioactive components and antioxidant activity.
2.1. Preparation of flour fractions
The milled flour was passed through a sieve with mesh size of 60 mµ and the two fractions separated were designated as CF and FF. This represented the sieving operations practised at domestic level before using milled grain flours.
2.2. Analysis of nutritional components
The flours were analysed for moisture, fat, protein, total ash, calcium and iron following standard techniques as indicated below: moisture estimation by vacuum oven method, protein by Kjeldahl nitrogen distillation and multiplying the nitrogen value with 6.25, total ether extractives using petroleum ether in Soxhlet apparatus, ash by direct incineration, calcium by titrimetric procedure and iron by colorimetric determination (Association of Official Analytical Chemists, Citation2005; Ranganna, Citation1986). Dietary fibre consisting of both insoluble and soluble fibres was estimated by enzymatic gravimetric (Asp, Johansson, Hallmer, & Siljestroem, Citation1983) method, which is equivalent to physiologically unavailable carbohydrates.
2.3. Analysis of bioactive components
The different extraction media selected for estimation of polyphenols and flavonoids were water, 80% methanol, methanol and ethanol. A known amount of sample was mixed with extracting media; the slurry was shaken for 3 h and filtered through Whatman filter paper No.1. Polyphenols were estimated with Folin–Ciocalteuo reagent and values expressed as mg of tannic acid equivalents/100 g of sample (Matthäus, Citation2002). The flavonoid content was estimated using the Dowd method as adapted by Arvouet-Grand, Vennat, Pourrat, and Legret (Citation1994) and expressed as mg of quercetin equivalents per 100 g of sample. For tannin, colorimetric estimation was based on the measurement of blue colour formed by the reduction of phosphotungstomolybdic acid by tannin-like compounds in alkaline solution with Folin–Denis reagent, and expressed as mg of tannic acid equivalents/100 g of sample (Association of Official Analytical Chemists, Citation1990).
2.4. Estimation of antioxidant activity
Antioxidant activity in different sample extracts was measured using three methods as detailed below.
2.4.1. Total antioxidant activity by phosphomolybdenum method
This assay is based on the reduction of Mo(VI) to Mo(V) by the sample analyte and the subsequent formation of green phosphate/Mo(V) complex at acidic pH. The results were calculated as μmoles of total antioxidant activity per g of sample (Prieto, Pineda, & Aguilar, Citation1999).
2.4.2. Ferric reducing antioxidant power
In this assay, Fe3+/ferricyanide complex is reduced to the ferrous form by antioxidants. The Fe2+ formed is monitored by measuring the formation of Perl’s Prussian blue at 700 nm. Increased absorbance of the reaction mixture indicated increased reducing power (Oyaizu, Citation1986).
2.4.3. Free radical scavenging activity using DPPH assay
DPPH, a commercial oxidizing radical is reduced by antioxidants. The disappearance of the DPPH radical absorption at a characteristic wavelength is monitored by decrease in optical density. Free radical scavenging activity (FRSA) was expressed as inhibition percentage (Singh, Chidambara Murthy, & Jayaprakasha, Citation2002).
2.5. Digestive enzyme treatment
The CF and FF were subjected to digestive enzyme treatment following in vitro digestion method which simulated the human physiological digestion. The method was adapted from Luten et al. (Citation1996) by suitable modification in the last step. A 2.0 g portion of sample was weighed and gelatinized with 70 ml of distilled water over a water bath and cooled. It was made up to 100 ml and a 6.0-g portion of gelatinized sample was placed in 250-ml Erlenmeyer flask and 80 ml of water was added. The pH was adjusted to 2.0 with 6M HCl. After 15 min, the pH was checked and readjusted if necessary. A 3.0 ml of freshly prepared pepsin solution was added and the volume was made up to 100 ml with water. The samples were incubated at 37°C for 2 h. Then, freshly prepared pancreatin mixture was added. The pH was adjusted to 7.0 with 0.2 M NaOH and incubated at 37°C for 30 min. A 5.0 ml of pancreatin–bile extract mixture was added and incubated at 37°C for another 2 h. The sample was cooled, centrifuged and the supernatant was used to estimate the AC and antioxidant activity in different CF and FF of grains.
2.6. Statistical analysis
Data presented represent mean and standard deviation of duplicate determinations. Students “T” test was used to determine the level of significant difference between CF and FF.
3. Results and discussion
3.1. Chemical composition of cereal flours
The chemical composition of CF and FF of grain flours on dry weight basis is presented in Table . The protein content of CF and FF of wheat ranged from 13.66 to 13.98% with no significant difference; however, in all millet flours, the protein content differed significantly in CF and FF. The CF of finger millet and sorghum had much higher content of protein than FF. In pearl millet, the FF showed higher protein content. The fat content showed a significant difference only in case of wheat with FF having higher value (1.92%) than coarse fractions (1.61 g%). In rest of the millet samples, fat content did not differ significantly in two fractions. Pearl millet had a high fat content of 6.21–6.53%. The total ash content was also marginally different among samples with higher values for CF in wheat and finger millet and lower values for CF in pearl millet and sorghum. Calcium followed a similar trend with marginally significant difference between wheat fractions (39.35 and 26.65 mg/100 g) and significant difference between finger millet fractions (475.5 and 243.4 mg/100 g). It may be noted that finger millet is exceptionally rich in calcium; however, the process of sieving can bring down the calcium content remarkably in the fine fraction. This has been demonstrated even in our earlier studies wherein sieving reduced calcium in finger millet flour by 22% (Oghbaei & Prakash, Citation2012). Pearl millet and sorghum had a much lower calcium content with slight differences among two fractions. Iron content of all grain flours analysed differed significantly in CF and FF with dissimilar trends. FF of wheat and finger millet and CF of pearl millet and sorghum showed significantly higher iron content.
Table 1. Nutritional composition of CF and FF of grain flours (per 100 g dry weight basis)
When the flours were examined for insoluble dietary fibre, the results indicated that all coarse flours of grains had a higher content of insoluble dietary fibre compared to the FF. In general, whole grains have high insoluble dietary fibre as the bran portion of any grain is made up entirely of cellulose. Oghbaei and Prakash (Citation2013) reported that when wheat was subjected to roller milling, the separated bran faction had 42.5% of insoluble dietary fibre in comparison to whole wheat flour which had 12.5%. In the present study, the CF of wheat and finger millet had 92–93% of total dietary fibre as insoluble dietary fibre, whereas pearl millet and sorghum had a slightly lower extent (85–87%). The insoluble dietary fibre content was highest in sorghum followed by wheat, pearl millet and finger millet, the range being 17.25–20.39%. The differences between CF and FF were significant for wheat and finger millet and insignificant for pearl millet and sorghum. Oghbaei and Prakash (Citation2012) analysed dietary fibre profile of whole and sieved finger millet and the values reported for insoluble dietary fibre were 20.23 and 12.15%, respectively.
The soluble dietary fibre content of flours indicated that overall it was in a low range (1.12–3.82%). The CF of wheat and finger millet had a lesser content of soluble dietary fibre in comparison to FF, and the differences were marginally significant. In contrast, pearl millet and sorghum had a slightly higher content of soluble fibre in CF in comparison to FF; however, the differences were not significant. Overall, analysis of chemical composition of different fractions of grains showed that process of sieving could significantly affect many constituents of the flour significantly. These can alter the nutrient composition of product significantly depending upon the raw materials and processing conditions which in turn could affect the final nutritional quality of products. Hence. processed products based on whole grains have a better nutritional composition and are associated with many health benefits (Prakash, Citation2013). Processed ready-to-eat breakfast cereals based on whole wheat and finger millet were reported to have 13.30 and 18.40% of dietary fibre, respectively (Bhavya & Prakash, Citation2012).
3.2. AC and total antioxidant activity in untreated flour in different solvent extracts
The AC and total antioxidant activity of CF and FF of all samples were analysed in different solvent extracts to understand the differences in their potential antioxidant capacity and data are presented in Table . Phenolic compounds are known to exist as free, soluble conjugates and insoluble bound forms in foods. The beneficial effects attributed to the cereal dietary fibre are due not only to the polysaccharide moiety, but also to the associated polyphenolic content (Vitaglione, Napolitano, & Fogliano, Citation2008). The antioxidant capacity of a dietary fibre is derived from the power of polyphenols and other constituents like flavonoids and tannins. This parameter provides an integrated measurement that may represent the amount of antioxidant units carried by a dietary fibre in the human gut (Cukelj et al., Citation2010).
Table 2. AC and total antioxidant activity in untreated grain flours in different solvent extracts
There were wide variations in polyphenol content of grain flours extracted in different solvent media. The polyphenol content of wheat flour fractions extracted in different solvents ranged from 39.06 mg to 74.65 mg/100 g. While methanolic extracts showed higher extraction in CF, ethanol could extract more from FF. In finger millet, the extraction from CF was significantly higher in all extracts, while in pearl millet and sorghum, fine flour showed higher extraction of polyphenol in all solvents. Among all samples, finger millet had the highest polyphenol content. According to Devi, Vijayabharathi, Sathyabama, Malleshi, and Priyadarshini (Citation2011), the major bound phenolics in finger millet are ferulic acid and p-coumaric acid, and the bound phenolic fraction accounts for 64–96 and 50–99% of total ferulic acid and p-coumaric acid contents, respectively. Flavonoids also followed the trend of extent of extraction seen for polyphenols. Cereals and millets are not a rich source of flavonoids unlike fruits and vegetables, and the amount extracted in different solvents ranged from 4.16 to 47.58 mg/100 g. Flavonoids are powerful antioxidants giving protection against oxidative and free radical damage. They prevent formation of oxidized cholesterol through antioxidant effect and are known to exert greater antioxidant effects than vitamins C, E, selenium and zinc (Nambiar, Sareen, Daniel, & Gallego, Citation2012).
Wheat had a very low content of flavonoids (4.16–5.10 mg/100 g), which showed a higher extraction in methanolic extracts. Both sorghum and pearl millet had higher extraction in FF, and the latter had the highest flavonoid content among all samples. For finger millet, CF exhibited higher extraction. It can be said that variable amount of polyphenol and flavonoid could be extracted in different solvent media and all samples were different in their extraction ability, though the trend was similar for both polyphenol and flavonoid.
The total antioxidant activity of all samples in different solvent extracts was also estimated and the results given in Table show that the trend seen for extraction of polyphenol and flavonoid was maintained here with two exceptions, methanolic extract of fine wheat flour and ethanolic extract of coarse sorghum exhibited higher activity than their counterpart. CF of finger millet (11,005–23,590 μmoles equivalent to ascorbic acid/g) and FF of pearl millet (25,210–30,651 μmoles equivalent to ascorbic acid/g) showed higher activity in all extracts. Among the solvents, the highest activity was seen for wheat and finger millet in 80% methanolic extracts and for pearl millet in pure methanol and for sorghum in ethanol (CF) and methanol (FF). Earlier studies also indicate that 80% methanol is an effective solvent in extracting phenolics and other polar substances in cereals (Zieliński & Kozłowska, Citation2000).
3.3. AC and total antioxidant activity in untreated and enzyme-treated cereal flours in aqueous extract
The AC and total antioxidant activity (μmoles equivalent to ascorbic acid/g) in untreated (control) and enzyme-treated samples in aqueous extracts are presented in Table . Finger millet samples exhibited the highest extraction of polyphenol followed by pearl millet, wheat and sorghum. Significant differences were seen in CF and FF of finger millet and pearl millet. FF of pearl millet had the highest flavonoid content (40.04 mg/100 g) followed by fine and coarse finger millet and CF of pearl millet in nearing range (16.51–18.88 mg/100 g). Wheat comparatively had a very low range of flavonoids. The tannin content of flour fractions showed that coarse wheat had 177.2 mg tannin/100 g of flour and on sieving no reduction was seen in the FF (171 mg/100 g). The CF of finger millet had 696.3 mg tannin/100 g of flour which showed a marked significant reduction of 42% on sieving. Coarse pearl millet had 282.6 mg of tannin which showed a significant increase in sieving to 350.6 mg/100 g. In sorghum flour, also a 67% increase in the tannin content of FF was observed. Tannins were the highest in finger millet, followed by pearl millet, wheat and sorghum with significant difference in finger millet, pearl millet and sorghum flour fractions. Overall results showed that the reduction or enhancement of the tannin content on flour fractionation was not uniform. Wheat did not exhibit any difference. Finger millet exhibited a remarkable reduction and pearl millet and sorghum recorded an increase.
Table 3. AC (mg/100 gTable Footnote § ) and total antioxidant activity in untreated (control) and enzyme-treated grain flours in aqueous extract
Hahn and Rooney (Citation1986) identified free and bound phenolic acids in sorghum. Free phenolic acids are found in the outer layers of the kernel, whereas the bound phenolic acids are associated with the cell walls (Dykes & Rooney, Citation2006). Many sorghum flavonoids have been isolated and identified. The anthocyanins are the major class of flavonoids studied in sorghum. The antioxidant potential of sorghum-based products, whole grain, bran and cooked/extruded products was strongly correlated with their polyphenol content (Awika, Rooney, & Waniska, Citation2005), with sorghum bran having the highest antioxidant potential.
When the samples were treated with digestive enzymes, a very high content of polyphenol was seen in all samples in comparisons with their undigested controls. The polyphenol content showed a tremendous increase in digestion wherein the values were 3 times more for wheat, 1–1.5 times more for finger millet, 2–2.5 times more for pearl millet and 5 times more for sorghum. The polyphenol content of CF of wheat was 123.51 mg and showed an increase in FF to 133.45 mg/100 g, the difference being significant. The range of polyphenol seen in finger millet was between 193.56 and 204.32 mg/100 g which was not significantly different from each other. The FF of pearl millet had a much higher content of polyphenols (167.0 mg) in comparison to CF which was only 125.16 mg/100 g. Sorghum also showed a high content of polyphenol in the FF of flour, the difference being significant. This indicates that the digestive enzyme treatment had maximum effect on the polyphenol content.
The flavonoid content was much lesser in all the flour and no difference was seen in the wheat flour fractions. The flavonoid content showed an increase for the wheat sample, a decrease for finger millet and varied result for pearl millet. Between fractions, the FF of finger millet had a slightly higher content, in pearl millet major differences were seen and in sorghum also, significant differences were seen.
The tannin content, however, was higher in CF and lesser in the FF of wheat, but all other flours exhibited a higher tannin content in the FF. A remarkable increase in tannin content was seen in wheat in comparison to untreated samples; however, in finger millet and pearl millet, enzyme-treated samples had lesser tannin content. Between fractions, difference was not significant for finger millet and significant for all other flours.
Total antioxidant capacity of cereals is thought to be mainly due to polyphenols, and particularly to phenolic acids, most of which are associated with dietary fibre, constituting a “dietary fiber-phenolic acid” complex. Antioxidant capacity determined in residues of aqueous-organic extracts corresponds to the phenolics associated with dietary fibre (Saura-Calixto, Pérez-Jiménez, & Goñi, Citation2009). The total antioxidant activity measured in the digestive enzymes-treated extracts showed that the CF of wheat flour recorded a much higher activity at 47,714 μm/g of sample in comparison with the FF, which was only 33,561 μm/g, the differences were significant. The total antioxidant activity observed for finger millet flours was in the range of 28,191–28,256 μm/g of sample and not significantly different from each other. The differences in total antioxidant activity of pearl millet and sorghum flour fractions were marginally significant. Total antioxidant activity was higher in all enzyme-treated samples than their respective untreated controls. When computed as percent increase in total antioxidant activity over untreated control, the values were 26.7–139.15% higher. Highest increase was seen in CF of sorghum and lowest in FF of pearl millet. These results indicate that on enzyme treatment, a higher extent of AC is released from grain resulting in higher antioxidant activity. Cereals contain a much wider range of compounds with potential antioxidant effect; these include vitamin E (mainly in the germ), folates, mineral (iron, zinc) and trace elements (selenium, copper and manganese), carotenoids, phytic acid, lignin and other compounds such as betaine, choline, sulphur amino acids, alkylresorcinols and lignans found mainly in the bran fraction (Fardet et al., Citation2008). Other than phenolic acids, phytoestrogens and flavonoids, cereal grains also contain ferulic, vanillic and p-coumaric acids as the most abundant free phenolic acids exhibiting antioxidant activities (Sivam, Sun-Waterhouse, Quek, & Perera, Citation2010).
3.4. Antioxidant activity in untreated and enzyme-treated flours using reducing power assay
The reducing power of untreated flour fractions is compiled in Figure . The graph depicting the reducing power of wheat in different media indicates that higher antioxidant activity was exhibited by CF in water and 80% methanol and by FF in methanol and ethanol. In water media, the values ranged from 0.084–0.240. The reducing power exhibited by 80% methanolic extract varied between 0.075–0.173, while that of methanol alone was much higher at 0.163–0.271, the ethanolic extract had least activity.
Figure 1. Reducing power of grain flour fractions in different extracts
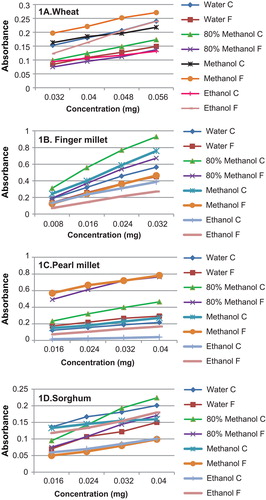
For finger millet, the concentration of sample which was used for determination of reducing power was also extremely low ranging from 0.008 to 0.32 mg indicating that finger millet had the highest antioxidant activity among the flours analysed. In all media, the CF of finger millet exhibited a higher reducing power. This can be attributed to their high polyphenols and tannin content, as the concentration of sample increased a higher activity was observed. In water media, the reducing power exhibited by CF ranged between 0.139 and 0.563, in 80% methanol, and the highest reducing power was seen with an absorbance of 0.929 for 0.032 mg; methanol alone had a slightly reduced activity in comparison to 80% methanolic extract. However, this was also high in comparison to all other flours as the concentration of sample used was very small. Ethanolic extracts showed least activity.
Pearl millet exhibited a higher reducing power activity in FF extracted in all media. It may be noted here that there was no significant difference in the dietary fibre profile of CF and FF of pearl millet flour, as given in Table . Also, the FF had a significantly higher content of tannins, polyphenols and flavonoids in comparison to CF. For the FF, the reducing power activity varied between 0.173 and 0.293 in water media. Methanol exhibited the highest activity at 0.568–0.782, for 80% methanol media, it was 0.491–0.764, and for ethanol, it was least.
In case of sorghum, water, 80% methanol and methanol media exhibited a higher reducing power for the CF of the flour; however in ethanol, the activity was higher for the FF. The ranges of absorbance observed for the CF in the concentration range of 0.016–0.04 mg were as follows: water 0.136–0.201; 80% methanol 0.095–0.224; and methanol 0.133–0.016. For the FF, ethanol exhibited an absorbance of 0.118 for 0.016-mg sample, which increased to 0.18 at 0.04-mg concentration. The differences observed in the reducing power of CF and FF among different media can be due to the content of AC, while there was no significant difference in the dietary fibre profile as such, the tannin content in fine fraction was higher. This may have accounted for differences in the reducing power.
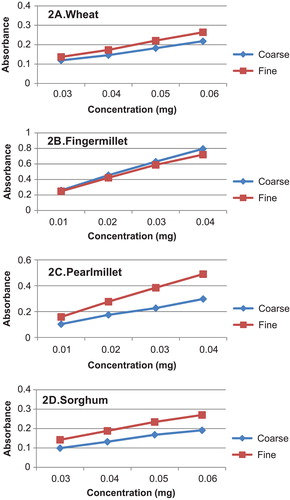
The reducing power assay for all the enzyme-treated flours is presented in Figure . As can be seen from the figure, the reducing power of wheat flour was measured at a concentration of 0.03–0.06 mg, the FF showed a slightly higher reducing power ranging from 0.137 to 0.264, and the corresponding values for CF were 0.119–0.218. For finger millet fractions, the concentration used was 0.01–0.04 mg. Here, there were no major differences observed in FF and CF. The reducing power measured was in the range of 0.248–0.795. The concentration of pearl millet flour used for reducing power assay was similar to finger millet flour. Major differences were observed in reducing power of FF and CF; the FF had higher absorbance ranging between 0.159 and 0.490 in comparison to CF which was 0.103–0.298. A similar trend was also seen in sorghum flour which showed a higher activity in the FF (0.142–0.270). The reducing power for enzyme-treated flours followed the trend seen for untreated flour with CF of finger millet and FF of pearl millet and sorghum exhibiting higher antioxidant activity. It is said that acidic conditions in the stomach and enzymatic hydrolysis in duodenum are likely to increase the solubility and activity of cereal polyphenols; hence, digestion increases the antioxidant capacity of cereal products (Pérez-Jiménez et al., Citation2008; Saura-Calixto, Citation2011).
Figure 2. Reducing power of enzyme-treated grain flour fractions
3.5. Antioxidant activity in untreated and enzyme-treated flours using free radical scavenging assay
The FRSA of all the samples in different media is presented in Figure . For wheat flour, the activity was measured in the concentration range of 0.04–0.064 mg. In water media, the FRSA of CF ranged between 23 and 31%, whereas 80% methanolic media exhibited a higher extent of activity ranging from 36 to 50%. This was slightly lower in pure methanol extract. Ethanolic extract exhibited least activity as seen for reducing power assay. For the FF, the water media showed a slightly lesser activity than CF, which ranged from 21 to 28.5%. The activity for FF in 80% methanol was almost similar to what was seen for CF. However, in methanol (31–41%) and ethanol extract (16–24%), a higher extent of activity was observed in FF. It might be noted here that CF and FF of flour were only marginally different in their fibre profile and did not differ significantly in tannin, polyphenol and flavonoid contents between CF and FF.
Figure 3. FRSA of grain flour fractions in different extracts
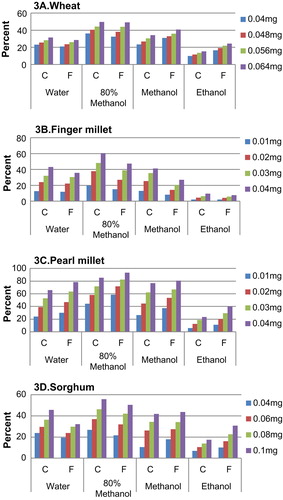
The FRSA of finger millet showed the highest activity in 80% methanol extract for the CF sample (19.76–60.52%) with 0.01–0.04 mg sample concentration. The corresponding values for the FF ranged between 15.07 and 47.29%. This was followed by water and methanol extract, which were in similar range. In water media, the CF exhibited an activity of 43.15% at the highest concentration, which was lowered to 35.67% for the fine fraction. The methanol media recorded similar values for CF with slight variations (12.85–41.4%), and the FF in methanol, however, showed a much lower range of 8–27%. In ethanol extracts, a very low activity was seen both for CF (a maximum of 9.56%) and FF (a maximum of 7.69%). These results are similar to what was seen in the total antioxidant activity assay.
The range of concentration used for determination of FRSA assay for pearl millet was between 0.01 and 0.04 mg. As observed for other cereals, the 80% methanol fraction exhibited the highest activity and pure ethanol extract showed least activity. In all media, the FF fraction had higher FRSA than the CF. For the water media, values were 24.2–64.9% for the CF and 30.1–78.3% for the FF. The 80% methanol extracts exhibited a range of FRSA between 44.3 and 85.5% for the CF and 58.7–93.4% for the FF. These were the highest range of activity. Methanol alone showed an activity of 76.7% for CF at the highest concentration and 80.64% for FF. Ethanol was least with corresponding values of 23.4 and 39.86%.
The range of concentrations used for the FRSA assay for sorghum ranged between 0.04 and 0.1 mg. As observed for the other samples, the highest activity could be recorded in the methanolic extract with a range of 26.87–55.87% CF. FRSA for the FF was slightly lesser ranging between 21.58 and 50.42%, the water media followed a similar pattern wherein CF flour exhibited a higher activity in comparison to FF. Different results were obtained in pure methanolic and ethanolic extracts, where the FF showed a similar or higher activities. These can be attributed to the content of AC which exhibited a varied pattern in sorghum.
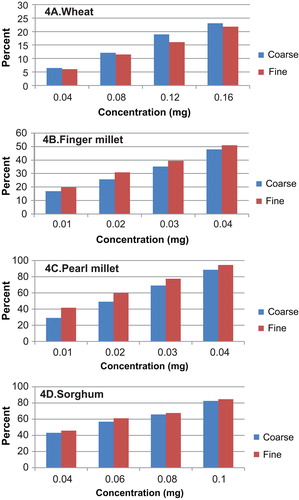
The FRSA of all enzyme-treated flour samples presented in Figure shows that between the CF and FF of all flour, the differences were very marginal. CF of wheat had a higher FRSA than the finer fraction measured in the range of 0.04–0.16 mg concentration. Finger millet and pearl millet were measured at a much lower concentration ranging from 0.01 to 0.04 mg. The FF of finger millet showed a higher activity (19.87–50.97%) than CF. Pearl millet showed much higher activity than finger millet with a maximum of 94% at 0.04-mg concentration. The differences in the antioxidant activity of sorghum flour fraction were very marginal with values ranging from 43 to 84%. Between different fractions, higher activity was seen for wheat in CF and for all other grains in FF.
Figure 4. FRSA of enzyme-treated grain flour fractions
3.6. Intersample comparison between reducing power and free radical scavenging of different grain flours
To facilitate comparison between the antioxidant activity of different grain flours, the reducing power and FRSA measured at 0.04-mg concentration for all samples are compiled in Table . The table shows that among CF of all grain flours, finger millet had the highest reducing power followed by pearl millet, sorghum and wheat. In the fine fraction, similar results were seen though there were variations depending upon the media of extraction; higher absorbance was observed in 80% methanol finger millet and in pure methanol for pearl millet. For FRSA, pearl millet exhibited the highest antioxidant activity in all media followed by finger millet, wheat and sorghum for both CF and FF. Among CF, the highest activity was seen in 80% methanol and among FF, except ethanol all other fractions showed higher values for pearl millet. These results indicate there are differences in the antioxidant activity among samples and also the smaller millets like finger millet, sorghum and pearl millet show a very high antioxidant activity. The intersample comparison for the digested sample extracts showed that coarse finger millet had the highest reducing power. For wheat and sorghum, the FF showed a higher value. The FRSA did not show any significant difference between CF and FF of flour; however, it was highest for pearl millet, followed by finger millet, sorghum and wheat. The high antioxidant activity seen among millets can be attributed to their high polyphenol content.
Table 4. Reducing power and FRSA of different grain fractions: intersample comparison at equalized (0.04 mg) concentration
4. Conclusion
The results of the study can be summarized as follows—differential sieving of grain flours influenced the nutritional composition of fractions significantly. CF of finger millet and FF of pearl millet and sorghum exhibited high AC. Wheat samples showed variable results in different media. Millets had higher AC and activity in comparison to wheat. Enzyme digestion of grain had more of extractable AC and all enzyme-treated flours have higher antioxidant activity. Enzymatic digestion of whole grain could release a higher extent of bioactive components from food matrix, which showed higher antioxidant activity. In practical terms, the study shows the benefit of whole grain consumption as well as the presence of phytochemicals in underutilized smaller millets.
Additional information
Funding
Notes on contributors
Jamuna Prakash
The first author was a graduate student of the Institution, and this work was undertaken as a part of her studies. The senior author is a food scientist, who supervised the research work. The research team of senior author is engaged in research related to product formulations, sensory analysis, fortification of foods, compositional analysis of formulated foods, self-stability studies, etc. Specifically, food matrix variability and nutritional composition of foods, digestibility and availability of nutrients, factors influencing functional properties of foods, effects of processing on nutritional quality and antioxidant properties of foods are some of the prominent research areas of the senior author. She has a number of publications to her credit including research and review papers, book chapters, book reviews, etc. She serves on the editorial board of many journals in the field of food science and nutrition.
References
- Arvouet-Grand, A. , Vennat, B. , Pourrat, A. , & Legret, P. (1994). Standardisation d’un extrait de propolis et identification des principaux constituants [Standardization of propolis extract and identification of principal constituents]. Journal de Pharmacie de Belgigue , 49 , 462–468.
- Asp, N. G. , Johansson, C. G. , Hallmer, H. , & Siljestroem, M. (1983). Rapid enzymic assay of insoluble and soluble dietary fiber. Journal of Agricultural and Food Chemistry , 31 , 476–482.10.1021/jf00117a003
- Association of Official Analytical Chemists . (1990). Official method of analysis . Washington, DC: Author.
- Association of Official Analytical Chemists . (2005). Official methods of analysis (18th ed.). Washington, DC: Author.
- Awika, J. M. , Rooney, L. W. , & Waniska, R. D. (2005). Anthocyanins from black sorghum and their antioxidant properties. Food Chemistry , 90 , 293–301.10.1016/j.foodchem.2004.03.058
- Bancirova, M. (2010). Comparison of the antioxidant capacity and the antimicrobial activity of black and green tea. Food Research International , 43 , 1379–1382.10.1016/j.foodres.2010.04.020
- Bhavya, S. N. , & Prakash, J. (2012). Nutritional composition and quality of whole grain ready-to-eat breakfast cereals. Indian Journal of Nutrition and Dietetics , 49 , 417–425.
- Bouis, H. E. (2000). Enrichment of food staples through plant breeding: A new strategy for fighting micronutrient malnutrition. Nutrition , 16 , 701–704.10.1016/S0899-9007(00)00266-5
- Cukelj, N. , Novotni, D. , & Curie, D. (2010). Review—Antioxidant properties of whole grain cereals. Journal of Food Technology, Biotechnology and Nutrition , 5 , 18–23.
- Devi, P. B. , Vijayabharathi, R. , Sathyabama, S. , Malleshi, N. G. , & Priyadarshini, V. B. (2011). Health benefits of finger millet (Eleusine coracana) polyphenols and dietary fiber: A review. Journal of Food Science and Technology . doi:10.1007/S13197-011-0584-9
- Dykes, L. , & Rooney, L. W. (2006). Sorghum and millet phenols and antioxidants. Journal of Cereal Science , 44 , 236–251.10.1016/j.jcs.2006.06.007
- Fan, L. , Zhang, S. , Yu, L. , & Ma, L. (2006). Evaluation of antioxidant property and quality of breads containing Auricularia auricula polysaccharide flour. Food Chemistry , 101 , 1158–1163.
- Fardet, A. (2010). New hypotheses for the health-protective mechanisms of whole-grain cereals: What is beyond fibre? Nutrition Research Reviews , 23 , 65–134.10.1017/S0954422410000041
- Fardet, A. , Rock, E. , & Rémésy, C. (2008). Is the in vitro antioxidant potential of whole-grain cereals and cereal products well reflected in vivo . Journal of Cereal Science , 48 , 258–276.10.1016/j.jcs.2008.01.002
- Hahn, D. H. , & Rooney, L. W. (1986). Effect of genotype on tannins and phenols of sorghum. Cereal Chemistry , 63 , 4–8.
- Luten, J. , Crews, H. , Flynn, A. , Van Dael, P. , Kastenmayer, P. , Hurrell, R. , … Frohlich, W. (1996). Interlaboratory trial on the determination of the in vitro iron dialysability from food. Journal of the Science of Food and Agriculture , 72 , 415–424.10.1002/(ISSN)1097-0010
- Matthäus, B. (2002). Antioxidant activity of extracts obtained from residues of different oilseeds. Journal of Agricultural Food Chemistry , 50 , 3444–3452.10.1021/jf011440s
- Nambiar, V. S. , Sareen, N. , Daniel, M. , & Gallego, E. B. (2012). Flavonoids and phenolic acids from pearl millet (pennisetum glaucum) based foods and their functional implications. Functional Foods in Health and Diseases , 2 , 257–264.
- Oghbaei, M. , & Prakash, J. (2012). Bioaccessible nutrients and bioactive components from fortified products prepared using finger millet (Eleusine coracana). Journal of the Science of Food and Agriculture , 92 , 2281–2290.10.1002/jsfa.v92.11
- Oghbaei, M. , & Prakash, J. (2013). Effect of fractional milling of wheat on nutritional quality of milled fractions. Trends in Carbohydrate Research , 5 , 53–58.
- Oyaizu, M. (1986). Studies on products of browning reaction. Antioxidative activities of products of browning reaction prepared from glucosamine. The Japanese Journal of Nutrition and Dietetics , 44 , 307–315.10.5264/eiyogakuzashi.44.307
- Pérez-Jiménez, J. , Arranz, S. , Tabernero, M. , Díaz- Rubio, M. E. , Serrano, J. , Goñi, I. , & Saura-Calixto, F. (2008). Updated methodology to determine antioxidant capacity in plant foods, oils and beverages: Extraction, measurement and expression of results. Food Research International , 41 , 274–285.10.1016/j.foodres.2007.12.004
- Prakash, J. (2013). Wholegrain nutrition: Rediscovering the hidden wealth. Indian Food Industry , 32 , 45–46.
- Prakash, J. (2014). Enhancing the bioavailability of natural and synthetic fortificants from foods through alteration in compositional matrices. Nutrition Foundation of India Bulletin , 35 , 5–8.
- Prieto, P. , Pineda, M. , & Aguilar, M. (1999). Spectrophotometric quantitation of antioxidant capacity through the formation of a phosphomolybdenum complex: Specific application to the determination of Vitamin E. Analytical Biochemistry , 269 , 337–341.10.1006/abio.1999.4019
- Ranganna, S. (1986). Handbook of analysis and quality control for fruit and vegetable products (2nd ed.). New Delhi: McGraw-Hill.
- Saura-Calixto, F. (2011). Dietary fiber as a carrier of dietary antioxidants: An essential physiological function. Journal of Agricultural Food Chemistry , 59 , 43–49.10.1021/jf1036596
- Saura-Calixto, F. S. , Pérez-Jiménez, J. P. , & Goñi, I. (2009). Contribution of cereals to dietary fibre and antioxidant intakes: Toward more reliable methodology. Journal of Cereal Science , 50 , 291–294.10.1016/j.jcs.2009.04.008
- Siddiqui, A. , & Prakash, J. (2014). Dietary fiber and related antioxidant components from cereal sources and their role in health. Trends in Carbohydrate Research , 6 (1), 1–19.
- Singh, R. , Chidambara Murthy, K. , & Jayaprakasha, G. (2002). Studies on the antioxidant activity of pomegranate (Punica granatum) peel and seed extracts using in vitro models. Journal of Agricultural Food Chemistry , 50 , 81–86.10.1021/jf010865b
- Sivam, A. S. , Sun-Waterhouse, D. , Quek, S. Y. , & Perera, C. O. (2010). Properties of bread dough with added fiber polysaccharides and phenolic antioxidants: A review. Journal of Food Science , 75 , R163–R174.10.1111/j.1750-3841.2010.01815.x
- Slavin, J. (2004). Whole grains and human health. Nutrition Research Reviews , 17 , 99–110.10.1079/NRR200374
- Vitaglione, P. , Napolitano, A. , & Fogliano, V. (2008). Cereal dietary fibre: A natural functional ingredient to deliver phenolic compounds into the gut. Trends in Food Science and Technology , 19 , 451–463.10.1016/j.tifs.2008.02.005
- Wang, H. , Cao, G. , & Prior, R. L. (1996). Total antioxidant capacity of fruits. Journal of Agricultural Food Chemistry , 44 , 41–47.
- Zieliński, H. , & Kozłowska, H. (2000). Antioxidant activity and total phenolics in selected cereal grains and their different morphological fractions. Journal of Agricultural and Food Chemistry , 48 , 2008–2016.10.1021/jf990619o