
 ?Mathematical formulae have been encoded as MathML and are displayed in this HTML version using MathJax in order to improve their display. Uncheck the box to turn MathJax off. This feature requires Javascript. Click on a formula to zoom.
Abstract
Land evaluation is a foundation for sustainable land resource planning and management. In Ethiopia, national economic development is highly dependent on agriculture. And, the productivity of the land is low as a result of land degradation due to mismanagement of the land and intensive cultivation; this situation is worse in Ethiopian Highlands like Andit Tid watershed. Therefore, matching crop requirement with resource available through land suitability analysis has become an urgent need to sustain the productivity of agricultural land in the study area. This study aimed to address land suitability analysis by using geographical information system-based multi-criteria approach in Andit Tid watershed. The analysis of land suitability for major crops (wheat and barley) revealed that, though, there are slight variation in suitable classes for each crop, most part of the watershed was moderately suitable for both crops with 266.55 ha (77.42%) and only very small part of the land 2.43 ha (0.51%) was highly suitable for both crops. On the other hand, 9.3 ha (2%) and 3.6 ha (0.77%) of the land was marginally suitable and not suitable for both wheat and barley crops, respectively. The main limiting factors for land suitability were soil depth, texture, temperature, slope and erosion hazard. The spatial distribution showed that most of the cultivation currently practised in marginally suitable land in the lower part of the watershed. Most of the land parcel being used against its suitability potential in study area. Thus, land-use pattern needs to be modified based on its suitability potential.
PUBLIC INTEREST STATEMENT
In Ethiopia, Agriculture is the basis for economy. Wheat, barley, maize, sorghum, oats and millet are major cereals which are essential for this economy. Currently, most of these crops cultivated in less suitable and degraded areas due to mismanagement of the land, shortage of fertile land and pressing demand for food. Consequently, low productivity becomes problematic in most part of Ethiopian Highland areas. To alleviate this problem, land evaluation which identifies the suitable and not suitable land for crop production is significant to plan management. This study highlights the role of GIS-based multi-criteria approach to identify areas which are highly suitable, moderately suitable and not suitable for barley and wheat crops in the study area. The result showed that only small part of the watershed was highly suitable for those crops and most part of the area was moderately suitable. Practically, land has been used against its suitability classes in the study area.
1. Background
Worldwide, the amount of cultivated land is limited, and most land has been degraded as irreversibility and become unsuitable for agricultural production (Verheye, Citation2008). Land evaluation is a foundation for sustainable land resource planning and management since it help us to know whether the resources are degraded or enhanced in quality (Dumanski et al., Citation2002; Mohana, Mariappan, & Manoharan, Citation2009). FAO (Citation1976) defines land suitability as “the fitness of a given parcel of land for specific uses”. Consequently, land suitability assessment is land evaluation which usually conducted to determine specific land use for a particular location and identify limiting factors for a particular crop production (AbdelRahman, Natarajan, & Hegde, Citation2016; Mu, Citation2006). The assessment of land suitability depends on land capability as well as other factors such as land quality, proximity to different accesses, land ownership, customers demand and economic values (Counsel, Citation1999).
Ethiopia’s economic development is highly dependent on agricultural production since agriculture constitutes 46.6% of the national gross domestic product (CSA, Citation2008). Wheat, barley, maize, sorghum, oats, millet are major cereals which are essential for Ethiopia’s agriculture and food economy (Taffesse, Dorosh, & Asrat, Citation2012). Most of agricultural practice has been done in Ethiopian highlands (Teshome, Citation2014). In this area, the competition for land is high due to demand for food and space as a result of population pressure. This results in degradation of resource in Ethiopian highlands. Marginal land has been used for cultivation and low productivity remains the major constraint for agriculture sector where yields are less than 1 t ha−1 (Engda, Citation2009; Pender & Gebremedhin, Citation2007; Verheye, Citation2008). Therefore, land suitability analysis becomes a critical step for land management planning and implementation in Ethiopia.
Land suitability evaluation according to FAO standards has been applied in many parts of the world, particularly in the developing countries (FAO, Citation2007b). In Ethiopia, a number of investigations were conducted to evaluate land suitability for crops and irrigation (Agidew, Citation2015; Alemu et al., Citation2013; Ayalew, Citation2014; Girma, Moges, & Quraishi, Citation2015; Hailu, Kibret, & Gebrekidan, Citation2015; Liambila & Kibret, Citation2016; Mekonen & Kebede, Citation2011; Melak, Citation2007; Mengesha, Citation2014; Motuma, Suryabhagavan, & Balakrishnan, Citation2016; Nahusenay & Kibebew, Citation2015; Rabia, Citation2012; Selassie, Ayalew, Elias, & Getahun, Citation2014; Teka & Haftu, Citation2012; Worqlul et al., Citation2017; Yitbarek, Kibret, Gebrekidan, & Beyene, Citation2013). These studies are inadequate to made decision on proper utilization of resources in Andit Tid watershed, because locally adapted evidence from the combination of topographic, soil, climatic and management factors is needed for proper management decision where the productivity of the land in the study area is limited; this situation also aggravated through short fallow period as a result of uncontrolled grazing (Engda, Citation2009). Consequently, agricultural production in the area has become unsustainable and marginal lands are being converted into cultivated lands. Moreover, according to Rabia and Terribile (Citation2013), land suitability is a multi-criteria problem which involve with the number of parameters; therefore, the evaluation needs multi-criteria approach. The availability of GIS and multi-criteria decision analysis (MCDM) methods allow combining knowledge derived from different sources to support land-use planning and management (Malczewski, Citation2000). The most commonly used MCDM are analytic hierarchy process (AHP), weighted linear combination, ordered weighted averaging, ELECTRE, PROMETHEE, VIKOR and multiple-objective land allocation (Rikalovic, Cosic, & Lazarevic, Citation2014). Saaty (Citation1996) proposed analytical network process (ANP) to overcome the problem of interdependence and feedback effects observed in AHP method. ANP method has become a new popular planning and decision-making approach that allows to determine the relative weights of the evaluative criteria (Alemu, Citation2011; Saaty, Citation2016). It enables to create a network unlike other MCDM methods. It is hardly addressed land evaluation by using by integrating GIS and ANP in Ethiopia in general; only a recent study by Worqlul et al. (Citation2017) assessed land suitability for irrigation for Ethiopia. Therefore, this study aimed at land suitability evaluation by using GIS-based multi-criteria decision tool.
2. Research methods
2.1. The setting
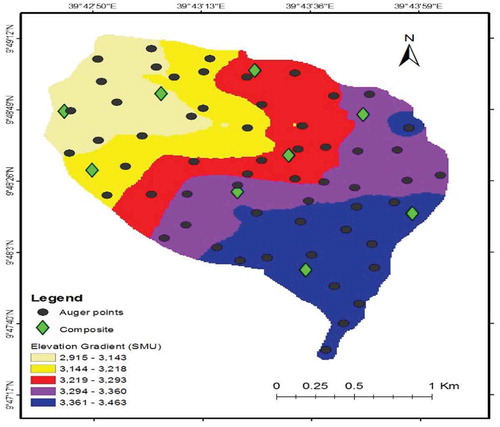
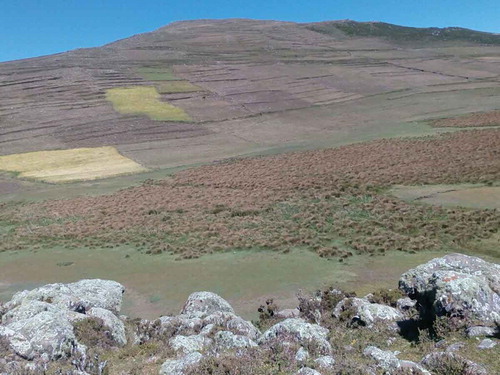
Andit Tid watershed situated 180 km northeast of Addis Ababa and approximately 60 km east of Debre Berehan adjacent to the Debre Berhan-Mekelle highway at 39°43′E and 9°48′N geographic location (Figure ). It is one of the six Soil Conservation Research Program watershed in Ethiopia since 1982 (Alemu et al., Citation2013). Water Land Resource Centre (WLRC) is responsible for gathering long-term data such as climatic, soil, erosion and sedimentation etc. in the study area. The catchment drains westward in to the Blue Nile basin, and to the east of the catchment, an escarpment separates the Shewa Plateau from the Awash Plains in the Rift Valley. The size of the watershed topographically estimated to be 477.5 ha (Engda, Citation2009).
Figure 1. Map of the study area.
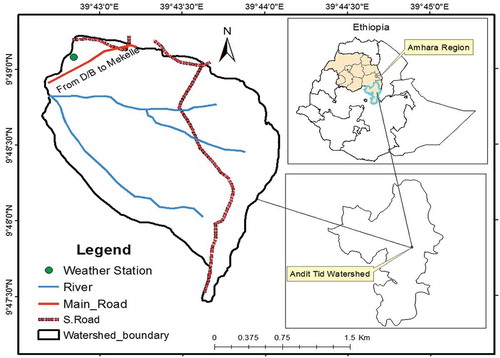
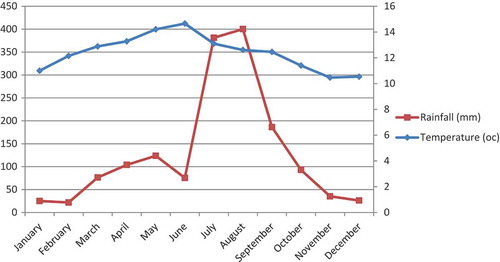
The watershed characterized generally by humid climate which have mean annual temperature that is 12.54°C and average rainfall of 1,489 mm per year. The rainfall pattern of the area is bimodal, the smaller (belg) rainy season is usually from March to May and the main (kiremt) rainy season is from July to October (Figure ).
Figure 2. Mean monthly rainfall and temperature of Andit Tid watershed.
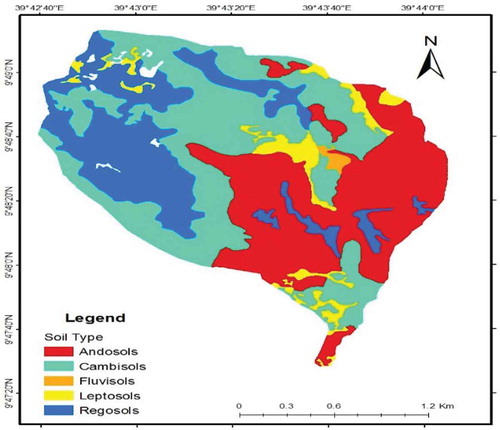
The geological formation of the watershed belongs to volcanic rocks (rhyolites, trachites, tuffs and basalts) which is the result of tertiary volcanic eruption as similar to most central highland of Ethiopia (Hurni, Citation2000). Andosols, Cambisols, Fluvisols, Leptosols and Rogosols are different soil types available in the watershed (Figure ). Among these soils, Cambisols (37%), Andosols (32%) and Rogosols (24%) cover the large portion of the study area. Andosols dominate in the wurch zone while Regosols dominate in the dega zone (Figure ).
Figure 3. Major soil types of Andit Tid watershed.
Field observation in the study catchment revealed that smallholder cereal plough cultivation is the dominant cultivation system in the area and most of the cultivated fields are usually planted with barely. According to Engda (Citation2009), wheat, linseed, peas and beans mix with barely are the common crops growing system in the area. Growing period of most crops in study area is about 175 days and the productivity of the land is limited.
3. Data sources and general methodology
Data were collected from primary field assessment and observation, questioner and discussion and secondary sources. Eleven expert’s opinions from Debre Berehan Research Centre and field assistance were used to identify the influential factors for suitability of the land for major crops through systematic questioners. The experts were selected based on their qualification and experience on natural resource management and agronomy.
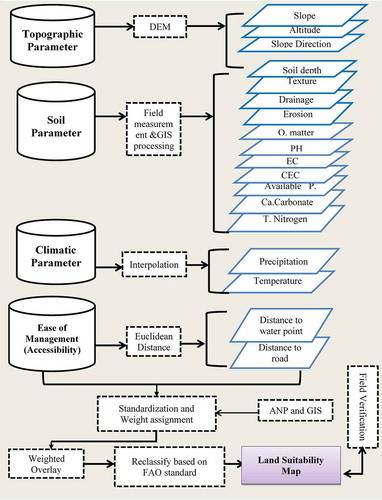
A land evaluation procedure was set based on Food and Agriculture Organization (FAO) 1976 guideline in terms of land suitability. Topographic, soil, climate and management factors were used to evaluate the performance of land in Andit Tid watershed. These were selected based on agronomic knowledge of local experts and reviews of existing literatures such as FAO framework for land evaluation (FAO, Citation1976, Citation1983, Citation2007b). Eighteen criteria were used for land suitability classification for major crops namely barley and wheat in the watershed. These criteria were soil depth, soil texture, soil drainage (permeability), soil erosion, slope, aspect, altitude fertility and soil chemical characteristics (pH, CEC, electrical conductivity [EC], OM, available phosphorus, total nitrogen and calcium carbonate), climatic parameters (temperature and rainfall) and accessibly (distance from road and water point). The summary of methods used presented at Figure .
Figure 4. Summary of methods used in the study.
4. Procedures for land evaluation
4.1. Current land-use mapping
According to FAO (Citation1976), for land evaluation, delineating the current land-use boundary is the first step. Land-use type is a kind of land use described in terms of its products and management practices (FAO, Citation1996). The types of use considered are limited to those which appear to be relevant under the general physical, economic and social conditions prevailing in an area. These kinds of land use serve as the subject of land evaluation. They may consist of major kinds of land use such as rainfed agriculture, irrigated agriculture, grassland, forestry or recreation (FAO, Citation1976).
The current land use/cover was determined from Landsat satellite image downloaded from USGS website (https://earthexplorer.usgs.gov/). Landsat 8 OLI-TIRS of 30 m resolution acquired on 23 September 2017. The image was preprocessed and classified by using supervised classification method with the support of unsupervised classification in ERDAS Imagine 2014 software. In preprocessing stage, radiometric and geometric correction (AbdelRahman et al., Citation2016; Demissie, Yeshitila, Mengistie, & Thomas, Citation2017; Yohannes, Mohammed, & Elias, Citation2017) were performed to correct and enhance the image spectral quality. During image preprocessing, image was also layer stacked and create a subset later image classification was performed by collecting signatures from each class. And, about 125 ground controlling points were used. The study area was classified into five major classes (Table ).
Table 1. description of major land use land cover of Andit Tid watershed
Finally, the classified image was verified with collected GPS points in the field and Google Earth imagery for some inaccessible control points and about a total of 250 random points were generated. During accuracy assessment, user accuracy, producer accuracy, overall accuracy and kappa coefficient were computed from error matrix as suggested by (Congalton, Citation2001) (Annex 1). For further analysis, the classified raster image was exported to ArcGIS software version 10.3.
5. Determination of land-use management conditions
Depending on the nature of the topographic, the combination of free survey and transect walk was used to observe the whole watershed. Observation and recording were done at each land-use type. The management condition depends on different factors such as land goods and service delivery, labour and capital intensity, infrastructure and income level (FAO, Citation1996). In this study, in addition of the status of management practice recording, ease of management data such as distance from road and river were prepared in GIS environment.
6. Land characteristics and quality assessment
Depending on the objectives of the evaluation, relevant important data sets may include soils, landform, climate, vegetation and surface and/or groundwater reserves which need to be prepared (FAO, Citation2007b). In this study, soil, climate and topographic data sets were included.
6.1. Soil sampling and analysis
To determine the amount and spatial distribution of soil structure and nutrient availability, field soil sampling was used. Stratified random sampling was applied based on soil survey manual (FAO, Citation2007a). The stratification was based on altitudinal variation. Five stratums were delineated and all the auger observations were georeferenced with the help of hand held GPS (Figure ). The core sample was taken in zig-zag manner such that all points in the area have an equal chance of being selected as a sampling point (FAO, Citation2000). A total of 57 soil samples were collected, by using Edelman auger at the surface layer (0–30 cm), and bulked into nine composite soil samples for surface soil characterization and crop suitability evaluation purpose. At laboratory called Horticoop Ethiopia (Horticultural) PLC Soil and water analysis Laboratory Bishoftu, Ethiopia, the soil samples were air dried, crushed with mortar and pestle, mixed well and passed through a 2-mm sieve for analysis of chemical characteristics and major nutrient contents (pH, organic matter, electric conductivity, cation exchange capacity, available phosphors, calcium carbonate and total nitrogen) of the soil identified by using scientific procedures and standard methods (Table ).
Table 2. Standard laboratory methods for soil sample analysis
Figure 5. Soil sample points at each stratum.
Moreover, soil depth, drainage and texture data were obtained from WLRC. The maps of these parameters were prepared in GIS environment.
6.2. Soil loss estimation
Soil erosion was estimated by using Revised Universal Soil Loss Equation for Complex Terrain (RUSLE3D) model.
The RUSLE3D model calculates potential average soil loss (A) as follows
A is the annual soil loss by water (t ha−1 year−1), R is the rainfall-runoff erosivity factor (MJ mm ha−1 year−1), K is the soil erodibility factor (t ha−1 per unit R), LS is the slope length and slope steepness factor [–], C is the cover and management factor [–], P is the conservation practices factor [–].
6.3. Topographic, climatic data and accessibility data
The 30-m spatial resolution digital elevation model ASTER GDEM was obtained from Aster Global Digital Elevation Map (http://gdex.cr.usgs.gov/gdex/) and used to generate slope, altitude and aspect by using Spatial Analyst Tool in ArcGIS environment. Rainfall and temperature data were obtained from WLRC and imported to GIS environment for map preparation. River and road map obtained from Ministry of Water and Energy.
7. Matching crops with requirements
Matching crops with their specified requirement which is suitability evaluation, was performed by using the maximum limitation method (FAO, Citation1983; Sys, Van Ranst, & Debaveye, Citation1991). This method takes the most limiting factors to define the land suitability classes. Selected parameters were placed in suitability classes by matching with the requirements of selected crops. In this case, barley and wheat cereal crops were selected for crop suitability evaluation (Annex 2). The selections of crop varieties were made based on their dominantly grown, their importance and low productivity as explained by experts and farmers in the studied area. The crop requirements are expressed by defining optimal, marginal and unsuitable conditions for each land attribute that directly or indirectly influences plant growth, performance and biomass production (Sarkar, Ghosh, & Banik, Citation2014).
8. Suitability analysis
For land suitability analysis, GIS and ANP software were used in combination, since suitable map was produced from the aggregated value of standardized rated and weighted criteria. Criteria standardization and rating were performed mainly by using GIS and criteria weight was processed using ANP model from the collected expert’s opinion.
9. Criteria standardization and rating
Data are measured on different units as well as on different scales of measurements. Thus, it is necessary to standardize the factors before combination and assure they are transformed, if necessary, so that all factor maps are positively correlated with suitability (Voodg, Citation1983). Linear scale transformation is the most frequently used GIS-based approach for criteria standardization (Malczewski, Citation2004). Thus, criteria have been standardized for this study, by using reclassify spatial analyst tool, to make sure that each criterion had an equivalent measurement basis. Simultaneously during reclassification, factor ratings were also assigned for suitability analysis (Table ). Factor ratings are sets of values that indicate how well each factor is satisfied by particular conditions of the corresponding land quality.
Table 3. Parameter weights from pairwise matrix comparison
Table 4. Land index for land suitability classes (adopted from Ashraf & Normohammadan, Citation2011; FAO, Citation1984)
10. Criteria weight estimation
Weight assignment from pairwise comparison for the criteria was based on expert opinion and processed in superDecisions software by designing ANP model. The pairwise comparison technique developed (Saaty, Citation1980) in the context of a decision-making process is a ratio (reciprocal matrix) where each factor is compared with the other criteria, relative to its importance on a scale from 1 to 9 (Saaty, Citation2004). The first step in ANP development was to construct a network; here, we group the criteria into four clusters and each cluster has criteria then the interdependence of the criteria designed. Experts choice obtained from the designed questionnaires to obtain their judgement about the importance of each criterion as suggested by Saaty’s (Citation2004), scale (1–9), for instance 1 is equally important and 9 means extremely important. Consequently, 153 possible paired comparisons were made. The questionnaire example of the paired comparison presented in Annex 3. Then, formation of unweighted supermatrix and weighted supermatrix were performed. Finally, as shown in Table , priorities weight was calculated from pairwise comparison matrix undertaken and eigenvector values based on the formula below.
where wi is the sum of row for pairwise comparison and n is the size of matrix.
The consistency ratio (CR) needs to be computed to check the consistency of comparisons. The sum of criteria weights should be equal to 1. CR ranges from 0 to 1. A CR close to 1 indicates the probability that the matrix’s rating was randomly generated. A CR of 0.1 or less is a reasonable level of consistency (Malczewski, Citation2000; Saaty, Citation1980). In this case, the CR of the matrix of paired comparisons between 18 factors for land suitability was 0.048, which indicates logical judgement.
Consistency index (CI) computed from the formula below:
λmax is the largest eigenvalue of the pairwise comparison matrix and n is the number of classes.
Then, CR given by the following formula (Saaty, Citation1980):
where RI is ratio index/average value of CI for random matrices using Saaty scale.
11. Aggregation of the weight and standardized rated criterion map
Weighted overlay method was used to aggregate standardized rated criteria and weighted criteria to map the suitable land based on equation below. These maps were reclassified based on parametric model of land index to generate FAO land classes which converts suitability values into classes to produce the final map (Table ).
where S is the suitability, Wi is the weight of factor i, and Xi is the criterion score of factor i.
12. Results and discussion
12.1. Land suitability classification for major crops
The spatial land suitability for wheat and barley crops was obtained after the analysis of selected evaluation criteria such as soil physical characteristics (texture, drainage and soil depth), erosion hazard, soil chemical characteristics and fertility status (pH, EC, CEC, Carbonate, OM, TN and AP), topographic factors (slope, altitude and aspect), climatic factors (temperature and rainfall) and ease of management (river/water and road access).
12.2. Topographic factors
The topographic feature of the study area stated by attitude, slope and slope direction as presented in Table , the elevation of the area ranges from 2,915 to 3,463 m a.s.l distributed in dega (2,915–3,202 m) with 30.32% and 69.70% of the area was wurch (above 3,203 m) altitude zone. The watershed generally characterized by moderately sloppy and only small part (10.51%) of the area was gentle slope. Most of the land slope faced to south and north direction (35.37%) and (33.64%), respectively.
Table 5. Topographic features criteria classes with area coverage
12.3. Soil physical characteristics and soil loss
As shown in Table , the soil depth of the study area ranges from very shallow <30 cm to very deep (100–150 cm). Most of the soil was moderately deep (49.90%). Sandy loam (361.68 ha) and loamy sand (87.35 ha) were dominant soil textures. Well-drained soil dominated the study area (73.27%). Excessively drained soil covers 25.81% and the rest less than 1% was moderately drained soil. The soil loss ranges from 10 to 864 t ha−1 year−1. The loss of the soil is generally very high and exceeds very much as compared to tolerable rate (1–12 t ha−1 year−1) by FAO (Citation1996).
Table 6. Soil physical and erosion criteria classes with area coverage
12.4. Soil chemical characteristics and fertility status
The soil chemical properties and fertility status of the soil of Andit Tid watershed are presented in Table . The spatial distribution of pH, EC, CEC, calcium carbonate, available phosphorus, organic matter and total nitrogen also presented.
Table 7. Soil chemical characteristics and fertility status of studied watershed
12.5. pH and EC
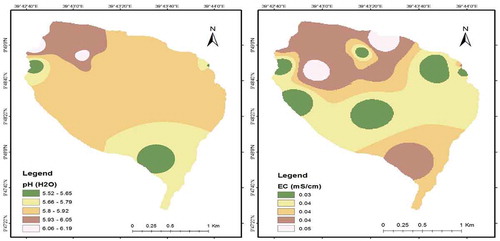
The pH values varied from 5.52 to 6.19; this indicates that the soil of the studies area is moderately acidic. The salinity of the soil was indicated by EC of the soil and the values range between 0.03 and 0.05. The spatial distribution of pH and EC presented in Figure . Most of the soil pH ranges between 5.8 and 5.92 in the middle of the watershed. Similarly, most of the soil EC value was 0.04 mS cm−1, which distributed in all watershed. If the soil has EC < 2, it considered as non-saline soil and the salinity effect is negligible for most crops (Hazelton & Murphy, Citation2007).
Figure 6. pH and EC distribution.
12.6. Cation exchange capacity and calcium carbonate
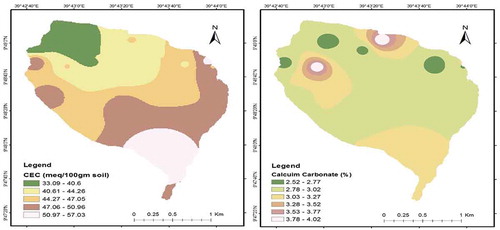
The CEC of the soil varied between 33.09 and 57.03 meq/100 gm soil. The smallest CEC value found in the lower altitude dega zone and the higher values found at the top of the watershed at wurch zone. According to FAO standard, CEC values ranged from high (25–40) to very high (>40) indicated good OM in the soil. The calcium carbonate content of the soil ranges from 2.52% to 4.04% and most of the soil falls under the range of 2.78–3.02% as indicated in Figure below. Calcium carbonate less than 7 generally favourable for agriculture (Hazelton & Murphy, Citation2007).
Figure 7. CEC and calcium carbonate distribution.
12.7. Available phosphorus, total nitrogen and organic matter
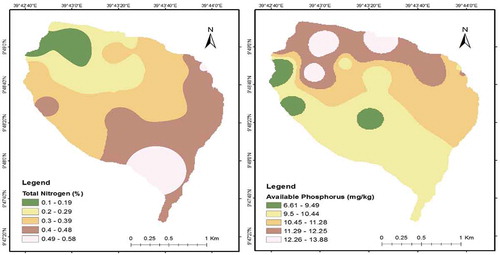
As shown in Table total nitrogen content of the soil in Andit Tid watershed varied from 0.1% to 0.58%, this value ranges from medium to high according to Baruah and Barthakur (Citation1997), soil chemical value interpretation. The spatial distribution showed in the upper part of the watershed; highest percentage of total nitrogen was available. On the other hand, in lower part of the watershed, there is limited per cent of total nitrogen as shown in Figure . Soil available phosphorus in the watershed ranges from 6.61 to 13.88 mg kg−1; therefore, most of the soil available phosphorus was under medium range, since <5 (very low), 5–10 (low), 10–25 (medium) and 25–50 (high) based on (Barber, Citation1984) soil interpretation guideline.
Table 8. Land suitability class description of Andit Tid watershed (adapted from FAO, Citation1976)
Figure 8. Total nitrogen and available phosphorus distribution.
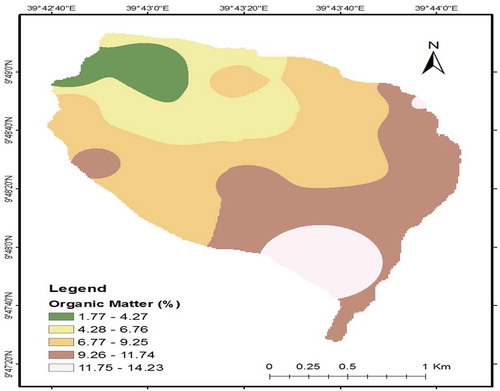
Organic matter content of the soil varied from 1.77% to 14.24% (Table ). If the soil has organic matter rating >4, it is considered as high rate as reported by Tan (Citation1996). The highest organic matter was available at the top of the watershed where disturbance is less and dominated by grass land. On the other hand, the lowest value distributed mostly in the lower part of the watershed where intensive cultivation was dominated (Figure ).
Figure 9. Organic matter distribution.
In general, for the purpose of agriculture, most of the soil chemical characteristics and fertility indicator parameters showed good rating values as compared to scientific standards (Table ).
12.8. Climate and accessibility factors
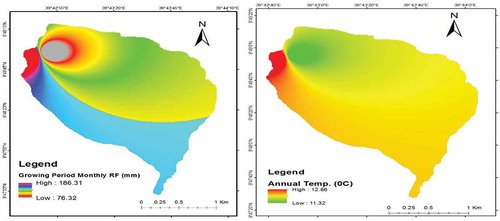
Mean monthly rainfall for two growing periods of the watershed ranges from 76.32 to 186.31 mm and annual temperature varied from 11.32 to 12.80°C. The spatial distribution of these climatic variables presented in Figure .
Figure 10. Growing period monthly rainfall and annual temperature distribution.
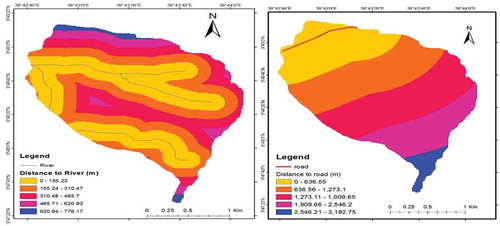
Land suitability also depends on the accessibility factor as reported by FAO (Citation2007b), for the purpose of ease of management. In this case, by using the available river and road, the river distance varied from 0 to 776 m and the distance of the major road ranges from 0 to 3,152 m (Figure ).
Figure 11. map of distance from river and road.
12.9. Land suitable for wheat
Figure shows the map of suitability class of the land for wheat crop cultivation in the studied area. The land comprises S1 (highly suitable), S2 (moderately suitable), S3 (marginally suitable) and N2 (permanently not suitable) as described in Table .
Figure 12. Suitability classes for wheat crop.
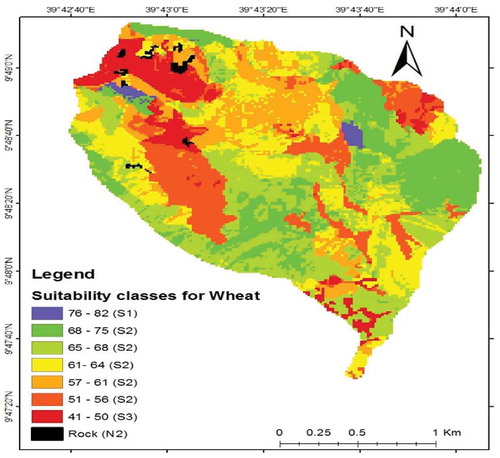
The largest part of the watershed occupied by S2 class with 428.60 ha (90.56%), which indicated that most of the area was moderately suitable for wheat production. Only 4.39 ha (0.93%) of the area is highly suitable for wheat production (Table ). Alemu et al. (Citation2013) reported that 46% of the area in Anjeni watershed highly suitable for wheat crop. On the other hand, only 3% of the land estimated as highly suitable for wheat cultivation in Awulaelo District in Tigray (Rabia, Citation2012). In other study by Motuma et al. (Citation2016), 20.5% of the area were classified as moderately suitable and 79.5% marginally suitable for wheat in South Wello. In this case, 36.68 ha (7.75%) of the land estimated as marginally suitable and less than 1% was not suitable for wheat production. Girma et al. (Citation2015) reported that 61% of the land was not suitable for wheat production and 6% moderately suitable and 33% marginally suitable for wheat crop in Jello watershed, Eastern Ethiopian highland.
Table 9. Suitability classes with their area coverage for wheat
12.9.1. Land suitable for barley
Suitable land for barley in Andit Tid watershed comprises S1, S2, S3 and N2 as shown in Figure . Most of the suitable lands found in upper part of the watershed. This is due to deep and fertile Andosols. This result consistent with Yohannes (Citation1989) reported that good crop yield was found at the dega part of the watershed due to Andosols and longer fallow period.
Figure 13. Suitability classes for barely crop.
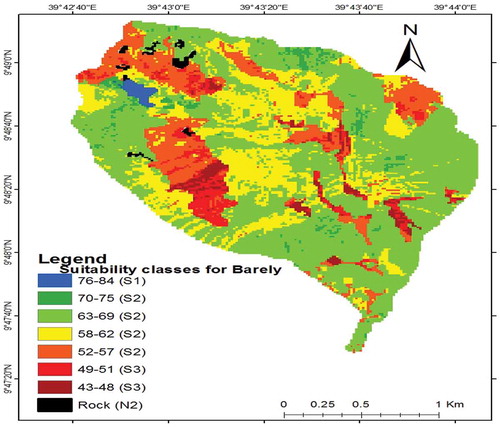
Highly suitable class occupied only 3.33 ha (0.70%). Most part of the watershed was moderately suitable 430.98 ha (91.07%) for barley crop production. The rest area occupied by marginally suitable class 35.35 ha (7.47%) and not suitable rock (0.76%) (Table ). A study by Rabia (Citation2012) reported that only 1.3.% of the total land occupied by highly suitable class and more than 80.5% of the land was not suitable for barely crop.
Table 10. Suitability classes with their area coverage for barely
Hailu et al. (Citation2015) estimated that 9.93% of the study area is marginally suitable, 51.39% of the study area was permanently unsuitable, 38.68% was currently unsuitable for both wheat and barley production in Kabe watershed, South Wello zone. Similarly, 65.13%, 23.62%, and 11.25% of the land is moderately, marginally and not suitable, respectively, for wheat and barley crops (Nahusenay & Kibebew, Citation2015).
The main limitation factors for wheat and barley crops identified in the study area were soil depth, texture, temperature and slope and erosion hazard (Table ). Teka and Haftu (Citation2012) reported that the most important limiting factors in wheat and barley productions in the different sites under review included physical properties of the soil such as soil texture and soil depth. Hailu et al. (Citation2015) also reported that OM content, total nitrogen, soil drainage, slope and flooding hazard were found to be the limiting factor for wheat and barley crop production. In other similar study also reported that altitude, soil depth, erosion and surface stoniness were the main limiting factor for wheat and barley production in Wadla Delanta district (Nahusenay & Kibebew, Citation2015). Specifically, for wheat production, the main limiting factors for wheat production were surface coarse fragments percentage topography and organic carbon (Rabia, Citation2012) and fertility status (exceedingly available P) (Girma et al., Citation2015).
Table 11. Pairwise comparison matrix of criteria
12.10. Suitability classification for management planning
For detail management planning, the suitability of a land for particular purpose is also important (Kang & Tripathi, Citation2014; Rossiter, Citation1994). A single land unit can provide multiple purpose or crops shared similar land unit (FAO, Citationn.d.). As shown in Table , 281.88 ha (80.7%) of the land share the same land class for both crops for different land classes (S1 or S2 or S3 or N2); only very small part of the land 2.43 ha (0.51%) was highly suitable for both crops. Furthermore, 266.55 (77.42%) of the land was moderately suitable for both crops. Similarly, 9.3 ha (2%) and 3.6 ha (0.77%) of the land were marginally suitable and not suitable for both wheat and barley crops, respectively. The rest 191.38 ha (19.3%) share different suitability classes for wheat and barley crops; 2.8 ha (0.60%) of the land was highly suitable for barely but moderately suitable for wheat crop. On the other hand, 4.05 ha (0.86%) of the land was highly suitable for wheat and moderately suitable for barely. On the other hand, about 24.70 ha (5.22%) of the land was moderately suitable for barely and marginally suitable for wheat crop. There was 0.4 ha (0.09%) of land which is marginally suitable for barely and highly suitable for wheat crop and 59.53 ha (12.57%) of the area was marginally suitable for barely and moderately suitable for wheat (Table ).
Table 12. Suitability classes area coverage for wheat and barley crops
Figure showed land unit suitability map for wheat and barley crops and as compared to the current land use (Figure ), most land unit was not used based on its suitability classes. Most farming practised in marginally and moderately suitable areas for cultivation of these crops. This finding supported by Yohannes (Citation1989) reported that most of cultivation practised on shallow soil depth (<40 cm), which contrast with FAO general recommendation for favourable cultivation (50–60 cm) in the study area. On the other hand, the present small land parcel which claim to be highly suitable for cultivation occupied by eucalyptus-dominated forest land, which might bring a risk of water shortage (Gindaba, Rozanov, & Negash, Citation2004) and yield reduction (Chanie, Collick, Adgo, Lehmann, & Steenhuis, Citation2013) due to resource competition and allopathic impact of Eucalyptus trees.
Figure 14. Suitable land classes for wheat and barley (a). Current land use/cover (b).
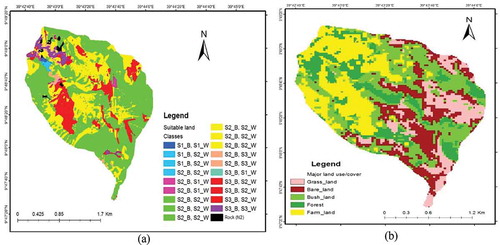
Management measure needed to improve the suitability of land units particularly for marginally suitable lands. As indicated by FAO (Citationn.d.), a particular land mapping unit might be classified as marginally suitable for arable farming and highly suitable for forestry. Therefore, depending on the target of management, decision could be made. Alemu et al. (Citation2013) reported that soil conservation measures are playing an important role in improving the ecosystem services in the form of improving suitability of the soils for most crops. Consequently, different soil and water conservation measures are important to avoid further degradation. Since early 1980s, there were efforts to conserve soil and water through Fanyaa juu, soil bund, grass strip and terracing but not successful (Engda, Citation2009; Holden, Shiferaw, & Pender, Citation2005). This situation also confirmed during field observation. There were stone bund terraces in some part of the watershed and grass stripes only established in the upper part of the watershed. In addition, currently uncontrolled grazing practised dominantly in the study area; this was also reported by Engda (Citation2009) in this study area. Teshome (Citation2014) indicated that overgrazing could be one of the major cause for land conversion and fragmentation.
13. Conclusion and recommendations
Agricultural land suitability of the watershed comprises areas which are highly suitable (S1), moderately suitable (S2), marginally suitable (S3) and permanently not permanently suitable (N2) for wheat and barley crops. Most part of the watershed land is moderately suitable and only small portion are highly suitable, which is without significant limitation to cultivate wheat and barley. Most of marginally suitable land with severe limiting factors such as soil depth, texture, slope, temperature and erosion hazards located in the lower part of the watershed and dominated by the current farm land. This indicates that there is a mismatch between land use and suitability classes (requirement). This situation has become worse as the current resource management practice continues without any improvement. It is recommended that the current land-use pattern need to be modified according to its suitability classes and plan land management measures accordingly. To achieve successful land management, introducing alternative income generation mechanism could help the poor farmers who are totally depend on fragile land for many years. This also possibly will reduce the pressure on the land and provide an opportunity for rehabilitation and restoration of the area.
Ethical approval
This article does not contain any studies with human participants or animals performed by any of the authors.
Competing interest
The authors declare no competing interests.
Citation information
Cite this article as: Land suitability assessment for major crops by using GIS-based multi-criteria approach in Andit Tid watershed, Ethiopia, Hamere Yohannes and Teshome Soromessa, Cogent Food & Agriculture (2018), 4: 1470481.
Cover image
Source: Author.
Acknowledgements
We acknowledge Addis Ababa University for financial and facility support. We also thankful for Water Land Resource Centre for providing major soil and climate data. Mr. Solomon and Mr. Weldemariam Seifu assistance during field work was tremendous.
Additional information
Funding
Notes on contributors

Hamere Yohannes
Hamere Yohannes is a PhD candidate in Center for Environmental Science at Addis Ababa University and lecturer at department of Natural Resource Management in Debre Berehan University. She teaches land degradation and rehabilitation, introduction to environmental science, climatology, environment and development and land-use planning courses and engaged on research and community services. She published more than eight research and review articles in the internationally peer reviewed journals.
Teshome Soromessa
Teshome Soromessa (PhD) is associate professor of Environmental Science at the College of Natural Science in Addis Ababa University and director for Center for Environmental Science. He specialized in Ecology and Diversity. He teaches vegetation ecology and restoration courses. He actively engaged on society problem solving researches. Dr. Teshome published more than 125 papers in reputable internationally peer-reviewed journals and advised more than 90 PhD and MSc. students.
References
- AbdelRahman, M. A. E., Natarajan, A., & Hegde, R. (2016). Assessment of land suitability and capability by integrating remote sensing and GIS for agriculture in Chamarajanagar district, Karnataka, India. The Egyptian Journal of Remote Sensing and Space Science, 19(1), 125–28. doi:10.1016/j.ejrs.2016.02.001
- Agidew, A. A. (2015). Land suitability evaluation for sorghum and barley crops in South Wollo Zone of Ethiopia. Journal of Economics and Sustainable Development, 6(1), 14–26.
- Alemu, G. T. (2011, June). GIS based and analytical network process based multi criteria decision aid for sustainable urban form selection of the Stockholm. Stickhold, Sweden: Royal Institute of Technology.
- Alemu, W. G., Amare, T., Yitaferu, B., Selassie, Y. G., Wolfgramm, B., & Hurni, H. (2013). Impacts of soil and water conservation on land suitability to crops : The case of Anjeni Watershed, Northwest Ethiopia. Journal of Agricultural Science, 5(2), 95–109. doi:10.5539/jas.v5n2p95
- Ashraf, S., & Normohammadan, B. (2011). Qualitative evaluation of land suitability for wheat in Northeast-Iran using FAO methods Shahram. Indian Journal of Science and Technology, 4(6), 703–707.
- Ayalew, G. (2014). Land suitability evaluation for cereal and pulse crops using geographical information system in East Amhara. Journal of Environment and Earth Science, 4(19), 2224–3214.
- Barber, S. A. (1984). Soil neutrient bioavailabilty, a mechanistic approach. New York: Willey.
- Baruah, T. C., & Barthakur, H. P. (1997). A textbook of soil analysis. New Delhi: Vikas Publishing House Pvt. Ltd.
- Chanie, T., Collick, A. S., Adgo, E., Lehmann, C. J., & Steenhuis, T. S. (2013). Eco-hydrological impacts of Eucalyptus in the semi humid Ethiopian Highlands : The Lake Tana Plain. Journal Hydrol Hydromech, 61(1), 21–29. doi:10.2478/johh-2013-0004
- Congalton, R. G. (2001). Accuracy assessment and validation of remotely sensed and other spatial information. International Journal of Wildland Fire, 10, 321–328. doi:10.1071/WF01031
- Counsel, A. P. (1999). Land capability assessment guidelines. Retrieved from http://apps.actpla.act.gov.au/tplan/planning_register/register_docs/landcapabilitygl5a.pdf
- CSA. (2008). Summary and statistical report of the 2007 population and housing census _ population size by age and sex. Addis Ababa: Federal Democratic Republic of Ethiopia, Population Census Commision
- Demissie, F., Yeshitila, K., Mengistie, K., & Thomas, S. (2017). Land use/Land cover changes and their causes in Libokemkem District of South Gonder, Ethiopia. Remote Sensing Applications: Society and Environment, 8(April), 224–230. doi:10.1016/j.rsase.2017.10.001
- Dumanski, J., Bindraban, P. S., Pettapiece, W. W., Bullock, P., Jones, R. J. A., & Thomasson, A. (2002). Land classification, sustainable land management, and ecosystem health. In Encyclopedia of Life Support Systems. Oxford, UK, II: EOLSS Publishers.
- Engda, T. A. (2009). Modeling rainfall, runoff and soil loss relationships in the Northeastern Highlands of Ethiopia, Andit Tid Watershed. New York, USA: Cornell University.
- FAO. (1976). A framework for land evaluation. Rome, Italy: Author.
- FAO. (1983). Guidelines: Land evaluation for rainfed agriculture. Rome, Italy: Das, P.T & Sudhakar, S.
- FAO. (1984). Crop environmental requirements; report prepared for the Government of Ethiopia by FAO acting as executing agency for the UNDP. Land evaluation: Technical report 5, Part III. Rome, Italy.
- FAO. (1996). Land husbandry - components and strategy. agriculture (Roose, Eri). Retrieved from https://doi.org/ISBN92-5-103451-6
- FAO. (2000). Guidelines on integrated soil and nutrient management and conservation for FFS. Rome, Italy: Land and Plant Nutrition Management Service Land and Water Development Division.
- FAO. (2007a). Field Survey Manual. Landform – Soil - Soil Erosion - Land Use - Land Cover (Project Report No L- 01). Somalia Water and Land Information Management and European union.
- FAO. (2007b). Land evaluation, towards a revised framework. Land and Water Discussion Paper 6. Rome: FAO Electronic publishing division.
- FAO. (n.d.). Chapter 3: Land suitability classifications. A Framework for Land Evaluation. Retrieved from http://www.fao.org/docrep/x5310e/x5310e04.htm
- Gindaba, J., Rozanov, A., & Negash, L. (2004). Response of seedlings of two Eucalyptus and three deciduous tree species from Ethiopia to severe water stress. Forest Ecology and Management, 201, 119–129. doi:10.1016/j.foreco.2004.07.009
- Girma, R., Moges, A., & Quraishi, S. (2015). GIS based physical land suitability evaluation for crop production in Eastern Ethiopia : A case study in Jello Watershed. Agrotechnology, 5(1), 1–7. doi:10.4172/2168-9881.1000139
- Hailu, A. H., Kibret, K., & Gebrekidan, H. (2015). Land suitability evaluation for rainfed production of barley and wheat at Kabe Subwatershed, Northeastern Ethiopia. African Journal of Soil Science, ISSN 2375-088X, 3(7), 147–156.
- Hazelton, P., & Murphy, B. (2007). Interpreting soil test results: What to do all the numbers mean? Collingwood Victoria – Australia. CSIRO Publishing. Retrieved from http://www.publish.CSIRO.
- Holden, S., Shiferaw, B., & Pender, J. (2005). Policy analysis for sustainable land management and food security in Ethiopia : A bioeconomic model with market imperfections. International Food Policy Research Institute. Washington, USA.
- Hurni, H. (2000). Area of Andit Tid, Shewa, Ethiopia: Long-term monitoring of the agricultural environment, 1982 – 1994. Soil Conservation Research Programme (SCRP). Bern, Switerzland.
- IIASA/FAO. (2002). Global Agro-ecological Assessment for Agriculture in the 21st Century: Methodology and Results Global Agro-ecological Assessment for Agriculture in the 21st Century: Methodology and Results. Laxenburg, Austria and FAO, Rome, Italy: IIASA.
- IIASA/FAO. (2012). Global Agro-ecological Zones User’s Guide. (GAEZ v3.0). Laxenburg, Austria and FAO, Rome, Italy: IIASA.
- Kang, M. C. B. T., & Tripathi, B. (2014). Technical paper 1 : Soil classification and characterization. Italy: ILRI and FAO.
- Liambila, R. N., & Kibret, K. (2016). Climate change impact on land suitability for rainfed crop production in Lake Haramaya watershed, eastern Ethiopia. Journal of Earth Science & Climatic Change, 7(3), 1–12. doi:10.4172/2157-7617.1000343
- Malczewski, J. (2000). GIS and multicriteria decision analysis. USA: John Wiley & Sons.Canada.
- Malczewski, J. (2004). GIS-based land-use suitability analysis_ a critical overview. Progerss in Planning, 62(1), 3–65. doi:10.1016/j.progress.2003.09.002
- Mekonen, T., & Kebede, F. (2011). Suitability of Koga Watershed for irrigated sugarcane and onion production in the Blue Nile Basin, Ethiopia. Journal of the Dry Lands, 4(2), 325–332.
- Melak, S. (2007). Land capability, Irrigation Potential and crop suitability analysis using GIS and remote sensing in upper Kesem (Awash Basin). Ethiopia: Addis Ababa University.
- Mengesha, A. (2014). GIS-based land suitability analysis; case study of Gefersa Watershed. Ethiopia: NAddis Ababa University.
- Mohana, P., Mariappan, N. V. E., & Manoharan, N. (2009). Land suitability analysis for the part of Parambikulam Aliyar command area, Udumalpet Taluk using remote sensing and GIS Techniques. International Journal on Design and Manufacturing T Echnologies, 3(2), 98–102. doi:10.18000/ijodam.70069
- Motuma, M., Suryabhagavan, K. V., & Balakrishnan, M. (2016). Land suitability analysis for wheat and sorghum crops in Wogdie District, South Wollo, Ethiopia, using geospatial tools. Applied Geomatics, 8(1), 57–66. doi:10.1007/s12518-016-0168-5
- Mu, Y. (2006). Developing a suitability index for residential land use : A case study in Dianchi drainage area. Canda: University of Waterloo.
- Nahusenay, A., & Kibebew, K. (2015). Land suitability evaluation in Wadla Delanta Massif of north central highlands of Ethiopia for rainfed crop production. African Journal of Agricultural Research, 10(13), 1595–1611. doi:10.5897/AJAR2014.9248
- Pender, J., & Gebremedhin, B. (2007). Land management, crop production, and household income in the highlands of Tigray, Northern Ethiopia: An Econometric Analysis. Washington, D.C: International Food Policy Research Institute (IFPRI).
- Rabia, A. H. (2012). A GIS based land suitability assessment for agricultural planning in Kilte Awulaelo district, Ethiopia. In The 4th International Congress of ECSSS, EUROSOIL, Bari, Italy “soil science for the benefit of mankind and environment” (pp. 1257).
- Rabia, A. H, & Terribile, F. (2013). Introducing a new parametric concept for land suitability assessment. International Journal of Environmental Science and Development, 4(1). doi:10.7763/IJESD.2013.V4.295
- Rikalovic, A., Cosic, I., & Lazarevic, D. (2014). GIS based multi-criteria analysis for industrial site selection. Procedia Engineering, 69, 1054–1063. doi:10.1016/j.proeng.2014.03.090
- Rossiter, D. G. (1994). “ Land Evaluation ” Basic concepts & procedures of land evaluation. USA: Cornell University.
- Saaty, R. (2016). Decision making in the Analytic Network Process (ANP) for dependence and feedback. Pennsylvania, US: University of Pittsburg.
- Saaty, T. (1996). Decision making with dependence and feedback: The analytic network process. Pittsburgh: RWS Publications.
- Saaty, T. L. (1980). The analytic hierarchy process. New York, NY: McGraw-Hill International.
- Saaty, T. L. (2004). Decision making — The Analytic Hierarchy and Network Processes (AHP/ANP). Journal of Systems Science and Systems Engineering, 13(1), 1–35. doi:10.1007/s11518-006-0151-5
- Sarkar, A., Ghosh, A., & Banik, P. (2014). Multi-criteria land evaluation for suitability analysis of wheat: A case study of a watershed in eastern plateau region, India. Geo-Spatial Information Science, 17(2), 119–128. doi:10.1080/10095020.2013.774106
- Selassie, Y. G., Ayalew, G., Elias, E., & Getahun, M. (2014). Soil characterization and land suitability evaluation to cereal crops in Yigossa Watershed, Northwestern Ethiopia. Journal of Agricultural Science, 6(5), 0–7. doi:10.5539/jas.v6n5p199
- Sys, C., Van Ranst, E., & Debaveye, I. J. (1991). Land evaluation. Part II: methods in land evaluation. General Administration for Develop ment Cooperation, 247. Brussels: Agricultural publication-No. 7.
- Sys, C., Van Ranst, E.U., Debaveye, J. & Beernaert, F. (1993). Land Evaluation. Part III: crop requirements. Agricultural Publications no 7, General Administration for Development Cooperation. Brussels, Belgium: Ghent University Library.
- Taffesse, A. S., Dorosh, P., & Asrat, S. (2012). Crop production in Ethiopia : Regional patterns and trends (ESSP II Working Paper 16). International Food Policy Research Institute (IFPRI). In Ethiopia Strategy Support Program (ESSP II). Philadelphia, PA: University of Pennsylvania.
- Tan, K. H. (1996). Soil sampling, preparation, and analysis. NewYork: MarcelDekker.
- Teka, K., & Haftu, M. (2012). Land suitability characterization for crop and fruit production in Midlands of. CNCS, Mekelle University, 4(1), 64–76.
- Teshome, M. (2014). Population growth and cultivated land in Rural Ethiopia: Land use dynamics, access, farm size, and fragmentation. Resources and Environment, 4(3), 148–161. doi:10.5923/j.re.20140403.03
- Verheye, W. (2008).LAND EVALUATION. In Land use and Land Cover (II). UNESCO-EOLSS, Belgium: Ghent University Library.
- Voodg, H. (1983). Multicriteria evaluation for urban and regional planning. London: Pion.
- Worqlul, A. W., Jaehak, A., Dile, Y. T., Osorio, J., Schmitter, P., Gerik, T., … Clark, N. (2017). Assessing potential land suitable for surface irrigation using groundwater in Ethiopia. Applied Geography, 85(1), 1–13. doi:10.1016/j.apgeog.2017.05.010
- Yitbarek, T., Kibret, K., Gebrekidan, H., & Beyene, S. (2013). Physical land suitability evaluation for rain-fed production of Cotton, Upland Rice and Sorghum in Abobo area, western Ethiopia. American Journal Researcher Communicable, 1(10), 296–318.
- Yohannes, G. M. (1989). Land- Use, Agricultural Production and Soil Conservation Methods in the Andit Tid Area, Shewa Region. Research Report 17. University of Berne, Switzerland in association with The United Nations University.
- Yohannes, H., Mohammed, A., & Elias, E. (2017, October). Land Use/Land cover dynamics and its impact on biodiversity resources in the Abijata Shalla National Park, Central Rift Valley. An Indian Journal, 13(5), 152: Environmental Science.
Annex 1. Error matrix of accuracy assessment
Annex 2. Environmental requirement of barley and wheat under rainfed agriculture (source: compiled from FAO, Citation1984; Sys et al., Citation1993; IIASA/FAO, Citation2002; IIASA/FAO, Citation2012).
Annex 3. Questionnaire example to show pairwise comparison for the relative importance of the criteria with respect to topography, climate, soil and socio-economic for suitability of a land for major crops (circle the number that mostly represents your viewpoint)