
Abstract
Accurately estimating the leaf nitrogen contents of rice leads to more economical use of fertilizers, and reduces negative impacts of high fertilization rates on the environment. This study was aimed at developing visible-near-infrared absorbance spectroscopy prediction models for leaf nitrogen contents of rice. A field experiment was established comprising of four Philippines lowland rice cultivars receiving four levels of urea nitrogen fertilizer from 0 to 240 kg-N ha−1. Leaf samples were taken over a 5-week period around the panicle initiation stage, immediately dried and pulverized. Some 100 samples were scanned using a Foss NIRSystem 6500 from 400 to 2,498 nm, and analyzed for Kjeldahl-nitrogen in a laboratory. The full wavelength model with no spectral pretreatment gave the best model with a standard error of performance (SEP) and R2 of 0.142% and 0.958, respectively. Re-scanning of the samples suggested a better model from 700 to 2,498 nm with standard normal variate spectral pretreatment with a standard error of cross-validation (SECV) and R2 of 0.117% and 0.973, respectively.
PUBLIC INTEREST STATEMENT
Fertilizers are a major cost component of crop production. Their correct application rates and timing are normally guided by farmers’ experience and recommendations from agronomists. But the potential yields are dictated not only by the variety, but also its response to soil conditions and the prevailing weather patterns during its growth. Thus, different recommendations must be given from one crop season to another. Techniques must be employed for accurate crop nutritional demand determination. Near-infrared (NIR) spectroscopy allows a more rapid analysis of samples compared to the usual laboratory wet-chemistry procedures. To properly use this technology, a calibration step must be done to relate rice leaf nitrogen contents to the absorbance spectra. In this work, prediction models for several Philippine rice varieties were developed as basis for agronomic fertilizer recommendations. Thus, under-fertilization, leading to reduced yields, and overfertilization, leading to increased production costs and dire environmental consequences, can be avoided.
Competing interests
The authors declare no competing interests.
1. Introduction
Rice is the staple cereal food for the 98.39 million Filipinos. In 2010, about 15.77 million metric tons of rice was harvested from 4.35 million hectares of land in the Philippines (PhilRice, Citation2011). To ensure good crop yields, local farmers apply an average of 73 kg ha−1 of nitrogen (N) in each season, mostly in the form of prilled urea and complete fertilizers. Generally, the whole rice crop needs about 166 kg N ha−1; however, about 100 kg N ha−1 accumulate in the grains (Lewin, Ciavarella, Batten, & Blakeney, Citation2006), while the rest are retained in the straw and in the roots. While looking at the whole Asian region, Dobermann (Citation2000) accounted that irrigated rice farmers apply the much higher 100–150 kg N ha−1 to dry season crop than the about 60–90 kg N ha−1 to wet season crop. Fertilizers for N account for 10–20% of the total variable production costs (7% in the Philippines), and more than 20% of N fertilizer of the world is being applied to the rice fields of Asia. Further, they surmised that it is important to correctly manage the application of N fertilizers in terms of application rates, number of times or splits, and timing of application because 60–70% of the fertilizer may be lost through ammonia volatilization and denitrification pathways, which are potent greenhouse gases that can lead to serious environmental pollution (Peng et al., Citation2010).
The optimum range of N in plant tissues is 2.9–4.2% in the leaves from tillering to panicle initiation, with the panicle initiation rice plant growth stage requiring the greatest amount of N nutritional amendment (Dobermann, Citation2000). If this concentration falls below the 2.5% critical level, it would be a concern for nutritional deficiency that may lead to reduction of realizable yield. While color changes that occur in the leaves, such as chlorosis, wherein the leaf lamina turns light green, may be visible signs of deficiency, maximizing the yield potential of the crop relying on leaf discoloration alone would be difficult. Muñoz-Huerta et al. (Citation2013) reviewed different methods of sensing nitrogen status in plants, including primary methods of analysis of plant tissues, chlorophyll meters, and canopy-based meters. While the Kjeldahl digestion is still considered the method of reference for most samples for “organic nitrogen bound in the tri-negative state” determination, the Dumas combustion method overcomes this shortcoming by analyzing the N2 gas instead of ammonia. Chlorophyll meters may accurately guide fertilizer recommendations; however, they are too expensive for the ordinary rice farmers. Leaf color charts are a cheaper option but they require subjective evaluation, and quantitative fertilizer recommendations are difficult to ascertain.
Visible-near-infrared (Vis-NIR) spectroscopy has been shown to be useful for predicting multiple constituents from a single presentation of agricultural samples to an instrument (Tallada, Palacios-Rojas, & Armstrong, Citation2009; Williams, Citation2005; Williams & Norris, Citation2001). It is fast, nondestructive, relatively accurate, and a cost-effective technology to ascertain simultaneously a number of compositional parameters while requiring simple-to-none preparation of the sample. The NIR region of the electromagnetic spectrum spans about 720–2,500 nm. When illuminated, materials absorb optical energies mainly in the mid-infrared region, and concurrently induce overtone and combination absorbances in portions of the NIR region. The absorptions are broad and overlapping for a number of compounds that, for example at 2,180 nm, protein and starches can absorb simultaneously. Different instruments having different electronic sensors detect these absorption spectra, and convert them into digital data while employing unique geometric arrangement of measurement (reflectance, transmittance, and interactance). Chemometric modeling, such as multiple linear and partial least squares (PLS1) regression, find relationship between the absorption spectra and the target constituent. This technology had been used for estimating protein, starch, oil, and moisture contents, and even finer constituents such as the different amino acids, fatty acids, and sugars from grains and crops such as rice, wheat, soybeans, corn; and even constituents in forages and other animal feed ingredients (Baye, Pearson, & Settles, Citation2006; Delwiche, Citation1998; Fontaine, Schirmer, & Hörr, Citation2002; Kovalenko, Rippke, & Hurburgh, Citation2006).
In an earlier study, Batten et al. (Citation1991) reported their work on determining shoot nitrogen contents in rice using a 19-filter (between 1,445 and 2,349 nm) InfrAlyzer 400 instrument (Technicon Industrial Systems, Tarrytown, NY, USA). They used 79 random samples taken from the farmers’ fields, and their model was validated by 67 samples of five rice varieties. They achieved a standard error of performance 0.15% N with an R2 of 0.96. A SunRice Tissue Testing Service at New South Wales, Australia, was established based on this technology that, in 2007, Bowman et al. reported more than 40–50% of the rice growers send in their crop samples for analysis. The service had extensively used a Foss NIRSystem 6500, achieving a standard error of as low as 0.06% N with an R2 of 0.996. Presently, they had migrated to a Fourier transform-NIR (FT-NIR)-based instrument to continue on with their tissue testing service, and they are expanding capabilities to use satellite-acquired hyperspectral imagery to complement their terrestrial-based diagnostics (Bowman, Ciavarella, Blakeney, & Batten, Citation2007).
Zhang, Yao, Tian, Cao, and Zhu (Citation2010) used a Thermo-Nicolet 5700 FT-NIR (800–2,500 nm) instrument to form prediction models for nitrogen contents of fresh rice leaves (n = 278) and dried leaf powder (n = 292) to help them on with their diagnosis of nitrogen status of plants, and guide them for fertilizer topdressing recommendations during production. PLS1 regression produced the most useful models compared to principal component regression and stepwise multiple linear regression. Eight different spectral pretreatments were explored, and multiplicative scatter correction (MSC) with first derivative gave the best performance parameters of R2c and RMSEC of 0.940 and 0.266% N for fresh leaves, and 0.977 and 0.136 for powdered leaves, respectively. Cross-validation modeling resulted in RMSECV values of 0.202 and 0.142% N for fresh and powdered leaves, respectively. They concluded that the nitrogen contents of leaf powder were better predicted than that of the fresh leaves.
The main goal of this study is to develop and evaluate the performance of Vis-NIR absorbance spectroscopy prediction models to estimate the leaf nitrogen contents of some Philippine irrigated lowland rice cultivars. Specifically, we aim to identify the optimum spectral pretreatments for some wavelength ranges based on the model performance statistics.
2. Materials and methods
2.1. Preparation of samples and wet chemistry
Four Philippine irrigated lowland rice cultivars (Inbreds: PSB RC82, NSIC RC216, Hybrids: NSIC RC202H, NSIC RC204H) were field-grown at the Central Experiment Station of the Philippine Rice Research Institute at Muñoz, Nueva Ecija (15°40ʹ23ʺ N, 120°53ʹ43ʺ E, elev. 50 m above sea level, Maligaya soil series, Eutric Vertisol per FAO classification; Miura, Badayos, & Briones, Citation1995) receiving four levels of nitrogen (0, 60, 120, 240 kg-N ha−1) with three replications during the 2014 Dry Season. A split plot randomized complete block experimental design was adopted to account for any preexisting fertility gradient in the field, and the experiment consisted of 48 continuously flooded and bunded 24.5 m2 plots. About 14-day-old seedlings were hand-transplanted at 0.2 × 0.2 m spacing, and had received solophos (30 kg P2O5 ha−1) and muriate of potash (60 kg K2O ha−1) fertilizers at 14 days after transplanting (DAT). Urea nitrogen fertilizer was split applied at 7 DAT, mid-tillering (about 24 DAT), and early panicle initiation (about 45 DAT) growth stages in 1/3–1/3–1/3 proportion, respectively. Leaf samples were gathered from two hills around the periphery outside of the crop cut area at −2, −1, 0, +1, and +2 wk of the estimated panicle initiation stage (about 50–55 DAT). The 240 samples were immediately dried at 70°C in an air oven to constant weight, and were ground into powder form using an electric blender. The nitrogen contents from 100 samples (91 samples from systematically selected blocks at different growth stages, and 9 check samples from bulked leaves of NSIC RC202H planting in another field experiment) were determined by the micro-Kjeldahl analysis in duplicate or triplicate done by the Regional Standards and Testing Laboratory of the Department of Science and Technology Regional Office IV-A (ISO 17025 certified) over a 4-month long period.
2.2. Collection of spectroscopic scans
Spectroscopy scans were collected from all the N-analyzed 100 samples using a Foss NIRSystem 6500 of the Institute of Plant Breeding, University of the Philippines Los Baños from 400 to 2498 nm at 2-nm intervals using rectangular quarter cups after a 30 min of warm-up of the instrument. The ISIScan software was used to collect and display the spectral scans of the samples. All unstandardized spectral data were exported into an external NIR file for model development.
The entire 240 samples were scanned again about 25 days after the initial first scan to predict the leaf nitrogen contents of the samples coming from the field experiment.
2.3. Prediction model development and validation
Using the software WinISI II for Infratec version 1.5 (Foss-Tecator InfraSoft International LLC, Silver Spring MD, USA), the unstandardized spectral data were converted into an ASCII file format. The ParLeS Software for the Chemometrics and Spectroscopy version 3.1 (Rossel, Citation2008) was used for prediction model development. Three spectral pretreatments were examined, namely no pretreatment, standard normal variate (SNV), and SNV with first-derivative. Four different wavelength ranges were explored, namely (1) 400–2,498 nm; (2) 700–2,498 nm; (3) 400–1,200 nm; and (4) 950–1,650 nm, that represent three sensor technologies, correspondingly, (1) silicon-lead sulfide (Si-PbS) of Foss NIRSystem 6500; (2) reduced CCD-PbS range to include the NIR region only; (3) charge coupled device (CCD) for some visible-short NIR instruments; and (4) indium gallium arsenide (InGaAs) of some other instruments. The dataset was sorted in ascending nitrogen values, and systematically divided into 2/3 calibration set and 1/3 validation set samples. Full cross-validation (leave-one-out) PLS1 modeling runs were made to identify the optimum number of factors based on the root mean square of error (RMSE)—number of factors plot. The final PLS1 model was determined for the particular pretreatment and wavelength range combination, and used to estimate the nitrogen contents of the calibration and validation sets.
3. Results and discussion
3.1. Leaf nitrogen contents profile of samples
Table shows the statistical profile for the leaf nitrogen contents of the entire 100 samples scanned and analyzed for Kjeldahl nitrogen. Also shown are the profiles of the calibration and validation set consisting of 67 and 33 samples, respectively. There was a good range of 1.46–4.56% leaf nitrogen contents in the samples. Batten et al. (Citation1991) had reported a range of 0.8–3.5% N for their shoot samples, which naturally contained the stem stalks of the plants. The 230 powdered leaf samples of Zhang et al. (Citation2010) had even similar range of 1.01–4.06% N. Lower nitrogen samples were quite brownish yellow in color consistent of chlorosis or leaf yellowing. Leaf biomass yields were quite low from these samples. The higher nitrogen samples appeared greener and their biomass amount WAS remarkably larger.
Table 1. Statistical profile of the leaf nitrogen contents, % as is, of the samples
Having similar average N concentration and standard deviation, the three sets were expectedly have nearly the same statistical distribution of values, which is quite an important consideration for effective model development. The majority of the samples (n = 40) are well within the optimum 2.9–4.2% range of N in leaf tissues (Dobermann, Citation2000), while there are some samples (n = 5) even exceeding the upper bound of the optimum range, probably those coming from plots that had received the highest urea fertilizer treatment. One sample even had a toxic level of N (more than 4.5%), which was quite temporary because nitrogen can be easily used up for physiological development of the plant. The rest of the samples (n = 28) were deemed deficient in N (<2.5%).
3.2. Absorbance spectra of samples
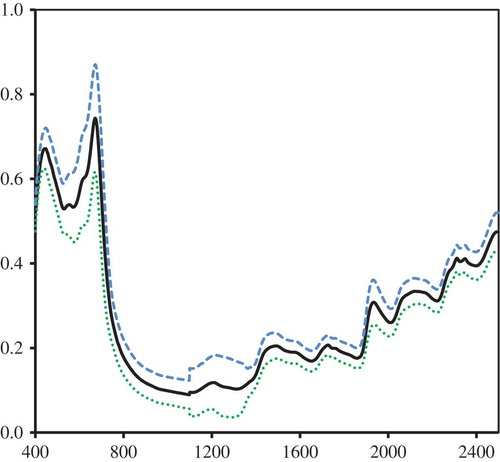
Figure shows the mean absorbance spectrum of the entire sample set including a ± 2•SD envelope (where 95% of expected values of absorbance lie within) for the entire instrument range of 400–2,498 nm. This spread of values in the envelope can be significantly reduced using SNV spectral pretreatment is applied (Barnes, Dhanoa, & Lister, Citation1989) to reduce light scattering in the samples. The Foss NIRSystem 6500 used a silicon sensor for the range 400–1,100 nm, and an InGaAs sensor for 1,100–2,498 nm. A slight shift of absorbance value at 1,100 nm can be quite noticeable in the plot due to sensor change-over of the instrument. The absorbance peaks for the pigment chlorophyll complexes a and b are well defined in the visible range of the spectrum (around 440–448 nm and 668–674 nm, respectively), while water peaks at 1,440 and 1,920 nm were also shown.
Figure 1. Average absorbance spectrum of rice leaf samples, and Mean± 2•SD envelope as measured by Foss NIRSystem 6500 instrument.

3.3. PLS1 modeling
The main goal of PLS1 modeling is to find an array of coefficients that can be used to efficiently predict the leaf nitrogen contents of samples from the absorbance values. It is a mathematical process that overcomes the high multicollinearity of absorbances by recasting them into orthogonal spaces (non-correlated) defined by the factors or latent variables. PLS1 considers also the inherent variability of values in the single dependent variable (in this case the leaf nitrogen contents). Most data variability in the absorbances are contained in the first factor, then the second factor has the most remaining variability and so on.
Spectral pretreatments are done to reduce the confounding effects of external factors such as acquisition geometry and sample particle sizes on the optical measurement of reflectance or absorbance. Mean centering reduces the geometric effects of the relative angular position and distance between the sample and the sensor. Light scatter corrections using SNV (which also has mean-centering pre-built in the formula) and MSC reduce the effects of variable particle sizes. Derivative pretreatments (first or second) may reduce the shifts in the spectra that have been brought by factors such as transient electronic disturbance in the light excitation and sensor conditioning circuits. While these mathematical approaches can work either alone or in combination, an important consequence of applying too complicated spectral pretreatments is the reduction or loss of optical variability, which has significant bearing on efficiently predicting the target constituent.
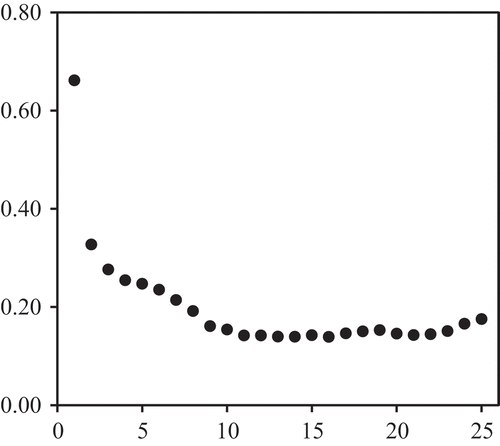
The modeler then has to decide on the spectral pretreatment and the least number of factors for a model that can generalize, that is, maintaining prediction performance at different sample sets and occasions of measurements. Some tools may aid the decision process as provided by the ParLeS software. A sample of the most common approach is to observe the variation of RMSE across different number of factors during cross-validation modeling (an example is shown in Figure for the 400–2,498 nm range without any spectral pretreatment). Reduction of the RMSE proceeded with increasing factor levels until a point (F = 11 in Figure ) when it would either be starting to plateau or later begin increasing again, beyond which (higher F’s) would result to over-fitting of a model.
Figure 2. RMSE by number of factors plot from full cross-validation modeling for 400–2,498 nm range without any spectral pretreatment.
The performance statistics of models for the different spectral pretreatments and wavelength ranges are shown in Table . Standard errors do not consider any prediction biases that may be easily adjusted for by slope–intercept correction. RPD, or ratio of standard error (of performance) to standard deviation, is quite a popular criterion proposed by Williams (Citation2005) to indicate suitability of the model for different applications aside from the coefficient of determination (R2). RPD values of 2.4–3.0 may suggest applications for very rough screening; 3.1–4.9 for fair screening of samples; 5.0–6.4 for quality control; 6.5–8.0 for process control; and above that for any practical application.
Table 2. Prediction model performance statistics for different spectral pretreatments and wavelength ranges for estimating leaf nitrogen contents of selected Philippine rice cultivars (ncalibration = 67, nvalidation = 33)
Generally, using the full wavelength (400–2,498 nm) range of the instrument gave the best model for predicting leaf nitrogen contents because of the full use of the available spectral information. The visible range might have given clues for nitrogen contents since nitrogen is a major component of the chlorophyll pigments. Non-pigment compounds of nitrogen (proteins and free amino acids) may work in the Vis-NIR region to absorb the components of light in this region. Without applying any spectral pretreatment, an 11-factor model can achieve an error of 0.143% with an R2 of 0.959 (cross-validation). The validation of the model yielded similar model performance (SEP of 0.142 and R2 of 0.958). The RPD of 4.93 classifies the model between screening and quality control applications. In an early work, Batten et al. (Citation1991) achieved a similar SEP of 0.15% in a 19-filter instrument, while Zhang et al. (Citation2010) obtained 0.142% at an R2 of 0.944 for rice leaf powder. Batten et al. had suggested in 2005 that there was gradual improvement of model performance statistics over time. In 1987, they could only achieve an R2 and SEP for nitrogen of 0.93 and 0.15%, respectively whence in 2002, they had achieved 0.996 and 0.06%, respectively. But this requires analysis of a lot of samples containing all the expected variations of cultivar, age of plants, location characteristics, cropping seasons, and so on.
Using only the available NIR region (700–2,498 nm), a 10-factor model using SNV pretreated absorbance spectra gave the seemingly best model performance statistics of 0.137% SECV at an RPD of 5.25 with similar model validation results of 0.139% SEP, 5.07 RPD, and an R2 of 0.960. Adding a first derivative spectral pretreatment may suggest a better model based on cross-validation results; however, the validation step had checked the model to be slightly over-fitting the data based on the standard error values (0.145% vs. 0.125%). The narrower span of 400–1,200 nm investigated the combination of the visible and shorter NIR ranges for possible prediction model, that is, within the capabilities of a charge coupled-device or silicon sensor. Poorer model performance statistics can be achieved because plenty of nitrogen compound-related absorbance ranges were not included in the model. In some cases, the SNV spectral pretreatment may be used for nitrogen predictions with an R2 of 0.865 and SEP of 0.251% in validation. This may still be improved if a wider array of samples are considered for model development. The InGaAs sensor range of 950–1,650 nm yielded comparable model performance, especially when the absorbance spectra were not modified (R2 of 0.909 and SEP of 0.205%), which is quite acceptable in some applications such as fertilizer rate recommendation, where there would be greater influences of environment and crop management.
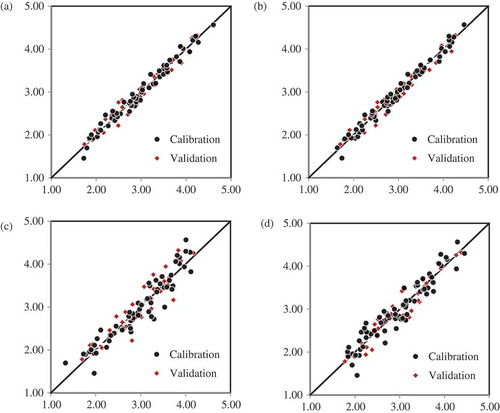
Scatter plots of the chosen models for each of the wavelength ranges are shown in Figure . The wider ranges of Vis-NIR, 400–2,498 nm, and NIR only, 700–2,498 nm, had closer clustering of points along the 45° line, depicting a greater model fit than the narrower 400–1,200 nm and 950–1,650 nm models. The widest available wavelength range of the instrument practically gave the maximum model performance, that is, it had the least standard prediction errors and highest coefficient of determination. Although cross-validation statistics showed that the SNV spectral pretreatment had little effects on the errors RMSE and SECV, validation test best suggested no spectral pretreatment.
Figure 3. Scatter plots for the best prediction models for the four wavelength ranges: (a) 400–2,498 nm; (b) 700–2,498 nm; (c) 400–1,200 nm; and (d) 950–1,650 nm.
3.4. Re-scan of samples
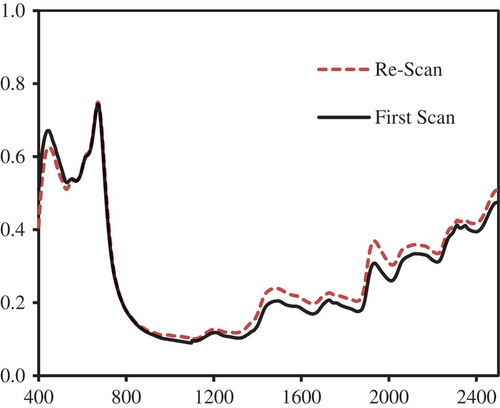
As usually practiced in spectroscopy modeling, the entire 100 samples (calibration and validation sets) are combined together to form the final prediction model. Cross-validation modeling should be sufficient enough to depict the expected model performance. The results are shown in Table . Not modifying the absorbance data from 400 to 2,498 nm apparently gave the best model with an SECV of 0.135%, although this was not too far from the SECV of the model that used SNV spectral pretreatment of 0.139%. The model performance calibration statistics (first scan) gave very good results for both the no-pretreatment and SNV spectral pretreatment. The entire set of 100 samples was scanned again after about 25 days to check for any changes in the absorbance spectra and the predicted values. Figure showed that there was a little shift in the average absorbance spectra in the second scan campaign mostly in the NIR region above 900 nm. Some changes also had occurred around the chlorophyll-b absorbance region (about 450 nm). These changes likely could have been caused by the reabsorption of moisture by the samples, repacking of samples in the rectangular cup, leading to rearrangement of leaf particles, slight aging of chemical compounds in the samples, or could be caused by any slight changes in the instrument electronics. While it is quite difficult to pinpoint the exact cause, it would be quite daunting to learn that prediction errors would have remarkably increased after a seemingly best-fitted model was obtained from an earlier set of sample scans.
Table 3. Prediction model performance statistics for first scan and re-scan of samples at different spectral pretreatments and two wavelength ranges for estimating leaf nitrogen contents of 100 samples
Figure 4. Re-scanning the samples on another date led to a slight shift in the measured absorbance spectra.
Using the best model obtained (no spectral pretreatment) for the range of 400–2,498 nm in the first scan, the validation statistics using the absorbance data of the re-scan surprisingly gave poorer model performance (SEP of 0.214%). On the other hand, the SNV spectral pretreatment of the first-scan absorbance data for the entire 100-sample set gave better model performance results although the SEP value of 0.167% was larger than the earlier 0.107% (of first scan). The visible range in the wavelength was removed, giving an effective range of 700–2,498 nm for the first scan data. The model validation statistics for the re-scan data had remarkably improved, and suggested that using the SNV pretreatment would be of great advantage to remove any effects that could had been caused by any shifts in the absorbance spectra in the NIR region. Scatter plot of the predictions using the original first scan data gave a very good model fit with an R2 of 0.975 with slope and offset of almost unity and zero, respectively. Using the model to predict the re-scan absorbance data, the R2 had reduced down to 0.964 and there was significant shift in the slope and offset values, as shown in Figure . This is quite unacceptable if the bias offset translates to a marked degree of errors in the prediction whenever “new” scan data are presented to the model. Another modeling approach had been explored that would account for variations in the absorbance data of future samples. This time, the mean absorbance data was computed by averaging the values for each sample from 700 to 2,498 nm, and models were developed. Model performance results are shown in Table . Cross-validation modeling yielded nearly similar results for the three spectral pretreatments. However, prediction model results for the SNV pretreated absorbance data for the first scan and re-scan absorbance data were found to be quite superior and stable (SEP of 0.115% and 0.117% for first scan and re-scan data sets, respectively, and highest R2 of 0.973). Although Batten et al. (Citation1991) suggested to use first- or second-derivative pretreated absorbance data on models, SNV was found to be quite useful enough in reducing any shifts in the spectra brought by changes in the sample conditions, such as those due to moisture reabsorption and repacking of samples into the cups. The predictions for the 100 samples using both the first spectra and re-scan absorbance data are shown in Figure .
Figure 5. Scatter plot of the prediction of leaf N contents of the 100 samples using the first scan and re-scan absorbance data with the model that used standard normal variate spectral pretreatment and 700–2,498 nm wavelength range.
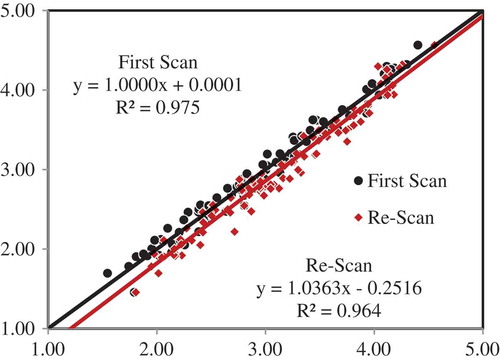
Figure 6. Prediction scatter plot of leaf nitrogen contents of 100 samples based on the first and re-scan absorbance spectral data using the model from averaged absorbance spectra in the 700–2,498 nm wavelength range with SNV spectral pretreatment.
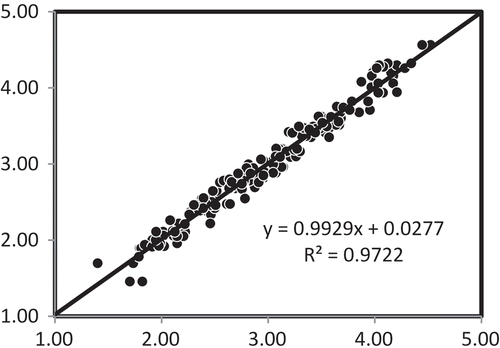
Table 4. Prediction model performance statistics for average of first scan and re-scan absorbance data at different spectral pretreatments and 700–2,498 nm wavelength range for estimating leaf nitrogen contents of 100 samples
3.5. Prediction of leaf nitrogen contents
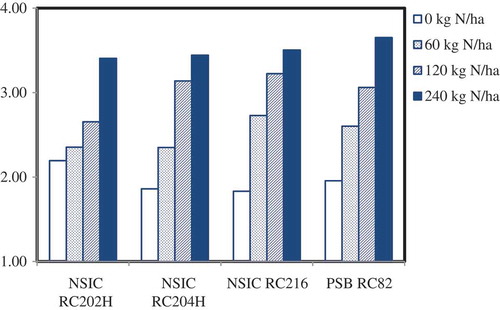
The leaf nitrogen contents of the entire 240 samples of the field experiment were predicted using the final model in the 700–2,498 nm wavelength range with SNV pretreatment. The mean contents of leaf nitrogen for the four cultivars receiving four levels of nitrogen are graphically shown in Figure . These are leaf samples from the final fifth leaf sampling campaign at around flowering when all the nitrogen fertilizers had been already applied (by panicle initiation). As expected, increasing levels of fertilization of urea nitrogen led to increasing levels of nitrogen in the leaves. Analysis of variance had shown significant interaction effects between cultivar and nitrogen levels Pr(>F) = 0.006. The next step would be to relate this N-uptake in terms of use efficiency and translation into agronomic yields.
Figure 7. Variation of leaf N concentration 2 weeks after panicle initiation for different irrigated lowland rice cultivars receiving four levels of fertilizer N rates. In a variety, leaf nitrogen concentrations having the same letter are not significantly different by least significant different test (LSD 5% = 0.284).
4. Conclusion
The study was aimed at developing prediction models for leaf nitrogen contents of rice to guide mid-season fertilizer recommendations in the Philippines. Using the full wavelength range of the instrument Foss NIRSystem 6500 apparently gave the best model when no pretreatment has been applied to the absorbance spectral data. However, a re-scan showed a decline in the performance that it was necessary to get the average of spectra of the two scan campaigns. A better prediction model was achieved with an SEP and R2 of 0.117 and 0.973, respectively.
Competing interests
The authors declare no competing interests.
Cover Image
Source: Author.
Additional information
Funding
Notes on contributors
Jasper G. Tallada
Jasper G. Tallada finished his Bachelor’s degree in Agricultural Engineering from the University of the Philippines Los Baños in 1988 and his Master of Engineering Science—Development Technology, Agricultural Engineering, from the University of Melbourne, Australia, in 1996 and PhD in Agricultural Science—Agricultural Engineering from Kagoshima University—University of Miyazaki (United Graduate School) in 2006. His current research interests are on near-infrared spectroscopy, machine vision, smart farming, sensor electronics, and instrumentation.
References
- Barnes, R. J., Dhanoa, M. S., & Lister, S. J. (1989). Standard normal variate transformation and de-trending of near-infrared diffuse reflectance spectra. Applied Spectroscopy, 43(5), 772–777. doi:10.1366/0003702894202201
- Batten, G. D., Blakeney, A. B., Glennie‐Holmes, M., Henry, R. J., McCaffery, A. C., Bacon, P. E., & Heenan, D. P. (1991). Rapid determination of shoot nitrogen status in rice using near infrared reflectance spectroscopy. Journal of the Science of Food and Agriculture, 54(2), 191–197. doi:10.1002/(ISSN)1097-0010
- Baye, T. M., Pearson, T. C., & Settles, A. M. (2006). Development of a calibration to predict maize seed composition using single kernel near infrared spectroscopy. Journal of Cereal Science, 43(2), 236–243. doi:10.1016/j.jcs.2005.11.003
- Bowman, A., Ciavarella, S., Blakeney, A., & Batten, G. D. (2007). Using near-infrared technologies to enhance precision management of rice crops. A report for the Rural Industries Research and Development Corporation (RIRDC Publication No 06/124). Australia.
- Delwiche, S. R. (1998). Protein content of single kernels of wheat by near-infrared reflectance spectroscopy. Journal of Cereal Science, 27(3), 241–254. doi:10.1006/jcrs.1997.0165
- Dobermann, A. (2000). Rice: Nutrient disorders & nutrient management (Vol. 1). International Rice Research Institute.
- Fontaine, J., Schirmer, B., & Hörr, J. (2002). Near-infrared reflectance spectroscopy (NIRS) enables the fast and accurate prediction of essential amino acid contents. 2. Results for wheat, barley, corn, triticale, wheat bran/middlings, rice bran, and sorghum. Journal of Agricultural and Food Chemistry, 50(14), 3902–3911.
- Kovalenko, I. V., Rippke, G. R., & Hurburgh, C. R. (2006). Determination of amino acid composition of soybeans (Glycine max) by near-infrared spectroscopy. Journal of Agricultural and Food Chemistry, 54(10), 3485–3491.
- Lewin, L., Ciavarella, S., Batten, G., & Blakeney, A. (2006). NIR for improved fertilizer predictions II for rice (RIRDC Publication No W05/192). Rural Industries Research and Development Corporation (39 p).
- Miura, K., Badayos, R. B., & Briones, A. M. (1995). Pedological characterization of lowland areas in the Philippines (pp. 106–109). Japan: College of Agriculture, UP Los Baños (UPLB) and Japan International Research Center for Agricultural Sciences (JIRCAS), Ministry of Agriculture, Forestry and Fisheries.
- Muñoz-Huerta, R. F., Guevara-Gonzalez, R. G., Contreras-Medina, L. M., Torres-Pacheco, I., Prado-Olivarez, J., & Ocampo-Velazquez, R. V. (2013). A review of methods for sensing the nitrogen status in plants: Advantages, disadvantages and recent advances. Sensors, 13(8), 10823–10843. doi:10.3390/s130810823
- Peng, S., Buresh, R., Huang, J., Zhong, X., Zou, Y., Yang, J., … Dobermann, A. (2010). Improving nitrogen fertilization in rice by sitespecific N management. A review. Agronomic Sustain Developments, 30, 649–656. doi:10.1051/agro/2010002
- PhilRice. (2011). Philippine rice industry primer series. Munoz: Philippine Rice Research Institute.
- Rossel, R. A. V. (2008). ParLeS: Software for chemometric analysis of spectroscopic data. Chemometrics and Intelligent Laboratory Systems, 90(1), 72–83. doi:10.1016/j.chemolab.2007.06.006
- Tallada, J. G., Palacios-Rojas, N., & Armstrong, P. R. (2009). Prediction of maize seed attributes using a rapid single kernel near infrared instrument. Journal of Cereal Science, 50, 381–387. doi:10.1016/j.jcs.2009.08.003
- Williams, P. C. (2005). Near-infrared technology – Getting the best out of light. Nanaimo, BC: PDK Projects, Inc.
- Williams, P. C., & Norris, K. (2001). Implementation of near‐infrared technology. In P. Williams & K. Norris (Eds.), Near‐infrared technology in the agricultural and food industries (2nd ed., pp. 150–153). St. Paul, MN: American Association of Cereal Chemists.
- Zhang, Y.-S., Yao, X., Tian, Y.-C., Cao, W.-X., & Zhu, Y. (2010). Estimating leaf nitrogen content with near infrared reflectance spectroscopy in rice. Chinese Journal of Plant Ecology, 34(6), 704–712.