
 ?Mathematical formulae have been encoded as MathML and are displayed in this HTML version using MathJax in order to improve their display. Uncheck the box to turn MathJax off. This feature requires Javascript. Click on a formula to zoom.
Abstract
Combining conservation tillage with legumes grown as a green manure is an increasingly popular practice for crop production in the U.S. Southern Great Plains. This study investigated interactions between system of tillage (no-till vs. conventional tillage) and source and amounts of nitrogen (N) fertilization (0, 45 and 90 kg N ha–1 yr–1 in inorganic N fertilizer, and cowpea as a green manure) on radiation use efficiency, and dry matter (DM) yield of winter wheat. The study was conducted at two sites during the 2016–2017 growing season of winter wheat. Fraction of intercepted photosynthetically active radiation (fPAR) was derived by measurements of canopy spectral reflectance taken at 1–2 weeks intervals as ratio vegetation index (RVI). Total cumulative intercepted fPAR (IPAR) during the cropping period was calculated as a product of half global radiation and fPAR. Radiation use efficiency (RUE) was calculated as the ratio of biomass yield and IPAR. At both sites, N treatments had stronger influences on crop growth than tillage systems. The RVI, IPAR and DM yield were generally higher under 90-N treatments followed by 45-N treatment. Responses of cowpea and control treatments were similar and the lowest. Radiation use efficiency was not influenced by tillage systems or N treatments.
PUBLIC INTEREST STATEMENT
Winter wheat is the major crop in the US Southern Great Plain (SGP). Use of inorganic nitrogen (N) fertilizers is common for production of winter wheat in the region. However, increasing fertilizer costs and environmental awareness has generated interest in legumes as green manures to supply N for winter wheat. Here, we compared response of winter wheat to cowpea as green manure and three rates of inorganic fertilizers under both no-till and conventional tillage managements. Crop growth of winter wheat was monitored non-destructively by canopy reflectance at 1–2 weeks intervals throughout the growing season. Effect of tillage management on winter wheat growth was not strong and inconsistent at two study sites. However, growth and yield were strongly influenced by N-treatments. Crop growth and biomass yield of winter wheat increased with increasing amounts of applied inorganic N but cowpea did not support winter wheat growth effectively.
Competing Interests
The authors declare no competing interests.
1. Introduction
Winter wheat (Triticum aestivum L.) is the major crop in the U.S. Southern Great Plains (SGP) which includes sections of Kansas, Oklahoma and Texas. For example, winter wheat was cultivated on 2.14 million hectares in Oklahoma during 2015, producing 2.7 million tons of grain (Oklahoma Agricultural Statistics, Citation2016). Use of inorganic nitrogen (N) fertilizers is common for production of winter wheat in the region. However, increasing fertilizer costs and environmental awareness has generated interest in legumes as green sources of N for winter wheat (Northup & Rao, Citation2016; Rao & Northup, Citation2011). Winter wheat in the SGP is generally planted during September–October, depending on intended use of wheat (grain, forage or grazing), and grown through May–June (Decker, Epplin, Morley, & Peeper, Citation2009; Redmon, Horn, Krenzer, & Bernardo, Citation1995). Lands planted to wheat are generally left fallow during the summer to conserve moisture as parts of continuous rotations of production applied to winter wheat (Hossain, Eplin, Horn, & Krenzer, Citation2004). Thus, summer legumes could be cultivated as N sources during the period between grain harvest of winter wheat and planting of the following wheat crop in the autumn (Northup & Rao, Citation2016).
Effects of the amount of N applied on grain and forage yields of winter wheat is widely studied in many locations of Oklahoma. Thomason, Raun, and Johnson (Citation2000) observed strong linear effects of N rates between 0 and 90 kg N ha−1 on winter wheat yield, with 32 kg ha–1 (range, 9–77 kg ha–1) increase in forage with each additional 1 kg N ha−1. Similarly, another study conducted at three locations in central and western Oklahoma (Thomason et al., Citation2002) found strong positive responses of grain and total dry matter (DM) yield to N rates. Likewise, MacKown, Heitholt, and Rao (Citation2007) found 30% higher DM yield by winter wheat that was fertilized with 112 kg N ha−1 compared to an unfertilized crop. Bidlack et al. (Citation2007) found an increase of 34 kg DM with each additional 1 kg N ha−1 in a pot experiment that included three rates of N fertilizers as 0, 45 and 90 kg N ha−1. Thus, results from these experiments indicate N fertilization is vital for successful cultivation of winter wheat in the region.
Cover crops may provide other agronomic benefits than N, such as nutrient retention, and erosion and weed control (Bergtold, Ramsey, Maddy, & Williams, Citation2017). However, green manures have not been effective in the SGP due to decreased moisture availability for the following winter wheat crop (Nielsen, Lyon, Hergert, Higgins, & Holman, Citation2015). Various legumes used as green manures have been tested in the SGP for their capacity for N fixation and yield response of the following wheat crops. Northup and Rao (Citation2016) tested lablab (Lablab purpureus L.) and soybean (Glycine max L.) as N sources for winter wheat in Oklahoma during a four-year study but neither species were effective N sources. Similarly, Rao and Northup (Citation2011) tested grass pea (Lathyrus sativus L.) as a pre-plant (grown September through mid-October) source of N for winter wheat in the same location. However, no improvements were noted for production by winter wheat, though legume biomass at termination regularly contained enough N to meet the needs of winter wheat. In general, previous studies have documented the poor performance of legume-based green manures on the yield of winter wheat in the SGP.
While currently only a minor approach to managing winter wheat (Hossain et al., Citation2004), no-till (NT) is becoming an increasingly popular tillage system in the SGP. It can help conserve soil moisture in the root zone, the most important limiting factor for winter wheat production in the region (Nielsen et al., Citation2015). In general, crop productivity under NT system may be reduced due to reduced weed control, and nutrient and residue management (Decker et al., Citation2009). However, NT may be an effective tool to save soil moisture and a part of yield reduction may be offset by availability of increased soil moisture. Also, NT may provide many environmental services such as reduced soil erosion and runoff as compared to the conventional tillage (CT) system (DeLaune & Sij, Citation2012; Sharpley & Smith, Citation1994).
Although effects of inorganic N fertilizers and legume-based green manures as N sources for winter wheat was previously studied in the SGP region (Northup & Rao, Citation2016; Rao & Northup, Citation2011), their effects on radiation interception and radiation use efficiency of winter wheat is not reported. Thus, this study was designed to investigate the effects of two contrasting tillage systems, and amount and form of applied N treatments, on amounts and efficiencies of radiation used during the growing period of winter wheat. Crop growth was monitored as canopy reflectance throughout the growing season, and radiation interception and use efficiencies were derived from the reflectance measurements. The hypotheses tested are that: (i) growth and yield of winter wheat would be higher under NT system than CT system; (ii) growth and yield of winter wheat would increase with increasing rates of inorganic N fertilization; and (iii) growth and yield of winter wheat would be higher in cowpea treatment than unfertilized control treatment.
2. Materials and methods
2.1. Study site and soil properties
This field study was conducted on two sites at the USDA-ARS Grazinglands Research Laboratory near El Reno, Oklahoma that were part of a long-term (multi-decade) experiment (initiated in 2011) to examine responses at the soil–plant interface to forms and amounts of applied N and tillage systems in continuous systems of wheat production. The sites were defined as components of upland and bottomland areas of the North Canadian River drainage basin. The predominant soil series of the upland site (35°32′45′′ N, 98°00′44′′ W; 421 m elevation) is a Norge silt loam (fine-silty, mixed, thermic, Udic Paleustolls) moderately drained with 1−3% slope. Soils (0−15 cm) of the upland site had average total organic carbon of 1.39%, and total N content of 0.11% (unpublished results, B.K. Northup). The predominant soil series of the bottomland site (35°34′21′′ N, 98°02′ 12′′ W; 411 m elevation) was a Dale silt loam (fine-silty, mixed, thermic, Pachic Haplusttols) with 0−1% slope. Soils of the bottomland site had average total organic carbon of 1.31% and total N content of 0.10%.
2.2. Experimental design
The current study on radiation interception was conducted during the 2016−2017 growing season (October–May) of winter wheat. At each site, four N treatments were identified for the study. Included were two levels of inorganic N fertilizer (45 and 90 kg N ha−1), an annual legume (cowpea; Vigna unguiculata L.) as a source of green N, and an unfertilized control. These treatments were randomly assigned to three replicated plots (8 × 10 m) within each site. Each of these whole-plots was subdivided into two subplots (4 × 10 m) that were randomly assigned one of two tillage systems; NT and CT. Thus, the experimental design was a split-plot in a completely randomized design with four N treatments, two tillage systems and three replications in each N-treatment/tillage-system combination.
2.3. Crop management
For the current study during 2016–2017, winter wheat was harvested on 10 June 2016. The CT plots were tilled (disked once, rototilled once) on 13 June. The plots assigned to cowpea were sown on 15 June. Cowpea seeds were inoculated with a Bradyrhizobium spp. strain, planted (2.5 cm depth; 40 kg ha−1 seed rate), and received 45 kg P ha−1 as 18–46-0 (N-P-K) dry fertilizer on 17 June. The 18–46-0 fertilizer was used to supply P, since P fertilizer without N was unavailable to producers in the region. This application resulted in 18 kg N ha–1 being applied to cowpea plots.
All NT plots were sprayed with Roundup® herbicide as a 1% glyphosate [N-(phosphonomethyl) glycine] solution to control weeds on 16 June. Additional applications were undertaken as required to control weeds on plots that were summer fallowed (post-grain harvest through September). The cowpea plots were terminated on 17 August by shredding all plots, spraying the stubble in NT plots, and tilling CT plots (disked once, roto-tilled once) on 19 August. At termination, cowpea produced 1.9 Mg ha−1 aboveground DM and containing 62 kg N ha−1. The 45-N and 90-N plots were fertilized on 21 September and winter wheat was sown in all plots on the next day. Winter wheat was harvested on 31 May 2017. Crop management applied during the period of this study was similar to the timing and application rates as was used during all other years of the study (2011 to present).
The two applied tillage systems represented points along a continuum from tillage only for planting and weed control with no applied herbicides, to NT combined with use of only chemicals to control weeds. Within the overall study, the effects of NT (chemical control only of weeds and no mechanical disturbance of soil) were compared to effects of CT that was undertaken with use of two best management practices: 1) fewest operations possible to incorporate winter wheat residues and cowpea biomass and prepare seedbeds; 2) leave roughness and residues at the soil surfaces after tillage to reduce erosion during fallow periods and times prior to adequate growth by wheat and legumes. Weed control on CT plots during the summer was largely conducted with herbicide; tillage was used for weed control in cases where weed populations were large
2.4. Ratio vegetation index (RVI)
Crop growth of winter wheat was monitored non-destructively by canopy reflectance at 1–2 week intervals using a full range portable spectroradiometer (model PSR-3500; Spectral Evolution, Lawrence, USA) with a spectral range of 350–2500 nm. In total, measurements were taken on 21 dates during the growing season of winter wheat. The measurements were taken from a fixed spot at each plot with a sensor held at a height of 1.2 m from the soil surface. Canopy reflectance at red (ρr, 656 nm) and near infrared (NIR) (ρi, 778 nm) wavelengths was used to calculate ratio vegetation index (RVI) as:
2.5. Measurements of biomass yield
Total aboveground DM of winter wheat was determined at the end of the growing season by sampling 0.4-m2 quadrats in each subplot to a stubble height of 5 cm. The harvested biomass was dried to a constant weight in a forced-draft oven (60°C). Sample weights together with the sampled area were used to calculate yields of aboveground biomass. Biomass samples were collected from the same spots where RVI measurements were taken during the growing season.
Soil containing individual plants were excavated (0–20 cm) from each plot with a shovel to determine root/shoot ratio. The plants were divided into aboveground and belowground parts. The aboveground biomass was further divided into unharvested stubble (5 cm height above soil surface) as biomass harvested from quadrats were collected to a stubble height of 5 cm. Root biomass was cleaned manually from soil with a root washer. Root, stubble and shoot dry weight were recorded separately. Total biomass of the harvested 0.4-m2 areas was determined using the ratio of harvested and unharvested biomass.
2.6. Calculations of light interception
The function given by Christensen and Goudriaan (Citation1993) was used to transform RVI measurements into the fraction of photosynthetically active radiation intercepted (fPAR; range 0–1) by crop canopy according to Equations 2–4:
where ρi,∞ and ρr,∞ represent the reflectance at maximum RVI and ρi,s and ρr,s represent the reflectance from bare soil.
Hourly values of fPAR for each plot were derived by linear interpolation between measurement dates. Total cumulative intercepted fPAR (IPAR) was then calculated for the whole growing period (October 2016—May 2017) assuming 48% of the global radiation was in the photosynthetic active band (Monteith & Unsworth, Citation1990) using the following relation (Andersen, Munkholm, & Nielsen, Citation2013):
where Q is hourly incoming global radiation (MJ m–2) and Ft is a temperature dependence function to adjust to constraints in light interception imposed by low temperature. Ft was set to 0 at or below −2°C and then assumed to increase linearly with hourly mean air temperature to a value of 1 at or above 10°C (Kandel, Elsgaard, Andersen, & Lærke, Citation2016).
Hourly averages of air temperature, precipitation and global radiation during the study period were obtained from El Reno weather station (Oklahoma Mesonet, Oklahoma Climatological Survey) which is about 2 km from both study sites.
Finally, radiation use efficiency (RUE; g DM MJ–1) was calculated as the ratio of total annual yield measured at the end of May to IPAR in the growing period (October 2016–May 2017). Estimates of RUE were calculated for aboveground DM and total DM including root and shoot biomass. Total DM and biomass partitioning were measured only at the bottomland site. The grain produced by winter wheat on the upland site was shattered by a hailstorm prior to crop harvest, resulting in no harvestable grain. Therefore, only RVI and IPAR measurements are presented for the upland site.
2.7. Statistical analysis
The effects of tillage system and N treatments were determined as a two-factorial split-plot in a completely randomized design with N-treatments as whole-plots and tillage systems as subplots. For pairwise comparisons, Fisher’s LSD method was used at 5% level. The statistical analysis was done individually for each site. The statistical analysis was done in SAS (SAS Inc., Cary, NC). Measurements from the subplots receiving tillage system and N treatment combinations are presented as average and standard errors of means (n = 3) unless otherwise stated.
3. Results
3.1. Climate and soil conditions
Air temperature during early growth of winter wheat (October–November 2016) was 2.6°C higher than the long-term (2002–2016) average air temperature in those months (Figure ). Similarly, air temperature during February–March 2017 was 3.4°C higher than the long-term air temperatures in those months. On average, air temperature during the growing season of winter wheat during the study year was 1.3°C higher than the long-term average (11.5°C).
Figure 1. Mean monthly temperature (a) and total precipitation (b) for the study area during the study period (October 2016–May 2017) and the long-term period from 2002 to 2016.
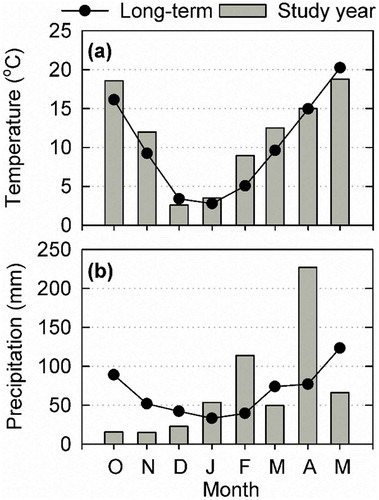
Total precipitation received during the 2016–17 growing season of winter wheat (563 mm) was slightly higher (34 mm) than the long-term average (529 mm). However, the precipitation was not well distributed through the growing season. Total precipitation during October–December 2016 was only 53 mm, which was 130 mm lower than the long-term average (183 mm). In contrast, precipitation received during February–April 2017 was 200 mm higher than the long-term averages for those months.
3.2. Biomass growth measured as RVI
Biomass growth measured as RVI on the upland site was similar for all N treatments under NT system before winter (Figure )). However, RVI was slightly higher for the 90-N treatment during the spring. Inorganic N treatments (45-N and 90-N) had stronger effects on plant growth under CT for the upland site before and after the winter period (Figure )). The 90-N treatment generally resulted in higher RVI, while lower RVI were recorded for plots receiving the cowpea and control treatments.
Figure 2. Dynamics of ratio vegetation index (RVI) as a proxy for green biomass. Error bars represent the spatial variations at plots (standard error, n = 3). Unidirectional error bars are shown for clarity.
On the bottomland site, both inorganic N treatments (45-N and 90-N) had higher RVI during both periods before and after winter, while the cowpea and control plots had lower RVI (Figure )). The difference between 45-N and 90-N treatments during the spring was more pronounced under NT than CT system (Figure ).
Seasonal average RVI across all applied N treatments under CT was 14% higher than under NT at the upland site (Figure )). Alternatively, the seasonal average for RVI at the bottomland site was 14% higher under NT than CT (Figure )). The differences in RVI was mostly seen during early spring (March–April 2017) (Figure ). The RVI at the upland site was higher than at the bottomland site under CT tillage system after winter. The RVI from all treatments dropped sharply in April and approximated zero in mid-May following crop senescence.
Figure 3. Dynamics of ratio vegetation index (RVI) as a proxy of green biomass at no-till and conventional-till systems. Each point represents average RVI across all forms of applied N treatments under a tillage system. Error bars represent the spatial variations at plots (standard error, n = 12). Unidirectional error bars are shown for clarity.
3.3. Cumulative interception of PAR (IPAR)
The effect of tillage systems on total cumulative IPAR on the upland site, was significant (P< 0.05) since total IPAR under CT across all forms of applied N treatments was 14% greater than IPAR under NT (583 and 512 MJ m−2 under CT and NT systems, respectively). Similarly, the effect of N treatments was significant as cumulative IPAR increased with increasing rate of inorganic N fertilizer. The IPAR response to the cowpea treatment was not different from the unfertilized control (i.e., 90-N > 45-N > cowpea = control). Interaction effects between tillage systems and N-treatments were also significant since the difference among N treatments was small under NT system and large under CT (Figure ).
Figure 4. Cumulated intercepted fPAR (IPAR) of winter wheat during the study period (October 2016–May 2017). The data represent averages of three plots under each N treatment. Spatial varations at plot scale are presented as standard error (n = 3) for the final measurement. Unidirectional error bars are shown for clarity.
On the bottomland site, the effect of tillage systems on total cumulative IPAR was significant as total IPAR under NT system across all forms of applied N treatments was 11% greater than IPAR under CT system (445 and 494 MJ m−2 under CT and NT systems, respectively). Similarly, the effect of N treatment was significant with higher IPAR under 90-N and 45-N than under control and cowpea treatments (i.e., 90-N = 45-N > cowpea = control). There were no interactions among tillage systems and N treatments (Figure ).
3.4. Dry matter yield and partitioning
On the bottomland site, total DM produced by winter wheat was significantly affected by tillage systems (P = 0.01) and N treatments (P < 0.001). However, there were no interactions among tillage systems and N treatments (P = 0.17). The amount of DM produced under NT system across all forms of applied N treatments (5.3 Mg ha−1) was 14% greater than generated under CT (4.6 Mg ha−1) (Figure ), which coincided with the higher average RVI (Figure )).
Figure 5. Mean aboveground dry matter (DM) yield of winter wheat. Error bars represent the spatial variations at plots (standard error, n = 3). Significance level for tillage (T) system, nitrogen (N) treatments and their interaction are shown.
Amount of DM increased with increasing rate of inorganic fertilizer (Figure ) while DM produced in response to cowpea treatment was not different from the unfertilized control (i.e., 90-N > 45-N > cowpea = control). The average DM produced in response to the 90-N treatments was ~2 times higher than the yield produced by the unfertilized control and cowpea treatments. On average, total DM yield increased by 36 kg ha–1 with addition of 1 kg N ha−1 in response to applied inorganic N.
Root/shoot ratios of winter wheat were not affected by tillage systems or N treatments (Figure ). The average root/shoot ratio of winter wheat across the treatments was 0.11, with a narrow range of 0.09−0.13.
Figure 6. Mean root/shoot ratio of winter wheat harvested in the end of the growing season. Error bars represent the spatial variations at plots (standard error, n = 3). The ratio was not statistically different (P > 0.05) in all tillage system and N treatment combinations.
3.5. Radiation use efficiencies (RUE)
The effects of interactions between tillage systems and applied N treatments on RUE was not significant (Figure )). The average RUE based on harvested aboveground biomass of winter wheat in response to tillage systems and N treatments was 1.05 g MJ−1 (range, 0.91–1.20). Similarly, the RUE calculated for total biomass (root + shoots) produced by winter wheat was not affected by tillage systems or N treatments (Figure )). The average RUE based on total biomass of winter wheat was 1.44 g MJ−1 (range, 1.18–1.58).
Figure 7. Mean radiation use efficiency (RUE) of winter wheat. (a) RUE calculated based on aboveground dry matter yield (b) RUE calculated based on total (root and shoot) dry matter yield. The RUEs were not statistically different (P > 0.05) in all tillage system and N treatment combinations.
4. Discussion
The similarity in growth and DM yield of winter wheat in response to the two tillage systems was in accordance with results from previous studies in the SGP (Jacobsen & Westermann, Citation1988; Northup and Rao Citation2016; Sij, Belew, & Pinchak, Citation2016; Baumhardt et al. Citation2017). Although lower yields have been generally noted for winter wheat managed under NT system compared to CT, saving soil water by NT system which is the critical factor for winter wheat production in the SGP may have offset yield reductions caused by other factors (Nielsen et al. Citation2015). The results of strong positive effects of inorganic N fertilizer on growth and amounts of DM produced by winter wheat were also similar to those from previous studies in the region (Thomason et al., Citation2000, Citation2002; Bidlack et al. 2007; MacKown et al., Citation2007).
The lack of effect of cowpea as green N on subsequent wheat crops noted in the current study align with the results of previous studies in the region which also noted limited effectiveness of legumes grown as N source (Bidlack et al. 2007; MacKown et al., Citation2007; Rao & Northup, Citation2011). These results collectively indicate that summer legumes may accumulate enough N to meet the requirements for following crops of winter wheat, but may not be able to transfer the N effectively. To be an effective N source for the following cash crop, summer legumes grown as green N manure should fix enough N to meet the requirements for the recipient cash crop and transfer the biomass N to the following crop when it is needed. The aboveground biomass of cowpea at termination contained 62 kg N ha−1 and belowground parts contained some additional N which was not determined here. Thus, although cowpea might have added some N into the ecosystem through biological nitrogen fixation, crop growth and yield of winter wheat under cowpea treatment was poor, possibly due to a lack of synergy between mineralization of N in cowpea biomass and demand of the following winter wheat.
The lack of synergy between N mineralization of cowpea residues and demand of N for winter wheat could be related to management of cowpea at termination. There was an extended fallow period between termination of cowpea and planting of winter wheat when gaseous losses of N in volatilization and denitrification might have occurred (Pimentel, Weiler, Pedroso, & Bayer, Citation2015). Another likely reason for poor growth and DM yield of winter wheat following cowpea might be due to reduced availability of soil moisture. This is a common occurrence in many double-cropping scenarios that involve winter wheat and summer legumes in the SGP (MacKown et al., Citation2007; Rao & Northup, Citation2008, Citation2009). Indeed, much of the failure of legume green N manures in the SGP has largely been due to reduced moisture availability for following cash crops (Nielsen et al., Citation2015; Robinson & Nielsen, Citation2015), particularly within the upper 35 cm of the soil profile (Rao & Northup, Citation2008, Citation2009). Soil moisture in this segment of the soil profile is critical for establishment and fall growth by winter wheat. Cowpea in the current study was terminated about 1.5 months prior to planting of winter wheat, in part to avoid excessive loss of soil moisture through transpiration. Yet, growth and yield of winter wheat in response to cowpea did not differ from the response of wheat to the unfertilized control. Future studies should focus on avoiding N losses during the period of termination of legume green manure and germination of winter wheat.
The RUE of aboveground biomass of most crops normally falls within a range of 2–4 g DM MJ−1 (Russell, Jarvis, & Monteith, Citation1989). However, average RUE in this study (1.05 g DM MJ−1) was considerably lower than RUE obtained for winter wheat in other regions. For example, Olesen et al. (Citation2000) and Andersen et al. (Citation2013) reported average RUE values between 2.6 and 2.7 g DM MJ−1 for winter wheat cropped in Denmark. Although RUE in this study was considerably lower, IPAR in this study (470 MJ m−2) was similar to IPAR reported in those previous studies (410–442 MJ m−2). However, DM yields of winter wheat in those studies (9.6–11.4 Mg ha−1) were much higher than was obtained in the current study (3.1–7.7 Mg ha−1). Die-back of some of the biomass produced during the fall through the winter period may have partially contributed to lower aboveground DM and resulting lower RUE. To our knowledge, RUE estimates based on canopy reflectance of winter wheat have not been reported for the SGP. Based on light interception calculated from the measurement of leaf area index, Lollato and Edwards (Citation2015) reported RUE ranging from 0.8 to 1.9 g MJ−1 for winter wheat cultivated under non-limiting conditions (optimized irrigation and fertilization) in Oklahoma. However, the DM produced by winter wheat (9.6–11.4 Mg ha−1) was considerably higher than in the current study, where wheat was grown under rain-fed conditions. This indicates that yield improvement through crop management could be a key to improving RUE of winter wheat in the region.
5. Conclusions
This study tested how different rates and forms (inorganic vs. organic) of N fertilizer affect growth and yield of winter wheat within NT and CT systems applied to the continuous production of winter wheat. The amount of DM produced by winter wheat, IPAR and RUE under NT system were either only slightly higher or similar to levels generated under CT. However, growth and DM yield of winter wheat increased with increasing amounts of applied inorganic N. Cowpea as N source was not effective in supporting growth and yield of winter wheat. Overall, results from this study indicate amounts and efficiency of radiation interception by winter wheat are controlled more than forms and rates of nitrogen fertilizers than tillage operations. Future studies should focus on effective transfer of organic nitrogen from summer legume cover crops cultivated to winter wheat cultivated in the US SGP.
Additional information
Funding
Notes on contributors
Tanka P. Kandel
Tanka P. Kandel The authors’ research program is geared towards developing cropping systems to improve production potential and to reduce environmental impacts. Research expertise covers growth, productivity and quality of field crops. Research interest of authors lie in the intersection of agronomy and environment with topics such as carbon and nitrogen turnover in agricultural soil, sustainable managements of water and nutrients in agroecosystems.
References
- Andersen, M. N., Munkholm, L. J., & Nielsen, A. L. (2013). Soil compaction limits root development, radiation-use efficiency and yield of three winter wheat (Triticum aestivum L.) cultivars. Acta Agriculturae Scandinavica, Section B - Soil & Plant Science, 63, 409–13.
- Baumhardt, R. L., Schwartz, R. C., Jones, O. R., Scanlon, B. R., Reedy, R. C., & Marek, G. W. (2017). Long-term conventional and no-tillage effects on field hydrology and yields of a dryland crop rotation. Soil Science Society America Journal, 81, 200-209.
- Bergtold, J. S., Ramsey, S., Maddy, L., & Williams, J. R. (2017). A review of economic considerations for cover crops as a conservation practice. Renewable Agriculture and Food Systems, 34, 62–76.
- Bidlack, J. E., & MacKown, C. T., Rao S. C. (2007). Dry matter and nitrogen content of chickpea and winter wheat grown in pots for three rotations. Journal of Plant Nutrition, 30, 1541–1553.
- Christensen, S., & Goudriaan, J. (1993). Deriving light interception and biomass from spectral reflectance ratio. Remote Sensing of Environment, 43, 87–95. doi:10.1016/0034-4257(93)90066-7
- Decker, J. E., Epplin, F. M., Morley, D. L., & Peeper, T. F. (2009). Economics of five wheat production systems with no-till and conventional tillage. Agronomy Journal, 101, 364–372. doi:10.2134/agronj2008.0159
- DeLaune, P. B., & Sij, J. W. (2012). Impact of tillage on runoff in long term no-till wheat systems. Soil and Tillage Research, 124, 32–35. doi:10.1016/j.still.2012.04.009
- Hossain, I., Eplin, F. M., Horn, G. W., & Krenzer, E. G., Jr. (2004). Wheat production and management practices used by Oklahoma grain producers. Stillwater: Oklahoma Agricultural Experiment Station, Oklahoma State University.
- Jacobsen, J. S., & Westermann, R. L. (1988). Nitrogen fertilization in winter wheat tillage systems. Journal of Production Agriculture, 1, 235–239. doi:10.2134/jpa1988.0235
- Kandel, T. P., Elsgaard, L., Andersen, M. N., & Lærke, P. E. (2016). Influence of harvest time and frequency on light interception and biomass yield of festulolium and tall fescue cultivated on a peatland. European Journal of Agronomy, 81, 150–160. doi:10.1016/j.eja.2016.09.010
- Lollato, R. P., & Edwards, J. T. (2015). Maximum attainable wheat yield and resource-use efficiency in the southern great plains. Crop Science, 55, 2863–2876. doi:10.2135/cropsci2015.04.0215
- MacKown, C. T., Heitholt, J. J., & Rao, S. C. (2007). Agronomic feasibility of a continuous double crop of winter wheat and soybean forage in the southern great plains. Crop Science, 47, 1652–1660. doi:10.2135/cropsci2006.10.0683
- Monteith, J. L., & Unsworth, M. H. (1990). Principles of environmental physics. London: Edward Arnold.
- Nielsen, D. C., Lyon, D. J., Hergert, G. W., Higgins, R. K., & Holman, J. D. (2015). Cover crop biomass production and water use in the Central great plains. Agronomy Journal, 107, 2047–2058. doi:10.2134/agronj15.0186
- Northup, B. K., & Rao, S. C. (2016). Effects of legume green manures on forage produced in continuous wheat systems. Agronomy Journal, 108, 101–108. doi:10.2134/agronj15.0031
- Oklahoma Agricultural Statistics. (2016). Oklahoma Department of Agriculture, Food and Forestry. Retreived from: https://www.nass.usda.gov/Statistics_by_State/Oklahoma/Publications/Annual_Statistical_Bulletin/ok_bulletin_2016.pdf
- Olesen, J. E., Mortensen, J. V., Jørgensen, L. N., & Andersen, M. N. (2000). Irrigation strategy, nitrogen application and fungicide control in winter wheat on a sandy soil. I. Yield, yield components and nitrogen uptake. The Journal of Agricultural Science, 134, 13–23. doi:10.1017/S0021859699007285
- Pimentel, L. G., Weiler, D. A., Pedroso, G. M., & Bayer, C. (2015). Soil N2O emissions following cover‐crop residues application under two soil moisture conditions. Journal of Plant Nutrition and Soil Science = Zeitschrift FüR PflanzenernäHrung Und Bodenkunde, 178, 631–640. doi:10.1002/jpln.v178.4
- Rao, S. C., & Northup, B. K. (2008). Forage and grain soybean effects on soil water content and use efficiency. Crop Science, 48, 789–793. doi:10.2135/cropsci2007.08.0423
- Rao, S. C., & Northup, B. K. (2009). Water use by five warm-season legumes in the southern great plains. Crop Science, 49, 2317–2324. doi:10.2135/cropsci2009.03.0134
- Rao, S. C., & Northup, B. K. (2011). Grass pea (Lathyrus Sativus L.) as a nitrogen source for continuous no-till winter wheat. Crop Science, 51, 1824–1831. doi:10.2135/cropsci2010.09.0513
- Redmon, L., Horn, G. W., Krenzer, E. G., & Bernardo, D. J. (1995). A review of livestock grazing and wheat grain yield: Boom or bust? Agronomy Journal, 87, 137–147. doi:10.2134/agronj1995.00021962008700020001x
- Robinson, C., & Nielsen, D. (2015). The water conundrum of planting cover crops in the great plains: When is an inch not an inch? Crops & Soils, 48, 24–31. doi:10.2134/cs2015-48-1-7
- Russell, G., Jarvis, P. G., & Monteith, J. L. (1989). Absorption of radiation by canopies and stand growth. In G. Russel, B. Marshall, & P. G. Jarvis (Eds.), Plant canopies: Their growth, form and function (pp. 21–41). Cambridge: Cambridge University Press.
- Sharpley, A. N., & Smith, S. J. (1994). Wheat tillage and water quality in the southern plains. Soil and Tillage Research, 30, 33–48. doi:10.1016/0167-1987(94)90149-X
- Sij, J., Belew, M., & Pinchak, W. (2016). Nitrogen management in no-till and conventional-till dual-use wheat/stocker systems. Texas Journal of Agriculture and Natural Resources, 24, 38–49.
- Thomason, W. E., Raun, W. R., & Johnson, G. V. (2000). Winter wheat fertilizer nitrogen use efficiency in grain and forage production systems. Journal of Plant Nutrition, 23, 1505–1516. doi:10.1080/01904160009382118
- Thomason, W. E., Raun, W. R., Johnson, G. V., Freeman, K. W., Wynn, K. J., & Mullen, R. W. (2002). Production system techniques to increase nitrogen use efficiency in winter wheat. Journal of Plant Nutrition, 25, 2261–2283. doi:10.1081/PLN-120014074