
Abstract
Increased nutrient mining, soil erosion, and limited nutrient management has led to declines in soil quality and reduced productivity in many parts of Nepal. A study was conducted in the eastern part of the Dang district of Nepal in 2015 to assess the variability of selected soil properties of three different land use types (agricultural, agroforestry, and grassland) and to map their spatial distribution. A total of 120 soil samples were collected from 0–15 cm depth and analyzed for soil fertility parameters: pH, organic matter (OM), nitrogen (N), phosphorus (P), potassium (K), boron (B), and zinc (Zn). Results revealed that the average value of the soil pH significantly (P < 0.05) varied from agroforestry to agricultural land use. Soil OM and N contents were in the medium range in all land use with minor variation, with the highest average OM and N found in grassland (2.87% and 0.14%), followed by agricultural land (2.64% and 0.13%), and agroforestry (2.45% and 0.12%). Soil P showed a significant variation between agroforest (18.99 kg ha−1) and grassland (8.49 kg ha−1). Soil K content was high in grassland (144.44 mg kg−1) and low in agricultural land (120.95 mg kg−1) but was not statistically significant. Micronutrient B was low (0.28–0.35 mg kg−1) and Zn was very low (0.14 mg kg−1). The interpolated soil maps thus generated may assist farmers in identifying the expected nutrient levels for their localities and encourage them to modify their management practices to improve productivity and lift income.
PUBLIC INTEREST STATEMENT
Nepalese scenario with the current practice of soil fertility assessment uses a random soil sampling protocol to obtain an average soil fertility value for farmers’ field. Those soil testing results that do not provide randomness of variations from one place to another. Variation in soil properties can occur within farmland to the landscape scale. Despite the advisory recommendations made by research, most of the farmers apply acid forming nitrogenous fertilizers only. In short term, increased in fertilizers use will increase the crop yield, but in long term it creates an imbalance in soil health. Many farmers see more micronutrients deficiencies in their farming land. Information on spatial variability of soil nutrients is important to suggest different remedial measures for optimum production without adding harmful effects on the environment. This article implies local farmers and planners to create effective soil management strategies in their land use.
Competing interests
The authors declares no competing interests.
1. Introduction
Soil properties vary in different spatial areas due to the combined effect of biological, physical, and chemical processes over time (Santra, Chopra, & Chakraborty, Citation2008), and can vary within farmland or at the landscape scale (Corwin et al., Citation2003; McBratney & Pringle, Citation1997; Mouazen, Dumont, Maertens, & Ramon, Citation2003). Different land use and management practices greatly impact soil properties (Spurgeon, Keith, Schmidt, Lammertsma, & Faber, Citation2013), and knowledge of the variation in soil properties within farmland use is essential in determining production constraints related to soil nutrients. It is also important to suggest different remedial measures for optimum production and appropriate land use management practices (Panday, Maharjan, Chalise, Shrestha, & Twanabasu, Citation2018). Sustainable land management practices are necessary to meet the changing human needs and to ensure long-term productivity of farmland (Hălbac-Cotoară-Zamfir, Keesstra, & Kalantari, Citation2019).
Nepal’s land is classified into forestry, grassland, agricultural land, residential, commercial, archeological, and water bodies as per the land use categories outlined by the National Land Use Policy (NLUP, Citation2015). Among the different land types, forest, grassland, and agricultural lands are essential for farmers’ livelihood. Nearly one-third of Nepal’s land is under forest (mostly agroforestry), 20% is under cultivation (agricultural land), and 11% is under grassland (Amatya & Newman, Citation1993). Poor land management practices have significantly affected soil quality and crop production, with the average annual crop production rate decreasing by 3.5% in 2014–2016 (MOAD, Citation2017). Land use and management practices are closely interrelated with soil quality, and the adoption of appropriate land management practices and land use planning would be helpful to both restore the degraded soil physicochemical quality and ensure steady and sustainable productivity (Oyetola & Philip, Citation2014).
Dynamics of soil properties such as texture, pH, electrical conductivity, carbon (C), nitrogen (N), available phosphorus (P), available potassium (K), and micronutrients are studied in different land use scale and dimensions (Jafarian, Shabanzadeh, Kavian, & Shokri, Citation2014; Kharal, Khanal, & Panday, Citation2018; Kilic, Kilic, & Kocyigit, Citation2012; Wei, Xiao, Zeng, & Fu, Citation2007). Out of eight micronutrients (B, Zn, Fe, Cu, Cl, Mo, Ni, Mn), Boron (B) and Zinc (Zn) are the most limited in Nepalese soils, followed by Molybdenum (Mo) (Andersen, Citation2007). Nepal is a predominantly rice (Oryza sativa L.), maize (Zea mays L.), and wheat (Triticum aestivum L.) crop-based country where the deficiency of B and Zn greatly influence yield gain. Molybdenum is mostly deficient in the growing area of cole crops. It is important to know how these soil properties vary in different land use contexts so that best management practice options can be recommended to growers based on the limited nutrients.
Dang is a valley of alluvial deposits in Nepal with a soil texture of sandy loam to clayey. Young alluvial soil deposits are generally rich in nutrient content, but the Dang valley has an old alluvial deposition, which is poor in nutrient content and thus requires special attention to soil management. The lack of any previous study makes it hard to assess the nutrient profile of the land and suggest proper management protocols to farmers. Many smallholder farmers reside in the Dang valley and have poor access to agricultural inputs, including organic and inorganic fertilizers. Therefore, the objectives of this study were to explore the variability in soil chemical properties due to different land use and map their spatial distribution using the spatial statistical technique (kriging). The study also aimed to evaluate the relationships of selected soil chemical properties under different land use and recommend appropriate soil fertility management practices for the Dang district of Nepal. This study will be helpful for both farmers and local planners to create effective soil management strategies.
2. Materials and methods
2.1. Study area
The Dang district, the largest valley in Asia. It lies in Province number 5 in the Mid-Western region of Nepal. The study area is located in inner Terai between the Churiya mountain range to the south and the Mahabharat range to the north. It is about 180 km from Butwal, the capital city of Province 5 and 450 km from Kathmandu, the capital city of Nepal.
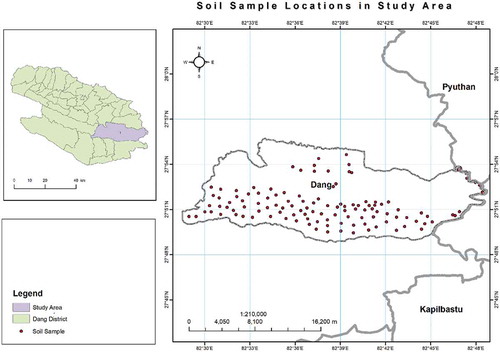
This study was carried out in the eastern part of Dang district and includes Lamahi Municipality (formerly Chaulahi and Sonpur Village Development Committees) and Rapti Rural Metropolitan (formerly Sisahaniya and Lalmatiya Village Development Committees) and covers 22,462 ha of land (Figure ). The elevation area ranges from 235 to 885 m.
Figure 1. Map showing study area and soil sampling locations in the eastern part of the Dang district of Nepal.
The climate of the study area is tropical to sub-tropical characterized by monsoon rainfall from June to September, which on average account for 85% of the total annual rainfall (of 1500 mm) with an average temperature of 27°C (MFD, Citation2018; Panday, Citation2012) . The district has undulating terrain sloping towards the south. Alluvial deposits from different river systems at different times make up most of the plain (Acharya, Citation2008; Poudel, Fuwa, & Otsuka, Citation2013). The study area is classified as Ustorthents (46.07%), Dystrudepts (21.41%) and Haplustolls (21.43%) soil followed by others (11.09%) according to the United States Department of Agriculture (USDA) Soil Taxonomy (USDA, Citation1999). Loam and clayey soils are the dominant soil textures.
2.2. Farming system and land use
Agriculture is the mainstay of the economy in the study area and is characterized by subsistence mixed crop-livestock farming where forest covers the largest area (64.62%), followed by agricultural (32.72%) and grassland (2.76%) systems. Farmers owned agricultural land and grassland paddock, but the forest is communal. The average farm and paddock size per household is less than 0.5 ha in the study area whereas all the forest land is the community forest.
Agricultural land: Major crops in the study area include rice, wheat, lentil (Lens culinaris), maize, oilseeds, vegetables, and potatoes (Solanum tuberosum L.). Rice-wheat (35.25%) is the dominant cropping pattern, followed by rice-pulses (21.81%). Livestock is closely integrated into the farming system and is used mainly for plowing, threshing, and transport. Livestock also provides food and household income. Crop residues are either removed for fuelwood or used as animal feed. As a result, there is no crop residue in the field as a source of organic amendments. Application of farmyard manure (FYM), urea, di-ammonium phosphate (DAP), and muriate of potash (MOP) are the most common nutrient sources in the study area (Pandey et al., Citation2018). The source of trace elements in the agriculture land is only through FYM through which micro-nutrient addition is insignificant. Farmers do not apply micro-nutrient fertilizers regularly in all crops. Specifically, in potato growing area, they apply borax (B mineral source) but not continued for other crops.
Agroforestry: Nepal’s agroforestry is broadly categorized as (i) farm-based, and (ii) forest-based (Amatya & Shrestha, Citation2002). The components of farm-based agroforestry include the inclusion of fodder trees in the cultivation land from which farm is dually profitable from livestock and crops. Forest-based agroforestry systems comprise a wide combination of timber species with the cultivation of spices such as ginger (Zingiber officinale) and cardamom (Elettaria cardamomum). Farmers from Lamahi Municipality mainly follow farm-based agroforestry, whereas forest-based agroforestry is dominant in Rapti Rural Municipality. Sal (Shorea robusta) forest is the dominant native vegetation, along with khair (Acacia catechu), sissoo (Dalbergia sissoo), and silk cotton trees (Bombax ceiba) growing near the river streams. In farm-based agroforestry introduction of exotic fodder species like ipil-ipil (Leuceana leucocephala), calliandra (Calliandra calothyrsus), kimbu (Morus alba), napier (Pennisetum purpureum), and stylo (Stylosanthes guianensis). Hardly any, farmers use additional fertilizers (organic or inorganic sources) in farm or forest-based agroforests.
Grassland: Grasslands are flat or sometimes sloping land with permanent annual grass cover for animal grazing throughout the year (Suttie, Reynolds, & Batello, Citation2005). Common native vegetation species found there include siru (Imperata cylindrica), worela (Saccharum bengalensis), kans (Saccharum spontaneum), kharahi (Narenga porphyrocoma), and kush (Desmostachya bipinnata). Fertilizers are rarely applied in the grassland.
2.3. Soil sampling and geostatistical analysis
From the study area, surface soil samples (0 to 15 cm depth) were collected in May 2015 using a soil auger from three land use types: agricultural, agroforestry, and grassland. A total of 120 soil samples were collected, including agricultural land (94 samples), agroforestry (22 samples), and grassland (4 samples). Each soil sample was prepared by mixing three sub-samples.
Soil sampling locations were selected to best represent each land use condition by considering variation in the terrain attributes and drainage facilities. Sample intensity was higher in the agricultural lands compared to the agroforest and grasslands because higher numbers of land units were presented in the agricultural land. In the agroforestry and grassland similar terrain resulted in fewer land units, and sampling points were selected based on these land units. A global positioning system (GPS) was used to locate the sampling locations (Figure ). The collected soil samples were analyzed for soil texture, pH, organic matter (OM), total nitrogen (N), P, K, B, and Zn. Methods used for testing of soil chemical parameters at the Regional Soil Testing Laboratory, Kaski, Nepal are given in Table .
Table 1. Soil chemical analysis methods followed by regional soil testing laboratory, Kaski, Nepal
The soil core method was used to measure the bulk density of the soil (Lichter & Costello, Citation1994). A core of diameter 7 cm and height 7.5 cm was inserted in to soil up to 15 cm depth. The core then subjected to oven dry in 105 °C for 24 hours to calculate dry mass. Gravel content of the core was measured after weighing dry mass. Bulk density was then calculated dividing oven-dry mass by bulk volume after subtracting gravel content. Within each sampling location, at first three core samples were collected, and bulk density was determined. The results from three core samples were averaged to calculate the bulk density of that sampling location.
Laboratory results of soil chemical properties were then used to produce several digital map layers using kriging in GIS software Arc Map (version 10.2) based on each soil nutrient property at a 1:25,000 scale. Kriging is one of the most commonly used spatial interpolation methods in the geostatistical analysis (Panday et al., Citation2018; Santra et al., Citation2008), and it has the power to interpolate non-sampled locations based on sample locations by estimating the values between the samples (Journel & Huijbregts, Citation1978). Details regarding the kriging formula and calculations are outlined by Yao et al. (Citation2013). The spatial distribution of digital soil maps was ranked into different classes based on the standard recommendation given by the Nepal Agricultural Research Council and used by the Soil Management Directorate of the Department of Agriculture in Nepal (Table ).
Table 2. Rating for different soil chemical parameters given by the Soil Management Directorate, Department of Agriculture for the Terai region of Nepal
2.4. Data analysis
Descriptive statistics and geostatistics were used to analyze and interpret soil datasets. Descriptive statistics were run in Statistix 10. The Tukey-Kramer test evaluated differences among the land use types. If a significant effect was found, pairwise comparisons were conducted using the least significant differences test to determine the means of soil chemical properties among the land use types. Spatial distribution of soil maps was prepared using kriging interpolation in ArcMap. The pairwise Pearson’s correlation between the soil chemical properties was calculated in RStudio v1.1.463 and the correlation plot was generated using R package “corrplot.”. In the correlation matrix, determining variables (nutrient elements) influencing soil fertility variation across space were selected and compared their association. Significant differences were stated at the level of P < 0.05.
3. Results and discussion
3.1. Soil physical properties
3.1.1. Soil textural fraction and bulk density
Soil texture of the study area was not affected by land use. Clay loam was the dominant soil textural class throughout the study area (Figure ), which indicates the homogeneity of soil forming processes and the similarity of parent materials. The overall mean of the clay fraction was found to be higher in the agricultural land (34.43%) compared to agroforestry (30.00%) and grassland (28.33%). Intensive soil management practices that promote further weathering processes could be a possible reason for higher clay content (Negasa, Ketema, Legesse, Sisay, & Temesgen, Citation2017); however, under sparser vegetation, clay fractions are likely to be lost due to selective water erosion processes in the grassland (Woldeamlak & Stroosnijder, Citation2003) . The sum of the mean of the silt and clay fractions was high in the grassland (73.33%) and the agricultural land (71.91%) compared to the agroforest land (66.77%). A recent finding by Whisler, Rowe, and Dukes (Citation2016) suggests that silt and clay contents were the strongest predictor of soil C and N.
Figure 2. Values (mean ± SE) of a) soil fraction and b) bulk density based on land use types of the Dang district of Nepal.
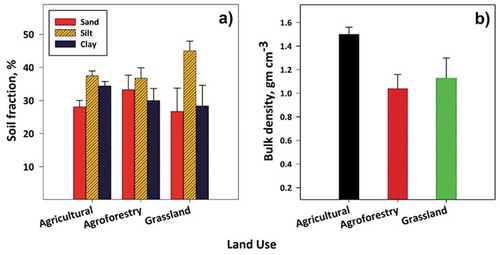
Bulk density was the highest in the agricultural lands (1.50 g cm−3) and the lowest in the agroforest lands (Figure ). Bulk density was significantly affected by land use (P < 0.05). The lower bulk density in the agroforestry could be due to the continuous addition of higher soil organic residues from agroforestry components on topsoil (Khanal, Sharma, & Upadhyaya, Citation2010). On the other hand, the higher bulk density of agricultural land is due to continuous tillage operation, which in turn lowers soil organic C (through the process of rapid mineralization of soil OM), thereby exposing OM for microorganisms (He, Kuhn, Zhang, Zhang, & Li, Citation2009). The results showed that the grasslands had intermediate bulk density, which can correlate with grazing pressure. Farmers often graze animals on existing small or bare plots of land, and this has a significant contribution to the increment of bulk density in grassland due to the compaction effect (Panday et al., Citation2018). It is important to highlight that bulk density strongly correlates with soil OM and organic C content (Chaudhari, Dodha, Ahire, Ahire, & Saroj, Citation2013; Hollis et al., Citation2006; Nascente, Yuncong, & Carlos, Citation2015). Our results also indicated that a change in bulk density is negatively associated with the changes in soil OM in the studied land use (r = −0.93, −0.77, and −0.94 for agricultural, agroforestry, and grassland, respectively), which is required for proper growth of plants.
3.2. Soil chemical properties
3.2.1. Soil pH1:2 water
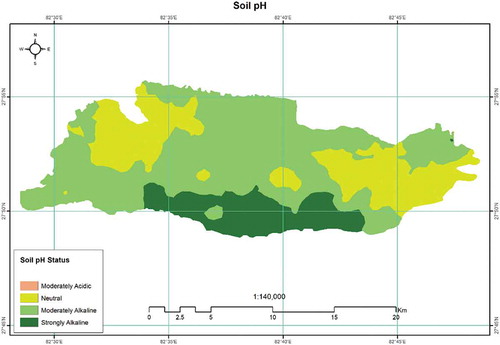
The soil pH was significantly (P < 0.05) different by land use. Neutral pH (~7.05) in the agroforest lands (minimum 5.80 and maximum 8.20) to moderate alkaline (~7.53) in the agricultural lands (minimum 6.10 and maximum 8.40) was recorded (Tables and ). However, the soil pH of the grassland (~7.47) (minimum 6.60, and maximum 8.10) does not vary significantly from either agricultural or agroforest land use. The soils in the study area were moderately alkaline to strongly alkaline (Figure and Table ).
Table 3. Spatial variability of soil chemical properties among land use in the eastern part of the Dang district of Nepal
Table 4. Area covered by land use under different soil categories based on soil fertility parameters in the eastern part of the Dang district of Nepal
Figure 3. Soil pH1:2 water spatial variability map in the eastern part of the Dang district of Nepal. Most of the study area had moderately alkaline (57.50%) followed by neutral (27.81%) and strongly alkaline (14.68%) pH. Moderately acidic pH was present in a very small area (0.01%) that cannot be seen in the variable map.
The literature reveals that Nepal is dominated by moderately acidic soils due to parent material (such as sandstone, siltstone, quartzite, and shale), loss of major cations during monsoon season, and the atmospheric nature of aluminum in these soils (Ghimire & Bista, Citation2016; Pandey et al., Citation2018). However, soils in the western part of Nepal are dominated by alkaline parent material, along with the presence of base-forming cations associated with carbonates and bicarbonates found naturally in soils and irrigation water. Higher soil pH in our study area could be due to the addition of potash through traditional slash and burn practices (Moraes, Volkoff, Cerri, & Bernoux, Citation1996) or may be due to irrigation with calcium (Ca)-enriched water (Shah & Schreier, Citation1995). High alkaline soil pH (> 27% in total of 1232 sample size) was also reported by Bajracharya, Sitaula, Sharma, and Jeng (Citation2007) from the Mid-Western Development Region.
3.2.2. Soil organic matter
Soil organic matter (OM) did not vary significantly with land use; the grasslands had the highest soil OM and the agroforest lands had the lowest (Table ). Most of the study area was occupied by low and medium soil OM (Figure and Table ). A study conducted by Wei et al. (Citation2009) in the northern Loess Plateau in China revealed that distribution of extensive root systems might contribute to higher soil OM under natural grasslands. Additionally, the vegetation and plant litter, combined with minimal disturbance, form a covering layer in the grasslands that protects the soil from erosion (Chalise, Kumar, Shriwastav, & Lamichhane, Citation2018; Shah & Schreier, Citation1995).
Figure 4. Soil OM spatial variability map in the eastern part of the Dang district of Nepal. The study area was dominated by low (69.40%) and medium (30.60%) OM content.
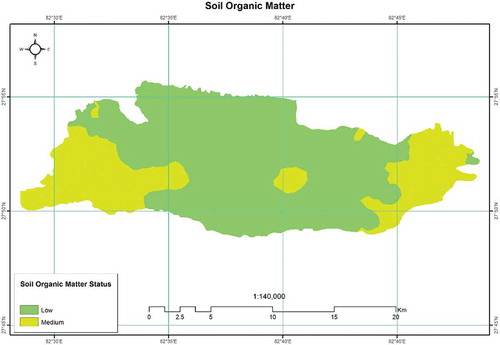
A relatively lower amount of soil OM in the agricultural soils may be associated with the removal of crop residues (Awasthi, Singh, & Sitaula, Citation2005). A recent study by Pandey et al. (Citation2018) reported that the intensive tillage for crops in parts of Nepal lowered nutrient concentration and soil OM, thereby declining soil fertility.
3.2.3. Total nitrogen
Results showed that the grasslands (0.14%) had the highest total nitrogen (N), followed by agricultural (0.13%) and agroforest lands (0.12%) (Table ). The land use pattern was further classified into high to low N containing areas and presented in Figure . Furthermore, the area covered by land use under different N classes based on the range representing their magnitude in the soil is presented in Table . The results were in line with the findings of Duguma, Hager, and Sieghardt (Citation2010), who found higher N in woodlot and pasture land compared to agricultural lands. A similar study conducted by Yimer, Ledin, and Abdelkadir (Citation2006) found the soil OM and N contents to be significantly lower in the agricultural lands compared to grazing and forest lands.
Figure 5. Soil N spatial variability map in the eastern part of the Dang district of Nepal. Most of the study area had medium (77.16%) soil N content. High soil N was present in less than 2% of the total area.
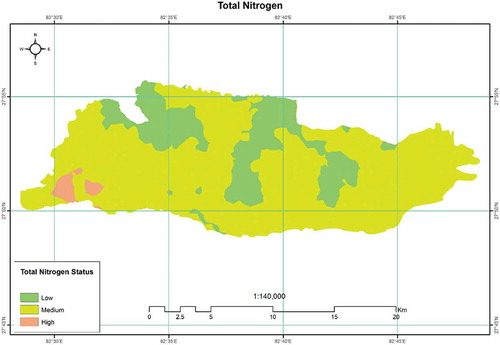
Variation in N within agricultural land is reflective with different soil management practices, application of FYM, and the amount of fertilizer applied to previous crops, among other factors (Sherchan & Gurung, Citation1995). In addition, a combination of lower C inputs, tillage, and crop residue collection can cause reduction of OM and N in agricultural soils (Wang, Fu, Qiu, & Chen, Citation2001). In general, N has a greater effect on crop growth, quality, and yield compared to other nutrients.
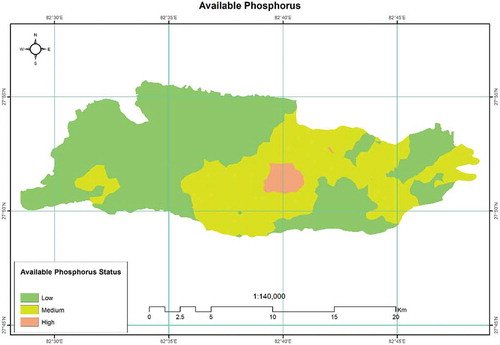
3.2.4. Available phosphorus
Results showed a significant difference in available phosphorus (P) between agricultural (11.89 kg ha−1), agroforestry (18.99 kg ha−1), and grasslands (8.49 kg ha−1) (Table ). The agroforest land had the highest available P compared to agricultural land and grassland. The reason could be due to higher litter accumulation in the forest (DeBano, Citation1991) and the increased availability of materials such as lignin (Zhang, Zhang, Peng, Chen, & Cao, Citation2017). However, the P in agricultural land (11.89 kg ha−1) was not significantly different from agroforestry or grassland at P < 0.05. Higher P content in the agricultural lands could be explained by the application of P-containing fertilizer (such as DAP, which contains 18% N and 46% P) (Pandey et al., Citation2018), and by the application of manure including FYM for soil fertility (Miheretu & Yimer, Citation2018). The study area was dominated by low and medium classes of soil P (Figure ). The area covered by land use under different soil P classes is presented in Table . The strongly alkaline soils in the Dang district may be responsible for the higher soil P in the study area. Soils with inherent pH values between 6.5 and 7.5 are ideal for P availability (IPNI, Citation2010).
Figure 6. Soil P spatial variability map in the eastern part of the Dang district, Nepal. Most of the study area had low (60.18%) and medium (37.32%) P content. Only 2.20% of the study area had a high P content in the soil.
3.2.5. Available potassium
Our analysis shows that soil concentration of available potassium (K) was at medium to high levels in the study area (Table ), covering about 95% of the total study area (Figure ). The average value of K for agricultural land was 120.95 mg kg−1, whereas the value was 130.16 and 144.44 mg kg−1 for agroforestry and grassland, respectively. The concentration of K was not affected by land use type (P > 0.05). The details of the area covered by land use under different K classes based on the range representing their magnitude in the soil is presented in Table . The nature of parent materials, weathering, land use systems, types of fertilizer applied and their leaching rate, and crop residue determines the availability and distribution of K content in soils (Mbah, Citation2008; Uzoho & Ekeh, Citation2014).
Figure 7. Soil K spatial variability map in the eastern part of the Dang district, Nepal. The study area was dominated by medium (50.51%), followed by high (44.26%) and very high (3.99%) K content. Only 1.25% of the study area had low K content in the soil.
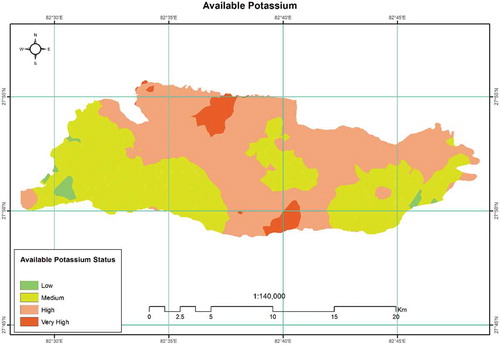
In general, the concentration of exchangeable cation is low in the agricultural lands and high in agroforest lands. An increase in the soil K content can be attributed to the addition of OM in soil using organic manures but requires special attention due to low nutrient content, soil pH, and bulky volume (Mikkelsen, Citation2007). The increased input of OM increases the soil cationic exchange capacity, which can reduce the leaching rate of positively charged nutrients like Ca2+, potassium (K+), and magnesium (Mg2+) (Mbah, Citation2008). However, the leaching of soil K through irrigation water, limited recycling of crop residue, continuous cropping, and soil erosion have contributed to the depletion of basic cations on agricultural lands compared to agroforestry and grasslands (Akbas, Gunal, & Acir, Citation2017; Lechisa, Achalu, & Alemayehu, Citation2014; Srivastava, Johansen, Neupane, & Joshi, Citation2005). Interestingly, several places in Chaulahi village within the study area had high OM but were recorded with low K value, which could be due to the high erosion losses at those sites, which were alongside riverbanks.
3.2.6. Available boron and zinc
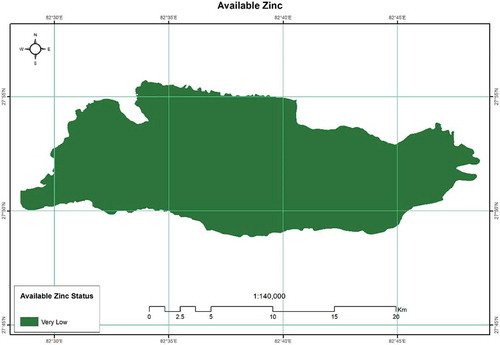
Of the two micronutrients measured, B was low and Zn was very low in the study area (Table ). Relatively, B content was higher in the grasslands (0.35 mg kg−1) compared to agricultural land (0.30 mg kg−1) and agroforestry (0.28 mg kg−1). Available Zn content was not affected by land use (P > 0.05; agricultural = agroforestry = grassland = 0.14 mg kg−1). The soil B spatial variability map was dominated by the low and medium classes (Figure ) and the soil Zn variability map was solely dominated by the very low class (Figure ). In addition, the area covered by land use under different soil B and Zn classes is presented in Table .
Figure 8. Soil B spatial variability map in the eastern part of the Dang district, Nepal. Most of the study area had very low (52.70%) and low (46.44%) B content. Soil B at medium levels was present in less than 1% of the total area.
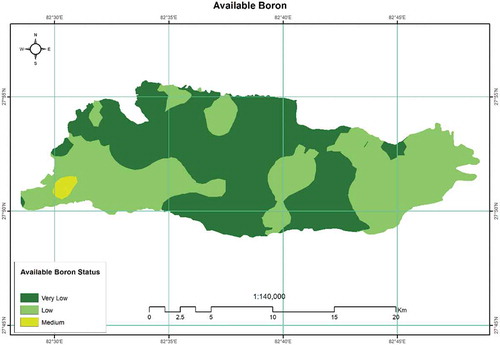
Figure 9. Soil Zn spatial variability map in the eastern part of the Dang district, Nepal. All of the study area had a very low level of Zn content.
The possible reasons for low micronutrients could be due to unfavorable soil pH, intensive cropping, the use of high yielding varieties, and unsuitable fertilizer application strategies practiced by smallholder farmers (Panday et al., Citation2018). The Khaira disease (leaf bronzing) in rice due to Zn deficiency and sterility in wheat induced by an inadequate B supply are the major concerns in the study area (Panday et al., Citation2018). As legume constitute a major crop share, the lower B affects the nodulation in legume plants and can greatly reduce yield (Andersen, Citation2007; Shrestha, Siddique, Turner, Turner, & Berger, Citation2005). Many findings suggest that Zn deficiency can be seen in many parts of Nepal (Boa & Rob Harling, Citation2008; Panday et al., Citation2018; Srivastava et al., Citation2005; Subedi & Jaishy, Citation2000). Improper fertilizer use practices and mismanagement of land resources have been accelerating deficiencies of micronutrients nationwide and are likely to become more severe problems in the long run.
3.2.7. Correlation between soil chemical properties
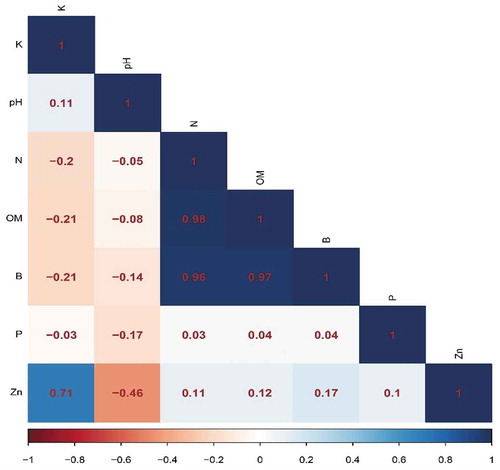
The soil OM with N (r2 = 0.98, P < 0.01), OM with B (r2 = 0.92, P < 0.01), and N with B (r2 = 0.92, P < 0.01) had a strong correlation (Figure ). Available K with Zn (r2 = 0.54, P < 0.01) had a moderate correlation. However, pH with Zn (r2 = 0.21, P < 0.01), N with K (r2 = 0.21, P < 0.01), OM with K (r2 = 0.04, P < 0.01), and K with B (r2 = 0.04, P < 0.01) had the lowest correlation. The soil pH was found to be responsible for variable distribution of different soil minerals, and it was found that Zn, B, P, N, and OM were negatively correlated with pH with r2 = 0.21, 0.02, 0.03, 0.001, and 0.007, respectively. In general, a strong association between different soil chemical properties was observed.
Figure 10. Correlation matrix based on Pearson’s correlation coefficients between soil chemical properties in the eastern part of the Dang district of Nepal.
3.3. Soil fertility management
The variability of soil nutrients across different land use in the Dang valley calls for a proper soil management strategy. While managing these nutrients is required to address the problem of nutrient mining in the study area, it is equally important to replenish those with good soil management practices too.
The major limitation of the study is the small sampling size from agroforestry and grassland compared to agricultural lands. There was a significant difference in the soil pH and P among land use types. Over the long-term, the increase in the alkalinity of the soil of the agricultural lands can be managed through crop rotation with legume integration. Soil OM is present in a low to medium amount in most of the study area, which can be increased and could also be helpful in managing the soil pH. Higher soil pH in the agricultural lands due to the presence of alkaline parent materials is difficult to manage with soil amendments because continuous weathering from carbonates replaces hydrogen ions, making soil alkaline. In such case, it would be better to use elemental sulphur (S) for S and ammonium sulphate for N and S as a soil amendment for acidification, or to grow alkali-loving plants such as cauliflower (Brassica oleracea var. botrytis), lettuce (Lactuca sativa), spinach (Spinach oleracea), carrot (Daucus carota subsp. sativus), asparagus (Asparagus officinalis), cabbage (Brassica oleracea var. capitate), beet (Beet vulgaris), and celery (Apium graveolens). Leaching of Ca salts could be a better option for larger farms with non-saline irrigation water (Grismer, Citation1990).
To manage soils with a medium level of OM, N should be increased. In the agroforest and grassland, the continuous deposition of leaf litter and root decomposition will be helpful in enriching soil OM. The challenge of managing soil OM is greater in agricultural land use due to continuous cropping systems and nutrient mining. The continuous exhaustion of N due to crop harvest and soil OM due to oxidation can be minimized with the use of local organic manure resources. The incorporation of organic manure resources such as dhaincha (Sesbania bispinosa), barseem clover (Trifolium alexandrinum), asuro (Adhatoda vesica L.), banmara (Eupatorium spp.), and soybean (Glycine max L.) is one sustainable way of increasing soil OM and N along with balancing soil pH. In addition, managing crop residues, protecting fire (modified slash and burn to slash and residue retention), use of organic inputs, and conservation tillage are other ways to manage soil OM and N (Pokharel et al., Citation2018).
Soil P level in grassland is relatively lower than in agricultural and agroforest land (Karki, Jhala, & Khanna, Citation2000; Kharal et al., Citation2018). The availability of P highly depends on the soil pH. However, since the soil pH is in the favorable range for crop plants in the study area, lower P levels in the grassland and agricultural land might be due to depletion of the soil P by continuous harvest/grazing or erosion. The replenishment of P either from chemical sources or from an organic source could serve as a viable option. Various inorganic sources of P such as super phosphates and compound phosphates are available, and organic sources such as bone phosphate, rock phosphate, and soft phosphate can be used. Because soil K level is moderate to high in all land use, balancing soil K in its current level through the use of various K fertilizers is a must.
The most deficient soil nutrients across all land use types were B and Zn. The lower level of soil B has a negative effect on the production of root crops, cole crops, wheat, and maize, whereas soil deficient in Zn is responsible for reduced rice production. Many reports suggest that B can be the primary nutrient limiting growth in agroforest, notably in exotic and native species of forest trees (Dell, Hardy, & Burgess, Citation2008; Stone, Citation1990; Wang, Chengquan, Zhiyong, Yongzhong, & Shu’ang, Citation2015). Zinc deficiency in rice causes stunted growth with leaf bronzing and brown blotches. Zinc deficiency is a major problem in calcareous soils and perennially wet soils where OM decomposition occurs in anaerobic condition leading to accumulation of bicarbonate (Lee, Wissuwa, Zamora, & Ismail, Citation2017). Studies have reported the importance of B in floral organs and male flower fertility, pollen tube development, and carbohydrate utilization. The lower B content can severely affect the grain development and can become a reason for grains with low starch content (Abdel-Motagally & El-Zohri, Citation2018; Blevins & Lukaszewski, Citation1998; Cheng & Rerkasem, Citation1993). Thus, enriching the soil B and Zn through the use of inorganic and organic sources is highly recommended. In summary, the following specific soil management options are recommended for the eastern part of the Dang district of Nepal:
Maintain soil pH in the agricultural lands with the use of legume-incorporated crop rotation (along with the use of acidifying inputs such as elemental S and ammonium sulphate for lands with strongly alkaline soils),
Incorporate locally available organic manure resources to increase the soil OM and N,
Add organic and inorganic sources of P, B, and Zn to increase P, B, and Zn levels in agricultural land and grassland,
Apply 1/4th of the recommended fertilizer dose to maintain K levels,
Modify the slash and burn system to a slash and residue retention system.
The abovementioned soil fertility management practices will not only be useful for the Nepalese soils but can be applied to the agricultural lands with alkaline soils. Increase in pH >7 greatly affects the availability of micronutrients such as Zn and B. Alkaline soil is a common problem in many places where the high mineral concentration of sodium carbonate, sodium bicarbonates or to agricultural fields irrigated with softened water containing a high concentration of sodium bicarbonate. Like Nepalese soil, alkaline soil is also a major problem to the rice-growing areas where surface water-logging is common. Extra supply of Zn and B is very important where the topsoil has been removed by erosion, or the soils are sandy with very low OM. While B deficiency may be rarely noticed, but this negatively charged ion easily leaches into the soil and is a concern in drought stress agricultural lands. Thus, proper management of micronutrient and macronutrients are necessary to replenish and conserve the degraded agricultural lands with high alkaline or soils with high erosion, in such a case study similar to Dang district of Nepal.
4. Conclusion
Our results reflect that the soil chemical properties of this study area were not in good status, and that the majority of nutrients were present in medium to low amounts, or even in amounts that were entirely very low for Zn. There is a need to add appropriate fertilizers (from organic and inorganic sources) N, P, B, and Zn to the soil to increase fertility status. The spatial distribution and mapping of the study area will aid farmers in making efficient management decisions based on their proper understanding of the conditions of existing soils under different land use. These results can be used to make recommendations for best management practices within the locality and to improve the livelihood of smallholder farmers.
Conflicts of Interest
The authors declare no conflict of interest.
Acknowledgements
The authors would like to thank Cube Info Company Pvt. Ltd., Kathmandu and Esteem Info Company Pvt. Ltd., Kathmandu, Nepal for providing access and assistance with the datasets. Also thanks to the National Land Use Project, Ministry of Land Reform and Management, Government of Nepal, for the support. The assistance of the residents of the study area who supported and provided valuable information is deeply appreciated.
Our sincere thanks to Ian Rogers, Bharat Sharma Acharya, and Nikita Bhusal for their technical support during the preparation of manuscript. Finally, we would like to thank two anonymous reviewers and an academic editor for their valuable comments and suggestions which helped us on improving this paper.
Additional information
Funding
Notes on contributors

Dinesh Panday
Dinesh Panday is a Doctoral Graduate Research Assistant in Soil and Water Sciences at the University of Nebraska-Lincoln, United States. His research mainly includes soil nutrient management and application of precision farming for the promotion of sustainable agriculture. He also has an interest in research on sustainable land use management and planning, digital soil mapping, geographical information systems, climate change and greenhouse gas emissions, and soil and water-related issues.
References
- Abdel-Motagally, F. M. F., & El-Zohri, M. (2018). Improvement of wheat yield grown under drought stress by boron foliar application at different growth stages. Journal of the Saudi Society of Agricultural Sciences, 17(2), 178–19.
- Acharya, B. K. 2008. Cultivation and use of ricebean: A case study of Dang District, Nepal [Online] (Thesis (M Phil)). University of Bergen, Norway. Retrieved from https://bora.uib.no/bitstream/1956/2768/1/Masterthesis_Acharya.pdf
- Akbas, F., Gunal, H., & Acir, N. (2017). Spatial variability of soil potassium and its relationship to land use and parent material. Soil & Water Research, 12, 4. doi:10.17221/32/2016-SWR
- Amatya, S. M., & Newman, S. M. (1993). Agroforestry in Nepal: Research and practice. Agrofor. Syst., 21, 215–222.
- Amatya, S. M., & Shrestha, K. R. (2002). Agroforestry. In FORSPA Publication (FAO) (Ed.), Nepal forestry handbook (pp. 297–306). Bangkok: FORSEA, FAO.
- Andersen, P. A. (2007). Review of micronutrient problems in the cultivated soil of Nepal: An issue with implications for agriculture and human health. Mountain Research and Development, 7(4), 331–335. doi:10.1659/mrd.0915
- Awasthi, K. D., Singh, B. R., & Sitaula, B. K. (2005). Profile carbon and nutrient levels and management effect on soil quality indicators in the Mardi watershed of Nepal. Acta Agriculturae Scandinavica Section B-Soil and Plant, 55(3), 192–204. doi:10.1080/09064710510029079
- Bajracharya, R. M., Sitaula, B. K., Sharma, S., & Jeng, A. (2007). Soil quality in the Nepalese context–An analytical review. International Journal of Ecology and Environmental Sciences, 33(2–3), 143–158.
- Berger, K. C., & Truog, E. (1939). Boron determination in soils and plants. Ind. Eng. Chem. Anal. Ed., 1(11), 540–545.
- Blevins, D. G., & Lukaszewski, K. M. (1998). Boron in plant structure and function. Annual Review of Plant Biology, 49(1), 481–500. doi:10.1146/annurev.arplant.49.1.481
- Boa, E., & Rob Harling, R. (2008). Starting plant health clinics in Nepal [Online]. Retrieved from https://assets.publishing.service.gov.uk/media/57a08bd2e5274a31e0000dc8/GPC-starting_plant_clinics_in_nepal_1_.pdf.
- Bremner, J. M., & Mulvaney, C. S. (1982). Nitrogen-total. Methods of soil analysis Part 2. Chemical and microbiological properties (pp. 595–624). Madison, WI: American Society of Agronomy, Inc. and Soil Science Society of America, Inc.
- Chalise, D., Kumar, L., Shriwastav, C. P., & Lamichhane, S. (2018). Spatial assessment of soil erosion in a hilly watershed of Western Nepal. Environ Earth Sci, 77, 685. doi:10.1007/s12665-018-7842-3
- Chaudhari, P. R., Dodha, V., Ahire, V. D., Ahire, M. C., & Saroj, M. (2013). Soil bulk density as related to soil texture, organic matter content and available total nutrients of Coimbatore soil”. International Journal of Scientific and Research Publications, 3(2), 1–8.
- Cheng, C., & Rerkasem, B. (1993). Effects of boron on pollen viability in wheat. Plant and Soil, 155(1), 313–315.
- Corwin, D. L., Kffka, S. R., Hopmans, J. W., Mori, Y., vanGroenigen, J. W., van Kessel, C., … Oster, J. D. (2003). Assessment and field-scale mapping of soil quality properties of a saline–Sodic soil. Geoderma, 114, 231–259.
- Cottenie, A., Verloo, M., Kiekens, L., Velghe, G., & Camerlynik, R. (1982). Chemical analysis of plant and soils Lab. Analysis Agroch Factor Agriculture, 63. State University Gent, Belgium.
- DeBano, L. F. (1991). The effect of fire on soil properties. In A. E. Harvey & L. F. Neuenschwander (Eds.) compilers, Proceedings-management and productivity of western-montane forest soils (Vol. 280, pp. 151–156). 1990 April 10-12Boise, ID. Gen. Tech. Rep. INT-280. Ogden, UT: US Department of Agriculture, Forest Service, Intermountain Research Station.
- Dell, B., Hardy, G., & Burgess, T. (2008). Health and nutrition of plantation eucalypts in Asia. Southern Forests: A Journal of Forest Science, 70, 131–138. doi:10.2989/SOUTH.FOR.2008.70.2.8.536
- Duguma, L. A., Hager, H., & Sieghardt, M. (2010). Effects of land use types on soil chemical properties in smallholder farmers of central highland Ethiopia. Ekológia (Bratislava), 29(1), 1–14.
- Ghimire, R., & Bista, P. (2016). Crop diversification improves pH in acidic soils. J. Crop Improv., 30(6), 657–667. doi:10.1080/15427528.2016.1219894
- Grismer, M. (1990). Leaching fraction, soil salinity, and drainage efficiency. California Agriculture, 44(6), 24–26.
- Hălbac-Cotoară-Zamfir, R., Keesstra, S., & Kalantari, Z. (2019). The impact of political, socio-economic and cultural factors on implementing environment friendly techniques for sustainable land management and climate change mitigation in Romania. Science of the Total Environment, 654, 418–429. doi:10.1016/j.scitotenv.2018.11.160
- He, J., Kuhn, N. J., Zhang, X. M., Zhang, X. R., & Li, H. W. (2009). Effects of 10 years of conservation tillage on soil properties and productivity in the farming–Pastoral ecotone of Inner Mongolia, China. Soil Use and Management, 25(2), 201–209. doi:10.1111/sum.2009.25.issue-2
- Hollis, J. M., Jones, R. J., Marshall, C. J., Holden, A., van de Veen, J. R., & Montanarella, L. (2006). SPADE-2: the soil profile analytical database for EUROPE.
- Houba, V. J. G., Van der Lee, J. J., Novozamsky, I., & Walinga, I. (1989). Soil and plant analysis, a series of syllabi, part 5, soil analysis procedures. Wageningen, Netherlands: Wageningen Agricultural University.
- IPNI. (2010). Soil pH and the availability of plant nutrients. International Plant Nutrition Institute, 2 [Online] Retrieved from http://www.ipni.net/ipniweb/pnt.nsf/0/97c1b6659f3405a28525777b0046bcb9/$FILE/Plant%20Nutrition%20Today%20Fall%202010%202.pdf.
- Jafarian, J. Z., Shabanzadeh, S., Kavian, A., & Shokri, M. (2014). Spatial variability of soil features affected by landuse type using geostatistics. Ecopersia, 2(3), 667–679.
- Journel, A. G., & Huijbregts, C. H. J. (1978). Mining geostatistics. London: Academic Press.
- Karki, J. B., Jhala, Y. V., & Khanna, P. P. (2000). Grazing lawns in Terai Grasslands, Royal Bardia National Park, Nepal 1. Biotropica, 32(3), 423–429.
- Khanal, Y., Sharma, R. P., & Upadhyaya, C. P. (2010). Soil and vegetation carbon pools in two community forests of Palpa district. Nepal. Banko Janakari, 20(2), 34–40. doi:10.3126/banko.v20i2.4800
- Kharal, S., Khanal, B. R., & Panday, D. (2018). Assessment of soil fertility under different land-use systems in Dhading District of Nepal. Soil Syst, 2, 57.
- Kilic, K., Kilic, S., & Kocyigit, R. (2012). Assessment of spatial variability of soil properties in areas under different land use. Bulg. J. Agric. Sci., 18, 722–732.
- Lechisa, T., Achalu, C., & Alemayehu, A. (2014). Dynamics of soil fertility as influenced by different land use systems and soil depth in West Showa Zone, Gindeberet District, Ethiopia. Agriculture, Forestry and Fisheries, 3, 489–494. doi:10.11648/j.aff.20140306.18
- Lee, J. S., Wissuwa, M., Zamora, O. B., & Ismail, A. M. (2017). Biochemical indicators of root damage in rice (Oryza sativa) genotypes under zinc deficiency stress. Journal of Plant Research, 130(6), 1071–1077.
- Liang, J., & Karamanos, R. E. (1993). DTPA-extractable Fe, Mn, Cu and Zn. In Soil sampling and methods of analysis (pp. 87–90). Boca Raton, FL: Lewis Publisher.
- Lichter, J. M., & Costello, L. R. (1994). An evaluation of volume excavation and core sampling techniques for measuring soil bulk density. Journal of Arboriculture, 20, 160.
- Mbah, C. N. (2008). Contributions of organic amendments to exchangeable potassium percent and soil nitrate concentration in an Ultisol and their effect on maize (Zea mays L) grain yield. Agro-Science Journal of Tropical Agriculture, Food, Environment and Extension, 7(3), 206–210.
- McBratney, A. B., & Pringle, M. J. (1997). Spatial variability in soil – Implications for precision agriculture. In J. V. Stafford (eds.) Precision Agriculture 1997, Proceedings of the 1st European Conference on Precision Agriculture (p. 639–643), Oxford, UK. 3.
- MFD. (2018, August 18). Meteorological forecasting division. government of nepal, department of hydrology and meteorology, Nepal [ Online] Retrieved from http://www.mfd.gov.np/city?id=27.
- Miheretu, B. A., & Yimer, A. A. (2018). Spatial variability of selected soil properties in relation to land use and slope position in Gelana sub-watershed, Northern highlands of Ethiopia. Physical Geography, 39(3), 230–245.
- Mikkelsen, R. L. (2007). Managing potassium for organic crop production. HortTechnology, 17(4), 455–460.
- MOAD. 2017. Statistical information on nepalese agriculture 2015/16. government of nepal, ministry of agricultural development, Singhdurbar, Kathmandu, Nepal [ Online]. Retrieved from http://moad.gov.np/public/uploads/1142453195-STATISTIC%20AGRICULTURE%20BOOK_2016.pdf
- Moraes, J. F. L., Volkoff, B., Cerri, C. C., & Bernoux, M. (1996). Soil properties under Amazon forest and changes due to pasture installation in Rondonia, Brazil. Geoderma, 70(1), 63–81.
- Mouazen, A. M., Dumont, K., Maertens, K., & Ramon, H. (2003). Two dimensional prediction of spatial variation in topsoil compaction of a sandy loam field based on measured horizontal force of compaction sensor, cutting depth and moisture content. Soil Till Res, 74, 91–102.
- Nascente, A. S., Yuncong, L., & Carlos, A. C. C. (2015). Soil aggregation, organic carbon concentration, and soil bulk density as affected by cover crop species in a no-tillage system. Revista Brasileira de Ciência do Solo, 39(3), 871–879.
- Negasa, T., Ketema, H., Legesse, A., Sisay, M., & Temesgen, H. (2017). Variation in soil properties under different land use types managed by smallholder farmers along the toposequence in southern Ethiopia. Geoderma, 290, 40–50.
- NLUP. (2015). National land use policy. government of nepal, ministry of land reform and management, Singhdurbar, Kathmandu, Nepal [ Online]. Retrieved from http://www.molrm.gov.np/downloadfile/land%20use%20policy__2015_1502613079.pdf.
- Olsen, S. R., Sommers, L. E., & Page, A. L. (1982). Methods of soil analysis. Part 2. Methods of Soil Analysis, 2(9), 403–430.
- Oyetola, S. O., & Philip, A. (2014). Land use effects on soil properties in federal capital territory of Nigeria. Journal of Science, 4(12), 705–711.
- Panday, D. (2012). Adapting climate change in agriculture: The sustainable way in Nepalese context. Hydro Nepal J. Water Energy Environ., 11, 91–94.
- Panday, D., Maharjan, B., Chalise, D., Shrestha, R. K., & Twanabasu, B. (2018). Digital soil mapping in the Bara District of Nepal using Kriging tool in ArcGIS. PloS one, 13(10), e0206350. doi:10.1371/journal.pone.0206350
- Pandey, S., Bhatta, N. P., Paudel, P., Pariyar, R., Maskey, K. H., Khadka, J., … Panday, D. (2018). Improving fertilizer recommendations for Nepalese farmers with the help of soil-testing mobile van. J. Crop Improv., 32, 19–32.
- Pokharel, D., Jha, R. K., Tiwari, T. P., Gathala, M. K., Shrestha, H. K., & Panday, D. (2018). Is conservation agriculture a potential option for cereal-based sustainable farming system in the eastern indo-gangetic plains of nepal? Cogent Food & Agriculture. 4(1):1557582. doi:10.1080/23311932.2018.1557582
- Poudel, N. R., Fuwa, N., & Otsuka, K. (2013). From deforestation to reforestation: the evolution of community forest management in the Dang District of Nepal. In S. Holden, K. Otsuka, & K. Deininger (Eds.), Land tenure reform in asia and africa: impacts on poverty and natural resource management (pp. 213–232). London and New York: Palgrave Macmillan.
- Santra, P., Chopra, U. K., & Chakraborty, D. (2008). Spatial variability of soil properties and its application in predicting surface map of hydraulic parameters in an agricultural farm. In Current science (pp. 937–945). Bengaluru, India: Current Science Association.
- Shah, P. B., & Schreier, H. (1995). Maintaining soil fertility in agriculture and forestry. In H. Schreier, P. B. Shah, & S. Brown (Eds.), challenges in mountain resource management in Nepal: Processes, trends and dynamics in middle mountain watersheds. Workshop proceedings. Kathmandu, Nepal (pp. 171–182). Ottawa, ON: International Development Research Centre.
- Sherchan, D. B., & Gurung, B. D. (1995, April 10-12). An integrated nutrient management system for sustaining soil fertility: Opportunities and strategy for soil fertility research in the hills. Challenges in mountain resource Management in Nepal. Processes, trends and dynamics in middle mountain watersheds. In H. Schreier, P. B. Shah, & S. Brown (Eds), Proceedings of a Workshop held in Kathmandu, Nepal (p. 50–62), Kathmandu: ICIMOD/IDRC/UBC.
- Shrestha, R., Siddique, K. H. M., Turner, N. C., Turner, D. W., & Berger, J. D. (2005). Growth and seed yield of lentil (Lens culinaris Medikus) genotypes of West Asian and South Asian origin and crossbreds between the two under rainfed conditions in Nepal. Australian Journal of Agricultural Research, 56(9), 971–981.
- Simard, R. R. (1993). Ammonium acetate-extractable elements. In Soil sampling and methods of analysis (pp. 39–42). Boca Raton, FL: Lewis Publisher.
- Spurgeon, D. J., Keith, A. M., Schmidt, O., Lammertsma, D. R., & Faber, J. H. (2013). Land-use and land-management change: Relationships with earthworm and fungi communities and soil structural properties. BMC Ecology, 13(1), 46.
- Srivastava, S. P., Johansen, C., Neupane, R. K., & Joshi, M. 2005. Severe boron deficiency limiting grain legumes in the inner Terai of Nepal. In Proceedings of an International Workshop: Micronutrients in South and South East Asia, 8-11 September, 2004, Kathmandu, Nepal. ICIMOD. Nepal. 67–76.
- Stone, E. L. (1990). Boron deficiency and excess in forest trees: A review. Forest Ecology and Management, 37(1–3), 49–75.
- Subedi, T. B., & Jaishy, S. N. 2000. Eco-friendly soils management for sustainable agriculture. Agriculture and environment millennium issue, His Majesty’s government, Ministry of Agriculture and Co-operatives, Singh Durbar, Kathmandu, Nepal.
- Suttie, J. M., Reynolds, S. G., & Batello, C. 2005. Grasslands of the world [ Online]. Plant Production and Protection Series No. 34, Rome, Italy: Food and Agriculture Organization of the United States. Retrieved from http://www.fao.org/docrep/008/y8344e/y8344e05.htm
- USDA. (1999). United States department of agriculture, natural resources conservation service: Soil taxonomy- a basic system of soil classification for making and interpreting soil surveys. Agriculture handbook number 436 [ Online]. Retrieved from https://www.nrcs.usda.gov/Internet/FSE_DOCUMENTS/nrcs142p2_051232.pdf.
- Uzoho, B. U., & Ekeh, C. (2014). Potassium status of soils in relation to land use types in Ngor-Okpala, Southeastern Nigeria. Journal of Natural Sciences Research, 4(6), 105–114.
- Wang, J., Fu, B., Qiu, Y., & Chen, L. (2001). Soil nutrients in relation to land use and landscape position in the semi-arid small catchment on the loess plateau in China. Journal of Arid Environments, 48(4), 537–550.
- Wang, N., Chengquan, Y., Zhiyong, P., Yongzhong, L., & Shu’ang, P. (2015). Boron deficiency in woody plants: Various responses and tolerance mechanisms. Frontiers in Plant Science, 6, 916.
- Wei, J. B., Xiao, D. N., Zeng, H., & Fu, Y. K. (2007). Spatial variability of soil properties in relation to land use and topography in a typical small watershed of the black soil region, northeast, China. Environmental Geologyl. doi:10.1007/s00254-007-0773-z
- Wei, X. R., Shao, M. G., Fu, X. L., Horton, R., Li, Y., & Zhang, X. C. (2009). Distribution of soil C, N and P in three adjacent land use patterns in the northern Loess Plateau, China. Biogeochemistry, 96, 149–162.
- Whisler, K. M., Rowe, H. I., & Dukes, J. S. (2016). Relationships among land use, soil texture, species richness, and soil carbon in Midwestern tallgrass prairie, CRP and crop lands. Agriculture, Ecosystems & Environment, 216, 237–246.
- Woldeamlak, B., & Stroosnijder, L. (2003). Effects of agroecological land use succession on soil properties in Chemoga watershed, Blue Nile basin, Ethiopia. Geoderma, 111, 85–98.
- Yao, X., Fu, B., Lu, Y., Sun, F., Wang, S., & Liu, M. (2013). Comparison of four spatial interpolation methods for estimating soil moisture in a complex terrain catchment. PloS one, 8(1), e54660. doi:10.1371/journal.pone.0054660
- Yimer, F., Ledin, S., & Abdelkadir, A. (2006). Soil property variations in relation to topographic aspect and vegetation community in the south-eastern highlands of Ethiopia. Forest Ecology and Management, 232(1–3), 90–99.
- Zhang, G., Zhang, P., Peng, S., Chen, Y., & Cao, Y. (2017). The coupling of leaf, litter, and soil nutrients in warm temperate forests in northwestern China. In Scientific reports (p. 11754). Basingstoke, UK: Springer Nature Publishing.