
 ?Mathematical formulae have been encoded as MathML and are displayed in this HTML version using MathJax in order to improve their display. Uncheck the box to turn MathJax off. This feature requires Javascript. Click on a formula to zoom.
Abstract
Considerable area of land is becoming unproductive every year because of salinity and sodicity in Lowlands of Ethiopia. For sound land use and irrigation water management, it is a paramount important to know the salinity/sodicity status of soils and irrigation water quality. Therefore, the study was conducted to characterize and classify the salinity and sodicity hazards of major irrigated areas and irrigation water sources in Northern Ethiopia. Irrigation water samples were also collected from both sources used for irrigation in the study area. Moreover, representative soil profiles were also opened and soil samples were collected and analyzed. The Shwarobit river and the groundwater sources were found to be in the medium (C2) (341.7 µS/cm) and high (C 3) (1452.9 µS/cm) salinity hazards, respectively. With regards to the sodicity hazard criteria, both water sources were found to be low (S1). According to the US Salinity Laboratory Staff criteria, soils irrigated by the Shwarobit River met the criteria to be classified as saline soils. However, except the surface layer of the profile the soils irrigated by a combination of shwarobit River and groundwater sources met the criteria to be classified as a saline-sodic soils. Therefore, according to the water and soil analysis results, there will be a potential danger of sodicity and actual salinity development in the intended irrigation scheme. Thus, selection of crop type and proper irrigation methods should be designed for sustainability of soil productivity in the study area.
Public interest statement
The local communities in shwarobit irrigation scheme of Amhara Region, Ethiopia, have been engaged in traditional and modern irrigation practices for more than 30 years. However, as the area is characterized by arid and semi-arid climatic conditions, there is a possibility of soil salinity/alkalinity development. Knowing the status of soil salinity and providing best management options to the local community are found to be very important for sustainable irrigation management. Accordingly, soil and water samples were collected from the irrigated area and irrigation water sources, respectively. And the samples were analyzed for salinity/alkalinity indicators following the standard laboratory procedure. The study result shows that salinity hazard is existed in the irrigated land and is building up gradually with the expansion of irrigation. Hence, the local community in collaboration with the local government needs to monitor and manage soil salinity of the irrigation scheme in order to sustain the production and productivity of the area.
Competing Interests
The author declares no competing interests.
1. Introduction
1.1. Background and justification
Agricultural land is an important component of environment and natural landscape that includes the results of past and present human activities. The quality of soil, as a major sub-system of agricultural land, is changing over time as a result of changes in its environment or management practice (EL-Kader, Mohamedin, & Ahmed, Citation2006). Agriculture faces various environmental stresses like extreme temperature, soil salinity, drought and flood that affect the production of crops in dry land areas. Among these, soil salinity is one of the most devastating environmental stresses happened due to mismanagement of irrigation and aridity, which causes major reductions in cultivated land size, crop productivity and quality all over the world (Shahbaz & Ashraf, Citation2013).
In Ethiopia, the naturally salt-affected areas are normally found in the arid and semiarid lowlands and in Rift valley areas that are characterized by higher evapotranspiration rates in relation to precipitation. The arid and semi-arid agro-ecologies which account for nearly 50% of the country’s land area are regarded as marginal environments for crop production mainly due to soil and water salinity. Low levels of annual rainfall and high daily temperatures have led to high water evaporation rates and consequently contributed to high concentrations of soluble salts in these lowland areas (Sileshi, Kibebew, & Amanuel, Citation2015). In Ethiopia, about 44 million ha (36% of the total land area) is potentially susceptible to salinity problems of which 11 million ha have already been affected by different levels of salinity and mainly concentrated in the Rift valley. Ethiopia ranked as 7th in the world in terms of percentage of the total land area affected with salinity (Sileshi et al., Citation2015). Most of the export crops such as cotton, sugarcane, citrus fruits, banana and vegetables are being produced in the Rift valley. The development of large-scale irrigation projects in Rift valley in the absence of proper drainage systems for salinity control has resulted in increasing severity and rapid expansion of soil salinity and sodicity problems leading to complete loss of land for crop cultivation in these areas (Fantaw, Citation2007).
The soil salinity problems in Ethiopia stems from use of poor quality water coupled with the intensive use of soils for irrigation, poor on-farm water management practices and lack of adequate drainage facilities (Gebremeskel et al., Citation2018). Restoration of salt-affected lands into productive lands and protection of newly developed areas from the spread of salinity through improved irrigation and crop management is therefore of paramount importance. In the high salinity areas where growth of normal field crops is restricted, use of bioremediation methods including planting halophytic forages could bring these soils back into production.
Some irrigated lands face a problem of salinization due to mismanagement of irrigation system and poor irrigation water quality. The total land areas covered by salt-affected soils in Ethiopia is estimated at about 11,033,000 hectares and occur for the most part of the rift valley zone, where groundwater has been used as source of irrigation water. As a result, nowadays, soil salinity has become an important problem in irrigated soils of Ethiopia (Seid & Genenew, Citation2013). The greatest concentration of water bodies in Ethiopia is located in the Rift Valley, and thus there is a tendency to consider use of these waters for irrigation as a solution to alleviate the problem of the very unreliable rain-fed agriculture and to the determinant for agricultural development and self-sufficiency with respect to food production (Gebre-mariam, Citation2003).
Information about soil salinity/sodicity and irrigation water quality status plays a vital role for proper management of agricultural fields and in enhancing production and productivity of the agricultural lands. However, the salinity status of soils and irrigation water quality of the study area has never been characterized and documented for designing intervention scenarios. As a result, the farming communities do not have sufficient information regarding the status of soil salinity/sodicity, irrigation water quality and the causes of the water logged areas. In response to this lack of information, this study was conducted to attain the following objectives.
To characterize and classify the salt-affected soils in the study area to the standard classes of salt-affected soils
To assess the quality of the water used for irrigation and provide baseline information about the soil and water resources
2. Materials and methods
2.1. General description of the study area
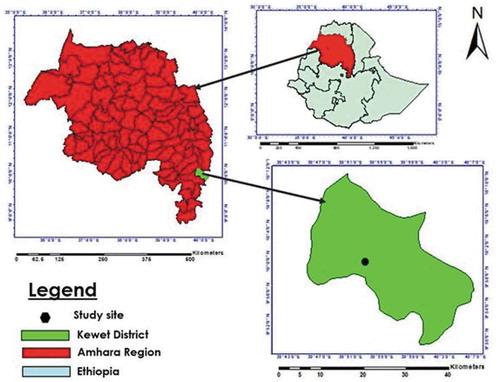
The study was conducted during the year 2016 in Kewet District, located in the North Shewa Zone with altitude ranging from 1047 to 3164 m.a.s.l. The study area receives an average annual rainfall 865 mm while mean annual temperature is 29°C. The dominant soil types study area are Vertisols, Cambisols, Regosols and Lithosols.
2.2. Methods
2.2.1. Site selection, soil sampling and analysis
Field observation and general visual reconnaissance survey of the area was carried out to determine as to which specific irrigation scheme should be selected as representative sites. Representative soil profile sampling sites were selected based on soil color, drainage property of the specific location, source of irrigation water and relative position in the slope of the study area from which representative profile composite soil samples were collected. Following the selection of the specific soil profile sampling sites, a fresh soil profile of standard dimension was opened on both sampling site and profile composite samples were collected from areas irrigated by the Shwarobit river water and in areas irrigated by a combination of this water with groundwater.
The soil samples were air-dried ground and passed through 2 mm sieve for further analysis. Finally, the Soil Samples were subjected to various soil physicochemical analyses (texture, balk density, particle density, pH, electrical conductivity, cation exchange capacity, exchangeable cations, soluble cations and anoins).
Particle size distribution was analyzed by the Bouyoucos hydrometer method using sodium hexametaphosphate as dispersing agent as described in Sertsu and Bekele (Citation2000). Soil bulk density was determined by taking undisturbed core samples as described in Sertsu and Bekele (Citation2000). Soil particle density was assumed to be 2.65 gm/cm3. Finally, total soil porosity was estimated from the values of bulk density (ρb) and particle density (ρs)
Soil reaction (pH) was evaluated potentiometrically in the supernatant suspension of a 1:2.5 soil to water ratio using pH meter. The ECe of the soils was evaluated on the filtrate of saturated soil paste extract obtained by vacuum suction using an electrical conductivity meter (Okalebo, Gathua, & Woomer, Citation2002) and adjusted to ECe at 25°C. Basic exchangeable cations (Na, Ca, Mg and K) of the soils was extracted by excess ammonium acetate (1N CH3COONH4 at pH 7.0) solution. Following their extraction, exchangeable Ca and Mg was determined using the EDTA method and exchangeable Na and K was determined by flame photometer (RDP, Citation1986). Cation exchange capacity (CEC) of the soil was analyzed from distillation of the ammonium-saturated samples following the modified kjeldahl procedure (Hesse, Citation1971). Finally, PBS and ESP were calculated as the sum of exchangeable bases and exchangeable sodium to the CEC of the soil, respectively, as:
Soluble cations (Na+, Ca2+, Mg2+ and K+) and anions (Cl−, SO42-, HCO3− and CO3 2-) were measured from saturated soil paste extracts following the methods developed by the US Salinity Laboratory Staff [USSLS] (Citation1954). Determination of Ca2+ and Mg2+ was made by EDTA while that of Na+ and K+ was read by flame photometer. The HCO3− and CO32- ions were determined by titration of the extract with sulfuric acid (H2SO4), and the concentration of sulphate (SO42-) in soils was determined by precipitation as barium sulfate (BaSO4). Chloride will be determined by titration of the extract with 0.1N AgNO3. Sodium adsorption ratio of the soil solution (SARsw) was calculated from the concentrations of soluble Na+, Ca2+and Mg2+as:
Finally, the soils were classified into different salt-affected soil classes according to the criteria set by the US Salinity Laboratory Staff [USSLS] (Citation1954).
2.2.1. Irrigation water sampling and analysis
Irrigation water samples were collected from both sources used for irrigation purpose in the area. Each of these irrigation water samples was prepared from sub-samples collected at five different time intervals so that representative water samples could be obtained. The irrigation water samples were collected in 1 day. The collection and handling of the irrigation water samples was done in accordance with the procedures outlined by the US Salinity Laboratory Staff [USSLS] (Citation1954). The water samples collected from different sources were analyzed in the laboratory for different parameters required to assess the quality of irrigation water. Accordingly, the irrigation water samples were analyzed for its pH, Ec, dissolved cations (Ca2+ Mg2+ Na+ and K+) and anions (Cl−, SO42-, HCO3− and CO32-).
The pH of water was determined using pH meter and electrical conductivity was measured using an electrical conductivity meter. The cations Na+ and K+ were determined directly from the water samples using flame photometer whereas Ca2+ and Mg2+ was determined using EDTA method. The CO32- and HCO3− were determined by titrating with sulfuric acid (H2SO4) and the concentration of sulfate (SO42-) in water was determined by precipitation as barium sulfate (BaSO4) (gravimetric method). Chloride will be determined by silver nitrate titrimetric method.
The SAR and residual sodium carbonate (RSC) of the water sources was computed from the concentrations and relative proportions of the different chemical parameters analyzed in the laboratory. Sodium adsorption ratio of irrigation water (SARiw) was calculated from the concentrations of soluble Na+, Ca2+ and Mg2+ in meq/l as follows:
Similarly, RSC content of the irrigation water samples was calculated for classification from the concentrations of Ca2+, Mg2+, HCO3− and CO32- ions in meq/l as follows:
Finally, the quality and suitability for irrigation water sources represented by the samples was determined based on the laboratory analysis results and the values computed from the concentrations of the different chemical parameters and/or their combinations as per the criteria established by the US Salinity Laboratory Staff [USSLS] (Citation1954).
3. Results and discussion
3.1. Chemical properties of the irrigation water sources
Irrigation water samples were taken from the shwarobit River and groundwater sources and analyzed for their chemical composition (Table ). The water quality expressed by pH value varied from 8.0 (moderately alkaline) for shwarobit River water to 8.9 (strongly alkaline) for the groundwater. The alkaline reactions of these water sources are the reflections of the relatively higher concentrations of bicarbonates.
Table 1. Chemical characteristics of irrigation water from groundwater source
Among the dissolved cations, Ca2+followed by Mg2+ and among the anions Cl− followed by HCO3− were the highest both in the Shwarobit River and groundwater sources (Table ). The Shwarobit river and the groundwater sources were found to be in the medium (C2) (341.7 µS/cm) and high (C 3) (1452.9 µS/cm) salinity hazards, respectively, based on the classification of US Salinity Laboratory Staff [USSLS] (Citation1954).
Table 5. Physical & Exchangeable chemical properties of the soils irrigated by a combination of shwarobit River and groundwater sources
Both irrigation water sources investigated were found to be safe with regards to RSC hazard for irrigating crops. Similarly, with regards to the sodicity hazard criteria of the US Salinity Laboratory Staff [USSLS] (Citation1954) classification, both the Shwarobit river and groundwater sources were found to be low (S1) in their sodicity hazards for irrigation (Table ).
Table 2. Salinity, sodicity and RSC hazard classes of the investigated irrigation water sources
3.2. Selected soil physical and exchangeable cation properties of the soils irrigated by Shiwa-robit River
The selected physical property data of the soil profile opened at the areas irrigated by water from Shwarobit River (Profile 1) are presented in Table . As it was seen from profile description of soils, the soil depth for the sampling point was greater than 150 cm indicating that the soils represented by this profile could be considered as deep soils. Analysis of particle size showed that the textural class of the whole layers throughout the profile was clay. The bulk density values of the layers in the profile varied consistently with depth ranging from 1.38 g cm−3 at the surface layer to 1.52 g cm−3 at the bottom layer (Table ). These values are closer to the average range of bulk density for mineral soils which is 1.30–1.40 g cm−3 as indicated by Bohn, McNeal, and O’Conner (Citation2001). The relatively high bulk density values in the layers below the plow depth (0–30) could be due to reduced root penetration and compaction caused by the weight of the overlying soil material. Brady and Weil (Citation2002a), reported a consistent increase in bulk density with soil depth due to decreasing SOM in the soil profile. Bulk density of a soil increases with profile depth, due to changes in SOM, porosity and compaction (Hussein, Citation2002; Pravin, Dodha, Vidya, Manab, & Saroj, Citation2013).
The relatively higher value of total porosity in the surface horizons could be due to the effect of management, penetration of crop roots that loosen the soil as well as comparatively higher SOM content compared to subsurface layers of the profile. This is in line with the finding of Pravin et al. (Citation2013) who reported decrease in total porosity with soil depth as a result of increasing compaction (BD) and decreasing of rooting effect. Total porosity decreasing with an increase in depth is apparently due to increasing bulk density with depth (Teshome & Kibret, Citation2009).
The data on the exchangeable chemical properties of the soils irrigated by Shwarobit River presented in Table . Exchangeable calcium (Ca) followed by exchangeable magnesium (Mg) were the dominant basic cations in the exchange complex whereas; the monovalent cations particularly K occupied a relatively small proportion of the soil exchange complex sites in all layers of the profile (Table ). Exchangeable calcium and magnesium together occupied of 82.1–85.5% of the exchange complex in the different layers of this profile. Zewdie (Citation2001) reported higher exchangeable Ca and Mg in the surface soil that contribute to higher soil PBS, particularly in dry land soil. Higher contents of exchangeable Ca and Mg relative to other basic cation were also reported for soils of Bichena and Woreta areas by Yihenew (Citation2002). In general, throughout the whole layers of this profile, the magnitude of cations was in the order of Ca > Mg > Na > K. Hagos, Kibret, and Gebrekidan (Citation2015) reported the same result for the soils of Kabe Sub-watershed in South Wollo Zone, Northeastern Ethiopia.
Table 3. Physical &Exchangeable chemical properties of the soils irrigated by Shwarobit River
Cation exchange capacities (CEC) of the soil increased inconsistently with increasing depth. Generally, the CEC value ranged between 52.12 meq/100g in the upper layer of the profile and 62.27 meq/100g at the bottom layer of the soil profile (Table ). In contrast to the current finding, Ayalew and Beyene (Citation2012) also reported that CEC decreased with depth in soil profiles of Angacha District in Southern Ethiopia. According to the rating established by Hazelton and Murphy (Citation2007), the CEC value of the whole layers of the profile is rated as very high. Zenebe, Gebresamuel, and Girma (Citation2015) also reported that the soils of Raya valley was rated as very high with respect to CEC. Cation exchange capacity of the soil were higher in the surface than in subsurface horizons which could be due to the strong association between organic carbon and CEC (Ali, Esayas, & Beyene, Citation2010). The percentage base saturation values showed consistently an increasing trend with increasing depth of the profile suggesting the existence of high leaching processes of the basic cations downward the profile. Chimdi, Gebrekidan, Kibret, and Tadesse (Citation2012) also reported similar trends of PBS with exchangeable Ca and Mg, since factors that affect these soil attributes also affect the PBS.
The exchangeable sodium percentage ranges from a minimum of 9.30% at the surface layer of the profile to a maximum of 14.98% at the bottom (90−120) of the profile as shown in Table . According to the US Salinity Laboratory Staff [USSLS] (Citation1954), the soils represented by this profile met the criteria to be classified as a non-sodic soil because the ESP was less than 15%. However, the soils irrigated by the Shwarobit River water could be regarded as potentially sodic soil in general and sodic soil for certain sodium-sensitive crop plants in particular.
3.3. Soluble soil chemical characteristics of soils irrigated by Shwarobit River
The pH of the soils irrigated by Shwarobit River (Profile 1) increased consistently with profile depth from 8.6 at the surface layer to 9.3 at the bottom layer of the profile (Table ). The slight increment in pHe with increasing soil profile depth may be due to increased values of basic cations at the subsurface layers resulted to the downward movement of these constituents from the surface to the subsurface layers within in the soil profile (Giday, Gibrekidan, & Berhe, Citation2015). Similarly, the ECe of the soils increased inconsistently with an increase in depth which could be dictated by the washing down of the ions applied by irrigation water. Unlike ECe Soluble Na+ content of the soils increased consistently with an increase in depth. Sodium was the dominant soluble cation followed by calcium, magnesium and potassium in all horizons of the profile. Similarly, among the anions, Cl− was dominant throughout the profile followed by SO42-. Both of these anions increased with depth consistently in line with ECe and soluble Na. Yadav, Irfan, Ahmad, and Hayat (Citation2011), revealed that the common soluble cations associated with soil salinity in the soil solution are Na+, Ca2+ and Mg2+ while, the common anions are Cl−, SO42- and HCO3−.
The concentration of the sum of all anions was high in the bottom layer of the profile than in the overlying layers (Table ). In all the profiles, CO32- was absent and the sum of soluble Ca2+ and Mg2+ exceeded the sum of HCO3− and CO32-. As a result, the determination of residual sodium carbonate (RSC) was not found to be essential. The highest concentrations of all the soluble cations were found at the bottom (120–150+ cm) layer (Table ). The explanation advanced for the increasing salt concentrations (ECe) with depth could be used to describe the increasing concentrations of the sum of soluble cations down the profile. Among the cations and anions, Na+, Ca2+, SO42- and Cl− were present in higher concentrations throughout the profile. Hence, chloride and sulphate salts of sodium and calcium were the major salts contributing to the salinity development in the soils irrigated by Shwarobit River.
Table 4. Some soluble chemical properties of the soils irrigated by Shwarobit River
The highest SAR value of 9.95 recorded was for the bottom (120–150+ cm) layer of the profile followed by the SAR value of 7.63 for the layer (63–106 cm) depths of the soil profile. The values of SAR also increased consistently with profile depth (Table ). According to Tekalign (Citation1991), soil pH (H2O) values recorded in the whole layers/depth of the profile qualify for strongly alkaline soil reaction.
According to the criteria developed by the US Salinity Laboratory Staff [USSLS] (Citation1954), soils containing an ECe (at 25°C) of greater than 4 dS/m and an ESP of less than 15% are considered as saline. Hence, based on this classification system, the soils irrigated by Shwarobit River met the requirements to be grouped under saline soils. Therefore, remedial measures (leaching removal of salts from the root zone) and proper management of irrigation and drainage is required to reduce the salinity problem.
3.4. Selected physical and exchangeable chemical properties of the soils irrigated by a combination of Shwarobit River and groundwater sources
Generally, analysis of particle size showed that the textural class of the whole layers throughout the profile was clay. Similar to the soils represented by Profile 1, the highest soil bulk density (1.48 g cm−3) and the lowest total porosity (49.8%) were observed at the bottom horizon of the soil (Table ). These highest soil bulk density and lowest porosity at the bottom layer of the soil profile may be attributed to the lower soil organic matter content, very low clay content and the weight of the soil in the overlying soil layers as reported by Negassa (Citation2001). The bulk density observed in this profile was also similar to the average values (1.34–1.40 g cm−3) commonly quoted for mineral soils world-wide (Brady and Weil Citation2002a).
The exchangeable chemical properties of the soils irrigated by groundwater source as determined on the representative soil profile (Profile 2) are given in Table . Among the exchangeable cations, exchangeable Ca was dominant throughout the whole layers of the profile followed by exchangeable Mg. As indicated in Table , the concentration of exchangeable K was the lowest among exchangeable cations throughout the profile depth. Exchangeable Mg was observed to decrease linearly with increasing depth from 13.12 to 16.78 meq/100 g. Cation exchange capacities (CEC) of the soil increased inconsistently with increasing depth. Generally, the CEC value ranged between 54.58 meq/100g in the upper layer of the profile and 66.15 meq/100g at the 4th layer (90–120 cm) layer of the soil profile (Table ). According to the rating established by Landon (1991), the CEC value of the whole layers of the profile rated as very high. Percentage base saturation (PBS) ranged between 89.48 and 99.92 while ESP ranged between 12.46% and 20.93%. According to the US Salinity Laboratory Staff [USSLS] (Citation1954) criteria for classification, except the surface layer of the profile the soils irrigated by a combination of Shwarobit River and groundwater sources (Profile 2) met the criteria to be classified as a saline sodic soil because the ECe at 25°C was greater than 4 dS/m, the ESP was greater than 15%.
3.5. Soluble chemical properties of soils irrigated by a combination of shwarobit river and groundwater sources
The data of soluble chemical properties of the soils irrigated by groundwater as determined on the representative soil profile (Profile 2) are presented in Table . As it is indicated in the Table, the soil was strongly alkaline throughout the depth of the profile. ECe increased consistently with increasing soil profile depth, where the highest ECe reading of 6.56 dS/m was obtained at the bottom layer of the profile (Table ). Such a pattern is explained by the downward movement of salts in the upper layers by means of irrigation water. Among the soluble cations, Na+ was the dominant one which was consistently increasing with increasing profile depth followed by Ca2+. On the other hand, soluble Mg2+ and K+ were relatively low in their concentrations. Sodium adsorption ratio also followed the pattern of soluble Na+ with the values of 7.36 at the surface layer and 11.42 at the bottom layer of the profile (Table ).
Out of the soluble anions, Cl− was the dominant followed by SO42- in all layers of the profile. Based on the data shown in Table , the comparative order of dominance in the soil solution was Na+ followed by Ca2+ for the cations and Cl− followed by SO42- for the anions. Hence, the dominant salts in the soil were chloride and sulphate salts of sodium and calcium. These means that the dominant salt compounds in this particular soil are NaCl, CaSO4, Na2SO4 and CaCl2. According to the criteria set by the US Salinity Laboratory Staff [USSLS] (Citation1954), the soil irrigated by groundwater was classified as saline soils.
Table 6. Some soluble chemical properties of the soils irrigated by a combination of Shwarobit River and groundwater sources
4. Summary and conclusions
The water quality expressed by pH value varied from 8.0 (moderately alkaline) for Shwarobit River water to 8.9 (strongly alkaline) for the groundwater. The alkaline reactions of these water sources are the reflections of the relatively higher concentrations of bicarbonates. Accordingly, the Shwarobit river and the groundwater sources were found to be in the medium (C2) (341.7 µS/cm) and high (C 3) (1452.9 µS/cm) salinity hazards, respectively, based on the classification of US Salinity Laboratory Staff [USSLS] (Citation1954).
According to the US Salinity Laboratory Staff [USSLS] (Citation1954), the soils irrigated by the Shwarobit River met the criteria to be classified as saline soils because ECe was greater than 4 dS/m while ESP was less than 15%. However, According to the same criteria, except the surface layer of the profile the soils irrigated by a combination of shwarobit River and groundwater sources met the criteria to be classified as a saline sodic soil because the ECe at 25°C was greater than 4 dS/m, the ESP was greater than 15%.
As a general conclusive remark, the study underscores the need for the scientific reclamation program of salt-affected soils and irrigation water sources so as to increase the production and productivity of the study area. In line with this, a due emphasis be given for frequent monitoring of irrigation water sources, selection of suitable verities and crops, removal of excess salts by leaching, adopting judicious means of irrigation and fertilizer application together with the addition of organic manures and fallowing lands with salt lovely grasses; for such sustainable and productive utilization of the land resources, are critical.
Abbreviations
| CEC: | = | Cation exchange capacity; |
| ECe: | = | Electrical conductivity; |
| ESP: | = | Exchangeable Sodium Percentage; |
| PBS: | = | Percent Base Saturation; |
| RSC: | = | Residual Sodium Carbonate; |
| SARiw: | = | Sodium adsorption ratio of irrigation water; |
| SARsw: | = | Sodium adsorption ratio of the soil solution; |
| SAR: | = | Sodium Adsorption Ratio; |
| TP: | = | Total Porosity |
Additional information
Funding
Notes on contributors
Okubay Giday Adhanom
Okubay Giday Adhanom holds bachelor’s degree in Natural Resource Management from Hawassa University, Ethiopia in July 2008. Then, he was employed by the South Wollo Bureau of Agriculture and served as a watershed team leader in the program of Natural Resource Management for two years. Meanwhile, he served as a focal person of the World Food Program, Agri-service Ethiopia and Carbon Credit projects for two years. In September 2010, he got in country scholarship in Haramaya University to pursue his MSc study in Soil Science. Since November 2012 up to February 2018 he has been worked as Lecturer in Wollo University, collage of Agriculture, Department of Soil and Water Resource Management. Since February 2018 up to now he has been working as a Lecturer in the Department of Land Resources Management and Environmental Protection of Mekelle University. His area of interest is in Soil fertility, Soil Chemistry, Soil Survey and Characterization, Land Use/Land Cover Dynamics and the like.
References
- Ali, A., Esayas, A., & Beyene, S. (2010). Characterizing soils of Delbo Wegene watershed, Wolaita zone, Southern Ethiopia for planning appropriate land management. Journal of Soil Science and Environmental Management., 1(8), 184–15.
- Ayalew, A., & Beyene, S. (2012). Characterization of soils at Angacha district in southern Ethiopia. Journal of Biology, Agriculture and Healthcare, 2(1), 2224–3208.
- Bohn, H. L., McNeal, B. L., & O’Conner, G. A. (2001). Soil Chemistry (3rd ed.). New York: John Wiley and Sons, Inc..
- Brady, N. C., & Weil, R. R. (2002a). The nature and properties of soils (13th ed.). USA: Macmillan Publishing Company, Inc.
- Brady, N. C., & Weil, R. R. (2002b). The Nature and Properties of Soils (13th ed.). New Jersey, USA: Prentice-Hall Inc.
- Chimdi, A., Gebrekidan, H., Kibret, K., & Tadesse, A. (2012). Status of selected physico-chemical properties of soils under different land use systems of Western Oromia, Ethiopia. Journal of Biodiversity and Environmental Sciences, 2(3), 57–71.
- EL-Kader, A., Mohamedin, M., & Ahmed, K. (2006). Growth and yield of sunflower as affected by different salt affected soils. International Journal of Agriculture and Biology, 8(5), 583–587.
- Fantaw, A. (2007). An overview of Salt-affected soils and their management status in Ethiopia. A paper presented in the 3rd International Workshop on Water Management project, Haramaya University, Ethiopia. doi:10.1094/PDIS-91-4-0467B
- Gebre-mariam, Z. (2003). The water chemistry of the Ethiopian Rift-Valley Lakes and their influent rivers: Assessment of suitability for irrigation. Ethiopian Journal of Natural Resources, 5(1), 125–142.
- Gebremeskel, G., Gebremicael, T. G., Kifle, M., Meresa, E., Gebremedhin, T., & Girmay, A. (2018). Salinization pattern and its spatial distribution in the irrigated agriculture of Northern Ethiopia: An integrated approach of quantitative and spatial analysis. Agricultural Water Management, 206, 147–157. doi:10.1016/j.agwat.2018.05.007
- Gebreselassie, Y. (2002). Selected chemical and physical characteristics of soils of Adet research center and its testing sites in northwestern Ethiopia. Addis Ababa, Ethiopia: Ethiopian Journal of natural. resources.
- Giday, O., Gibrekidan, H., & Berhe, T. (2015). Soil fertility characterization in vertisols of Southern Tigray, Ethiopia. Advances in Plants and Agriculture Research, 2(1), 00034.
- Gupta, R. K., & Abrol, R. P. (1990). Salt affected soils. Their reclamation and management for crop production. Soil degradation. Advances in Soil Science, 11, 223–228.
- Hagos, A., Kibret, K., & Gebrekidan, H. (2015). Characterization and classification of soils of Kabe Sub watershed in South Wollo Zone, Northeastern Ethiopia. African Journal of Soil Science, 3(7), 134–146.
- Hazeltone, P., & Murphy, B. (2007). Interpreting soil test results; what do all the numbers mean? (2nd ed.). CSIRO Publishing.
- Hesse, P. R. (1971). A textbook of soil chemical analysis. London: William Clowes and Sons, Ltd.
- Hussein, A. 2002. Assessment of spatial variability of some physico-chemical properties of soils under different elevations and land use system in the Western slopes of mount Chilalo, Arsi. [MSc. Thesis]. Alemaya University, Ethiopia.
- Negassa, W., 2001. Assessment of important physiological properties of dystric udalf (Dystric Nitosols) under different management systems in Bako area, Western Ethiopia. [MSc thesis]. School of Graduate Studies, Alemaya University, Ethiopia.
- Okalebo, J. R., Gathua, K. W., & Woomer, P. L. (2002). Laboratory methods of soil and plant analyses: A working manual (2nd ed.). Nairobi, Kenya: TSBF –CIAT and SACRED Africa.
- Pam, P. (2002). How to interpret if your soil is sodic, using soil physical & chemical test results, Sheet number 11. Australia: Chrysalis Landscape Consultants.
- Pravin, R., Dodha, D., Vidya, C., Manab, B., & Saroj, M. (2013). Soil bulk density as related to soil texture, organic matter content and available total nutrients of Coimbatore soil. International Journal of Scientific and Research Publications, 3(2), 156–163.
- RDP. (1986). Analytical methods of the laboratory for soil, plant and water analysis. Netherlands: Royal Tropical Institute of the Netherlands.
- Seid, M., & Genenew, T. (2013). Evaluation of soil and water salinity for irrigation in North-eastern Ethiopia: Case study of Fursa small scale irrigation system in Awash River Basin. African Journal of Environmental Science, 7(5), 167–174.
- Sertsu, S., & Bekele, T. (2000). Procedures for soil and plant analysis. Addis Ababa, Ethiopia: National Soil Research Center, Ethiopia Agricultural Research Organization.
- Shahbaz, M., & Ashraf, M. (2013). Improving salinity tolerance in cereals. Review of Plant Science, 32(19), 237–249.
- Sileshi, A., Kibebew, K., & Amanuel, Z. (2015). Temporal and spatial variations in of salt-affected soils using GIS and remote sensing at Dubti/Tendaho state farm. [Ph.D. Dissertation thesis]. Haramaya University, Ethiopia.
- Squires, V., & Glenn, E. (2004). Salinization, desertification and soil erosion:The role of food, agriculture, forestry and fisheries in human nutrition. Oxford,UK.
- Tekalign, T., Haque, I., & Aduayi, E. (1991). Soil, plant, water, fertilizer, animal manure and compost analysis. Plant science division. (working Document No.B13). Ethiopia: ILCA.
- Teshome, Z., & Kibret, K. (2009). Characterization of the existing soil management groups in terms of their physical and hydraulic properties at Metahara sugarcane plantation. Proceeding of Ethiopian Sugar Industries. Bienn. Conference, 1, 93–104.
- US Salinity Laboratory Staff [USSLS]. 1954. Diagnosis and improvement of saline and alkali soils. USDA Handbook No. 60. US Government Printing Office: Washington, DC.
- Warrick, A. W. (2004). Soil physics, soil science Society of America. Journal of Vadose Zone, 3, 727.
- Yadav, S., Irfan, M., Ahmad, A., & Hayat, S. (2011). Causes of salinity and plant manifestations to salt stress: A review. Journal of Environmental Biology, 32, 667–685.
- Yihenew, G. (2002). Selected chemical and physical characteristics of soils of Adet research center and its testing sites in Northwestern Ethiopia. Ethiopian Journal of natural resources. Addis Ababa
- Zenebe, A., Gebresamuel, G., & Girma, A. (2015). Characterization of agricultural soils in CASCAPE intervention Woredas in Tigray Region (pp. 58–64). Mekelle.
- Zewdie, E. (2001). Selected physical, chemical and mineralogical characteristics of major soils occurring in character Highlands, Eastern Ethiopia. Ethiopian Journal of Natural Resources, 1(2), 173–185.