
 ?Mathematical formulae have been encoded as MathML and are displayed in this HTML version using MathJax in order to improve their display. Uncheck the box to turn MathJax off. This feature requires Javascript. Click on a formula to zoom.
Abstract
The greatest human impact on the forest ecosystems such as loss of forest area, habitat fragmentation, and soil degradation leads to decline biodiversity. These impacts can be addressed by the integration of trees on the agricultural landscape and maintaining the existing forests. In order to determine woody species diversity and density of tree on farmland in relation to the altitudinal gradient, 75 sample quadrats having an area of 100 m × 50 m, 15 sample quadrats in each range of altitude were measured. The result indicates that a total of 42 woody species belongs to 23 families and Fabaceae were the dominant family. There was a significant difference (P < 0.05) in woody species diversity, richness, evenness, tree density and the basal area between the altitudinal gradient ranges. Woody species richness (4.00), diversity indexes (1.11) and tree density (21.34) were higher in the middle altitude (1500–2000 m a.s.l). However, woody species evenness index (0.91) and the basal area (0.80) were highest in the 2000–2500 and 2500–3000 m a.s.l, respectively. Acacia abyssinica subsp. Abyssinica, Croton macrostachyus, and Cordia Africana were found to have the highest IVI (importance value index). Boswellia papyrifera, Acacia abyssinica subsp. Abyssinica and Diospyros mespiliformis were found to have the highest density. It can be generally concluded that the indigenous agricultural practices have been one way of diversifying agroecosystem in a way that has positive effects on ecological stability and can conserve species diversity.
PUBLIC INTEREST STATEMENT
The research was conducted to understand if the altitudinal gradient has effect on woody species diversity, composition and density of trees on farmland in Northern Ethiopia. The study area has diverse agroecology is well suited for the growth of various plant species. Therefore, it deserves special attention for an intensive study to monitor its status of plant species and to conserve the woody species diversity on-farmlands. Therefore, it is appropriate that scattered trees on farmland are included in the conservation strategies for biodiversity and research endeavors. Considering such issues this paper highlights. Therefore, this study will provide information on the effect of altitudinal gradients on diversity, composition and density potentials of scattered trees. This may open a gateway for other scientific empirical, and rigorous evaluations of the scattered tree on farmland, which will enable them to revise their strategies in a way to make urban forestry more successful.
Competing interests
The author declares no competing interests.
1. Introduction
Ethiopia is a center of biological diversity and its indigenous forests have been sources of biodiversity, including microorganisms, fungi, soil fauna and flora, medicinal plants, wild animals, birds and insects (Gebre-Egziabher, Citation1991), which are results of various environmental factors. A forest cover of Ethiopia has now reached 11.4% (FAO, Citation2015). However, the rates of forest degradation in Ethiopia face high (Gebrehiwot, Citation2004). The average annual deforestation rate is estimated at 210,000 ha per year (MEF, Citation2015). Expansion of agricultural land, growing demand for firewood and the establishment of new settlements inside the forest lands are some of the key factors intensifying the problem and causing loss of forest areas and their diversity (Tadesse & Feyera, Citation2008). The high rate of natural forest degradation shows a negative effect on species diversity which is significant for ecosystem function.
Population growth together with the need for the use of forests resources are increasingly threatening the sustainable use and management of these forest resources. This is the condition in various parts of the tropics, where a high percentage of natural forests and related biological diversity are being changed into the agricultural landscape (Gardner et al., Citation2009). Even if the expansion of cultivated areas is thought to be the main reasons for the degradation of biological diversity, there are variations among agricultural landscapes in their attributes that affect biodiversity (Harvey & Haber, Citation1999). For example, agricultural mono-crop practices are likely to have low species diversity while some traditional agricultural practices are common to the tropics and have a high diversity of woody species (Harvey & Haber, Citation1999; Nikiema, Citation2005).
Farmers are maintaining and planting various MPTs (Multipurpose trees) on their farmlands for different purposes, like firewood, food, fodder, windbreak or soil fertility (Gebrewahid et al., Citation2019) and sequester carbon (Gebrewahid et al., Citation2018). MPTs are taken as best fitted trees in agroforestry practices. Multipurpose trees grown across diverse land-use types like home gardens, windbreak, and scattered trees on farmland are part of an agroforestry system (Gebrewahid et al., Citation2019; Zomer et al., Citation2014). Therefore, trees are an important part of many farming systems and they have been purposely maintained on farmlands to support agriculture. In the tropics, specifically, trees are an important component of agriculture, and many trees are left on farmlands with annual crops (Gebrewahid et al., Citation2019; McNeely & Schroth, Citation2006).
The study area which has different agroecological zones, these become well suited for the growth of various plant species. Therefore, it deserves special attention for an intensive study to monitor its status of the plant species and to conserve the woody species diversity on-farmlands. Despite the actual and potential ecological importance of scattered trees on farmlands, it is reported by different authors to be declining from time to time, and its density is reduced so that the long-term prospect for a sustained supply of the goods and services from these tree species on farmland is disappearing (Harvey & Haber, Citation1999; Kassa et al., Citation2010; Kindt et al., Citation2005). Therefore, it is appropriate that trees on farmland are included in the conservation strategies for biodiversity and research endeavors (Harvey & Haber, Citation1999).
There are a number of agroforestry options in drylands of Eastern Africa that are available for the purpose of both conservation and economic development (Jama & Zeila, Citation2005). Accordingly, there are many indigenous tree species that have the potential of maintaining the ecology and economic development of the farmers’ livelihood (Gebrehiwot, Citation2004; Gebrewahid et al., Citation2019). Scattered trees on farmlands are common in Northern Ethiopia (Teklay, Citation2004) covering a large area of agricultural land (Gebrewahid et al., Citation2018). However, their significance in contributing to the biodiversity conservation have been largely ignored in the research area. Hence, our objective is to determine woody species diversity, composition, and density of trees on agricultural landscape along altitudinal gradients to provide opportunities for better management of the biodiversity conservation.
2. Materials and method
2.1. Study area description
The study sites for the present study are located in three selected districts/woredas (Kafta Humera, Tsegede, and Wolqayt) in the Western Zone of Tigray Regional State, Northern Ethiopia (Figure ). The study site is comprised of trees on the agricultural landscape that occupies lower, middle, and upper altitude gradients. Lowland is categorized into two zones namely 500–1000 m a.s.l and 1000–1500 m a.s.l, middle land is categorized into two zones namely 1500–2000 m a.s.l and 2000–2500 m a.s.l, and upper latitude is categorized into one zone namely 2500–3000 m a.s.l. (Gebrewahid et al., Citation2018, Citation2019).
Figure 1. Map of altitudinal classifications of the Western zone of Tigray, Northern Ethiopia.
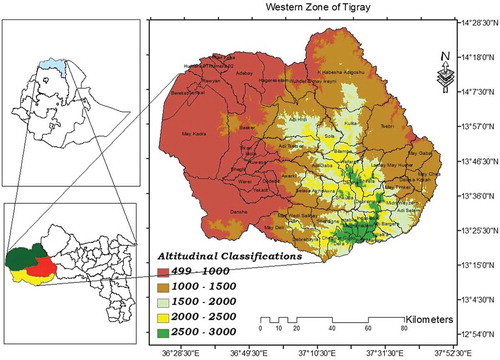
Kafta Humera district: is located in north-western Ethiopia and in the western part of Tigray National Regional State (Figure ) and 991 km away from Addis Ababa. Kafta Humera is bordered on the south with “Tsegede” and on the west with Sudan, on the north, the Tekeze River separates the district from Eritrea, on the east “Tahtay Adiyabo” and in the southeast with “Wolqayt”. The district administrative center is Setit Humera town. The geographical location of this study area is 36° 27ʹ 4.70ʹ’ to 37° 33ʹ 7.12ʹ’ E and from 13° 39ʹ 46.47ʹ’ to 14° 26ʹ 34.87ʹ’N. The district covers an area of 6,328.78 km2 which is about 23.6% of the western zone of Tigray. The area is located in semi-arid agroclimatic zone. The mean total annual rainfall of 609 mm and the rainy season of the study area is from June to September. The remaining 8–9 months between October and May/June is dry and hot. The mean maximum temperature varied between 32.31°C in August and 42.52°C in May, while the mean minimum temperature is between 17.78°C in January and 25.05°C in April. The land-use system was characterized by mixed farming system dominated by open crop cultivation; and this includes cereals (31.24%), pulses (5.94%), oilseeds (60.87%) and vegetables (1.95%). Many farmers (68.8%) are practicing a mix of cereal-livestock farming, while 27.97% cultivated annual crops and 3.23% livestock rearing (CSA, Citation2007). The economy of the district is mainly centered on the production of sesame and cotton as the primary cash crop (Gebrewahid et al., Citation2018).
Tsegede district: is located in the Western Zone of Tigray Region between 13° 14′ 21″ and 13° 44′ 46″ north latitude and 36° 27′ 44″ and 37° 45′ 05″ east longitudes within the tropics (Figure ). It is found just about 750 km west of Regional capital city, Mekelle. It is bordered by the Amhara Region on the eastern, western and southern direction and by both the Wolqayt and Kafta Humera Districts of Tigray Region in the northern part. The total area is 3233 km2 and it has a total of 25 rural kebeles. The study area is characterized by diverse physio-geographic features with high and rugged mountains, flat-topped plateau, deep gorges, incised river valleys, and rolling plains. The mean total annual rainfall of 2316 mm and rainfall starts at about the end of March and ends at early November with the high amount of rainfall in August. The mean maximum temperature varied between 16.91°C in August and 22.53°C in March, while the mean minimum temperature is between 5.90°C in December and 9.81°C in May. Mixed crop-livestock husbandry is the dominant farming system of the area. Out of the total area of the district, 71.45% is covered by cropland, 19.81% is grazing land, 6.54% forest land and about 2.2% is estimated to be area covered by rock outcrops and settlement. Crops grown in the district are mostly wheat (Triticum spp.), barley (Hordeum vulgare), teff (Eragrostis tef), finger millet (Eleusine coracanaa), faba bean (Vicia faba), field pea (Pisum sativum), noog (Guizotia abyssinica), linseed (Linum usitatissimum), sorghum (Sorghum bicolor) and sesame (Gebrewahid et al., Citation2018).
Wolqayt district: is also one of the districts of Western Tigray, Northern Ethiopia. Wolqayt is boarder on north to Kafta Humera, on the east with Asgede Tsimbila and Tselemti and on the south with Tsegede and located in the Western Zone of Tigray Region between 13° 30ʹ 34” and 14° 06ʹ 47” north latitude and 36° 50ʹ 58” and 37° 48ʹ 33” east longitude within the tropics (Figure ). The study area is also characterized by diverse physio-geographic features with high and rugged mountains, flat-topped plateau, deep gorges, incised river valleys, and rolling plains. The annual rainfall data showed that the area received 1380 mm and rainfall starts at about the end of May and ends at mid of October with the high amount of rainfall in July. The mean maximum temperature varied between 23.85°C in August and 30.16°C in April, while the mean minimum temperature is between 11.63°C in December and 15.43°C in May. The land under cultivation in this district, 63.29% was planted in cereals, 4.19% in pulses, 18.24% in oilseeds, and 0.17% in vegetables. the farmers both raised crops and livestock, while 10.96% only grew crops and 9.4% only raised livestock (Gebrewahid et al., Citation2018).
3. Data collection method
3.1. Vegetation sampling and measurement
The fieldwork for the inventory of scattered tree on farmlands was conducted from in 2016. A rectangular plot of 100 m × 50 m (0.5 ha) was randomly selected (Nikiema, Citation2005), for woody plant inventory along altitudinal gradients. Rectangular plots are chosen as they tend to include more of the within-plot heterogeneity, and thus be more representative than square or circular plots of the same area (Hairiah et al., Citation2001). According to Gebrewahid et al. (Citation2018) and Molla and Kewessa (Citation2015), a total of fifteen (15) plots were selected for each altitudinal gradient range. Trees and/or shrubs ≥ 5 cm in DBH and height were measured using a diameter tape and diameter caliper (Ponce-Hernandez et al., Citation2004) and Suunto Hypsometer, respectively, for the assessment of woody species diversity. Woody plants which have multiple stems at 1.3 m height were considered as a single individual and the DBH of the largest stem was taken. Branched woody plants at 1.3 m were measured at the smallest point below 1.3 m, where the stem assumes near cylindrical shape. A woody plant with multiple stems or forked below 1.3 m height was treated as a single individual. Plant identification was done in the field using their local name and useful trees and shrubs for Ethiopia (Bekele-Tesemma, Citation2007). Each woody plant which was listed in the field was again cross-checked for its Botanic name using the useful trees and shrubs for Eritrea (Bein et al., Citation1996).
4. Data analysis
4.1. Importance value index
Importance value index is useful to compare the environmental significance of species (Lamprecht, Citation1989). Ecologists consider it as the most important characteristics in vegetation study (Curtis & McIntosh, Citation1951). They also state that species with the highest importance value are the leading dominant species of the specified vegetation (Shibru & Balcha, Citation2004). Therefore, results combine high values of relative frequency, relative dominance, and relative density gives the highest IVI value (Froumsia et al., Citation2012; Meshesha et al., Citation2015). The ecological importance of tree species in-farmland (IVI) was calculated using relative density, frequency and dominance parameters of each species (Birhane, Citation2002):
Where; IVI is Importance Value Index, RD is relative density, Rf is relative frequency and Rd is relative dominance.
4.2. Relative density (RD)
Relative density is the study of the numerical strength of a species in relation to the total number of individuals of all the species and can be calculated as
4.3. Relative dominance (Rd)
The dominance of a species is determined by the value of its basal cover. Relative dominance is the coverage value of a species with respect to the sum of coverage of the rest of the species in the area.
4.4. Relative frequency (RF)
The degree of dispersion of individual species in an area in relation to the number of all the species that have occurred called Relative Frequency (RF).
4.5. Similarity indices
To evaluate the similarity of tree on farmland along altitudinal gradient, the widely used and classical similarity indices; Sørensen and Jaccard similarity indices, as well as their respective abundance-based indices (Chao-Sørensen estimator), were calculated (Magurran, Citation2004). The following equations were used to calculate the Sørensen similarity indices:
Where: Ss is Sorensen’s Similarity coefficient, a is Number of species in sample A and sample B (joint occurrences), b is Number of species in sample B but not in sample A, and c is Number of species in sample A but not in sample B.
4.6. Species diversity indices
Diversity measures such as Shannon diversity index (H’), Simpson diversity (D) and evenness (E´) were calculated. The formula for computing diversity indices and evenness were indicated below:
A. Shannon–Wiener diversity index (H’)
Shannon–Wiener diversity Index is measured through a combination of species richness (the number of species per sample) and species evenness (the relative abundance of each species) (Begon et al., Citation2006).
Shannon and Weaver (Citation1963) index of diversity was calculated using the equation:
Where; H’ is Shannon diversity index, Pi is the proportion of individuals found in the ith species, S is the number of species and ln is the natural logarithm.
B. Simpson’s index of diversity (D)
Where; n = the number of individuals each species, and N = the total number of individuals of the species for the site.
C. Species richness (S)
Species richness is a biologically appropriate measure of alpha (α) diversity and the total number of species in an ecological community, landscape or region relative to the total number of all individuals in that community and can be calculated by using Margalef’s index of richness (Dmg) (Magurran, Citation1988).
Where: S is Total number of species, N is Total number of individuals in a sample.
D. Species evenness (Equitability index)
Evenness refers to the variability in the relative abundance of species. The evenness index describes the equality of species abundance in a community (Begon et al., Citation2006). Evenness (J) was calculated as:
Where; H’ is the Shannon diversity index, S is the number of species in a particular altitudinal gradient and Pi =is the proportion of total individuals in the ith species.
4.7. Species population structure
Matured woody species recorded in the study quadrats were used in the analysis of population structure. Frequency, density, and basal area were used for the description and comparison of population structure in the study area. Tree density was computed by converting the count from the sample plot to a hectare basis. The population parameters were computed and summarized on Microsoft Office Excel spreadsheet using the following formula.
4.8. Frequency (%)
Frequency is the number of times a species is recorded in a given number of plots. It refers to the degree of dispersion of individual species in an area and it is expressed in term of the percentage of occurrence calculated using the equation:
4.9. Basal area
Basal area is the cross-sectional area of a tree estimated at breast height (1.3 m), which is expressed in m2. Species with the largest contribution to dominance value through the higher basal area can be considered as the most important species in the study vegetation. The basal area (g) of each species was calculated using the formula of Philip (Citation1994).
Where; g is basal area and d is diameter at breast height of a tree.
4.10. Density
Density expresses the numerical strength of a species. Here it was calculated as the number of individuals per hectare.
4.11. Statistical analysis
The data which were collected from the field inventory was organized and recorded in Microsoft excel 2019 datasheet. The altitudinal gradient were the independent variables while density, basal area, species richness, species evenness, and species diversities were considered as dependent variables. Vegetation data were analyzed using univariate analysis. Variables were compared using one-way analysis of variance (ANOVA) following the linear model (GLM) procedure at P < 0.05 with the help of the R software for Window versions 3.6.1 with statistical significance difference were observed (P < 0.05), Tukey’s HSD test were used to separate the means.
5. Result and discussion
5.1. Floristic composition
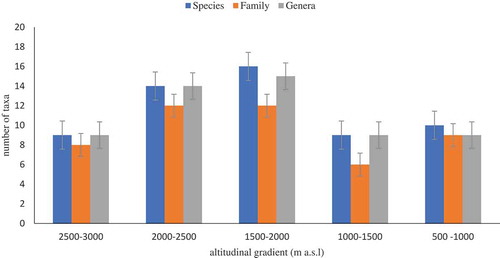
A total of 801 individuals were counted (Table ), which belong to 42 woody plant species, 23 families (Table ) and 37 genera (Table ). Fabaceae represented by 10 species (23.81%) was the dominant family followed by Combretaceae represents by 4 species (9.52%), Anacardiaceae, Bignoniaceae, Celastraceae, Myrtaceae, Olacaceae, Rhamnaceae and Sapindaceae each represents by 2 species (4.76%). The remaining families all together accounted 33.33% of the total species composition each family represented by 1 species (Table ). Acacia represented by 5 species were the most diverse and dominant species followed by Combretum, Ficus, and Maytenus each represented by 2 species among the identified genus. The rest of the genus were represented each by one species (Table ). The highest number of species, families, and genus were recorded in the middle altitude (1500–2000 m a.s.l) (Figure ). All species from the study area were categorized into four growth forms (Table ). The growth forms classification adapted for the present analysis was very simple and general as compared to other classifications (Hedberg, Citation1964; Raunkiaer, Citation1934). The information obtained from field and literature (Flora of Ethiopia and Eritrea.) were used for categorizing the recorded species into one of the four different growth forms, i.e. trees, shrubs, tree and/or shrub and tall grass. The woody species includes 3 species (7.14%) were shrubs, 28 species (66.67%) were trees, 10 species (23.81%) were trees or shrubs and tall grass was represented by 1 species (2.38%) (Table ). The scattered trees on farmland along altitudinal gradient were dominated mainly by Acacia abyssinica subsp. Abyssinica, Croton macrostachyus, Anogeissus leiocarpus/A. schimperi, Balanites aegyptiaca and Pterocarpus leucens trees (Table ). The number of species found in scattered trees on farmland of western zone of Tigray (42) was higher than the number of species found tree on farmland of Ghana (21) as reported by Chimsah et al. (Citation2013) and Benin (21) as reported by Fifanou et al., (Citation2011) and lower than the number of species found trees on farmland of semi-arid East Shewa (77) as reported by Endale et al., (Citation2016), Dellomenna District, Southeastern Ethiopia (55) as reported by Molla and Kewessa (Citation2015) and Semi-Arid West Africa (Burkina Faso) (41) as reported by Nikiema (Citation2005).
Table 1. Woody species composition of scattered tree on agricultural landscape along altitudinal gradient of western zone of Tigray
Table 2. List of families, number of species in each family and percentage of each family of the plant species recorded
Table 3. List of genus, number of species in each genus and percentage of each genus of the plant species recorded
Table 4. Life form of individual species of scattered tree along altitudinal gradient of western zone of Tigray
Figure 2. Total number of families, genera, and species recorded in the farmland of western Tigray.
5.2. Woody species density
The mean density of all the woody plant species recorded along altitudinal gradients of trees on farmland was 19 individuals’ ha−1 and species density showed a significant difference (F = 5.85, P < 0.05) along altitudinal gradient. The woody plant density was significantly highest (23 individual’s ha-1) on the 1500–2000 m a.s.l followed by 2500–3000 m a.s.l (22 individual’s ha-1) (Table ). The dense species were Acacia abyssinica subsp. Abyssinica (16 individual ha−1) and Maytenus arbutifolia (5 individual ha−1) followed by Eucalyptus camaldulensis, Cupressus lusitanica, Rhamnus prinoides (4 individual ha−1), respectively, found in 2500–3000 m a.s.l altitude. Jacaranda mimosifolia (8 individual ha−1), Cordia africana (7 individual ha−1) and Croton macrostachyus and Ficus sycomorus with (6 individual ha−1) were found dense in the 2000–2500 m a.s.l altitudinal gradient. Diospyros mespiliformis (14 individual ha−1), Anogeissus leiocarpus/A. schimperi (9 individual ha−1) and Acacia bussei (6 individual ha−1) found in 1500–2000 m a.s.l altitudinal gradient. Boswellia papyrifera (22 individual ha−1) and Balanites aegyptiaca (9 individual ha−1) were dense in 1000–1500 m a.s.l altitudinal gradient. Pterocarpus leucens (13 individual ha−1) and Ziziphus spina-christi (9 individual ha−1) found 500–1000 m a.s.l altitudinal gradient. The mean density of trees ha−1 (Table ), the present study was almost in agreement with trees on farmland that reported from semi-arid of East Shewa which was 19 trees ha−1 (Endale et al., Citation2016) and higher than the trees on farmland of Benin (West Africa) which was 7.97 trees ha−1 (Fifanou et al., Citation2011).
Table 5. Tree density and basal area of woody species on farmland along altitudinal gradients of western zone of Tigray
5.3. Basal area
Woody plant species basal area shows significant difference (F = 21.99, P < 0.05) along altitudinal gradient and 2500–3000 m a.s.l showed higher mean basal area (3.27 m2 ha-1) of woody species and the lowest mean basal area was found at 2000–2500 m a.s.l (0.91 m2 ha-1). Acacia abyssinica subsp. abyssinica (64%) and Maytenus arbutifolia (21%) have basal areas of 41.26 m2 ha−1 and 13.67 m2 ha−1 respectively which were the dominant woody species in 2500–3000 m a.s.l altitudinal gradient. The dominant woody species in the 2000–2500 m a.s.l altitudinal gradient were Croton macrostachyus (40%), Cordia africana (27%) and Ficus sycomorus (14%) have basal areas of 106.15 m2 ha−1, 72.06 m2 ha−1 and 38.02 m2 ha−1 respectively. In the 1500–2000 m a.s.l altitudinal gradient; were Anogeissus leiocarpus/A. schimperi (24%), Ficus sycomorus (16%) and Diospyros mespiliformis (15%) were dominant have basal areas of 7.81 m2 ha−1, 5.12 m2 ha−1 and 4.91 m2 ha−1 respectively. Balanites aegyptiaca (66%) and Combretum fragrans/C. adenogonium, C. ghasalense (16%) have basal areas of 13.31 m2 ha−1, 3.28 m2 ha−1 respectively which were dominant at 1000 − 1500 m a.s.l altitudinal gradient. Pterocarpus leucens (54%), Ziziphus spina-christi (14%) and Anogeissus leiocarpus/A. schimperi (11%) have basal areas of 16.54 m2 ha−1, 4.31 m2 ha−1 and 3.37 m2 ha−1 respectively were dominant at 500–1000 m a.s.l altitudinal gradient.
5.4. Frequency
The most frequently distributed woody species in the study site is Ziziphus spina-christi (29.33%), followed by Croton macrostachyus (26.67%), Balanites aegyptiaca (21.33%), Acacia abyssinica subsp. Abyssinica (20%) and Anogeissus leiocarpus (20%) (Table ). The frequency distribution of woody species along the altitudinal gradients is variable. Tree species with a greater economic or ecological value are found to be more frequently distributed across all elevation gradients (, , , , ).
Table 6. Basal area (m2 ha−1), density (ha−1), relative density (RD %), relative frequency (Rf %), relative dominance (Rd %) and Importance Value Index (IVI) of individual woody plants entire land use system
5.5. Importance value index (IVI)
Based on IVI values, the nine dominant and thus ecologically most important woody species in the entire study area are Acacia abyssinica subsp. abyssinica (40.85%), Croton macrostachyus (30.55%), Cordia africana (26.89%), Pterocarpus lucens (25.47%), Ziziphus spina-christi (25.47%), Balanites aegyptiaca (19.19%), Anogeissus leiocarpus (14.55%), Diospyros mespiliformis (13.19%) and Ficus sycomorus (12.58%) (Table ).
5.6. Woody species richness, diversity and evenness index
The species richness (F = 3.52, P < 0.05), Shannon–Wiener diversity (F = 5.37, P < 0.05), Simpson Diversity (F = 5.10, P < 0.05) and evenness index (F = 7.72, P < 0.05) of the study sites has shown significant differences along altitudinal gradient (Table ). The mean Shannon–Wiener diversity index (H’) which measures the diversity of woody species for the scattered trees on-farmland ranges from 0.61 to 1.11. Among the five study sites the highest species diversity (H’ = 1.11) was recorded from the 1500–2000 m a.s.l altitudinal gradient whereas the lowest species diversity (H’ = 0.61) was recorded from the 2500–3000 m a.s.l altitudinal gradient. Accordingly, the highest species richness (S = 4) was recorded from the 1500–2000 m a.s.l altitudinal gradient and the lowest species richness (S = 2.67) was recorded from the 2500–3000 m a.s.l altitudinal gradients (Table ). Shannon evenness index was highest (J = 0.91) at the 2000–2500 m a.s.l altitudinal gradient and the lowest (J = 0.62) were from the 2500–3000 m a.s.l altitudinal gradient (Table ). The richness, diversity, and evenness did show a significant difference across all altitudinal gradients (P < 0.05; Table 4.4). The mean Shannon diversity index (H’) of woody species for scattered tree on farmland result was lower than the scattered tree on farmlands of Ghana (0.88) (Chimsah et al., Citation2013). The Mean Shannon diversity-Weiver index (H’) was higher at the 1500–2000 m a.s.l. elevation gradient and lower at the 2500 m a.s.l. altitudinal gradient. Relatively, higher species richness was observed at the 1500–2000 m a.s.l. altitudinal gradient compared to other altitudinal gradients and lower richness was observed at the 2500–3000 m a.s.l. altitudinal gradient (Table ). This study shows a moderate direct relationship between woody species diversity and woody species richness in which both the highest species diversity and richness was recorded at 1500–2000 m a.s.l altitudinal gradient. The result of species richness showed a hump-shaped distribution, with high species richness in the middle elevation, which agrees with distribution of plant species richness along altitudinal gradients of Hubei, China (Vetaas & Grytnes, Citation2002). Plant species richness along altitudinal gradients of the southwest Ethiopian highlands (Desalegn & Beierkuhnlein, Citation2010) and the distribution pattern of trees along an altitudinal gradient of the Eastern Himalaya, India (Acharya et al., Citation2011).
Table 7. Diversity indices of woody species along an altitudinal gradient in Western zone Tigray
Similarly, species diversity was highest at middle altitude whereas the lowest species diversity was recorded at higher altitudes and lowest altitude (Table ). This study disagrees with Menassie and Masresha (Citation1996) that species diversity trend generally decreases with increasing altitude. This is due to human and animal population density was highest in the upper altitude and farm management activity (mechanized agricultural) was highest in the lower altitude than middle altitude. The Shannon–Wiever evenness values ranged between 0.62 and 0.91, which may be attributed to altitudinal difference, habitat diversity and low human disturbance. The evenness value of 0.91 for 2000–2500 m a.s.l shows that there is a balanced distribution of individuals of different species. On the other hand, the low evenness 0.62 for 2500–3000 m a.s.l indicates that there is an unbalanced representation of individuals of different species because of high human disturbance as well as site and species characteristics. The reason for low evenness can be attributed to excessive disturbance, variable conditions for regeneration and exploitation of some species (Wassie et al., Citation2005). The diversity and evenness indices imply the need to conserve the forests from both floristic diversity and human disturbance perspectives.
6. Species accumulation curve
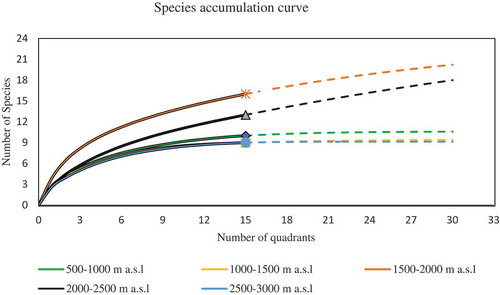
As indicated in Figure , species accumulation curves (rarefaction) were plotted for the plant species recorded in all altitudinal gradients of scattered trees on farmland. From Figure it was observed that there are still more species to be recorded in 1500–2500 m a.s.l altitudinal gradient though at a decreasing rate. The rate was still higher for 1500–2000 m a.s.l trees on farmland. Rarefaction curve is also useful to test whether there is a significant difference in species richness between different sites or not. As it is depicted from Figure the observed species accumulation curve of 1500–2000 m a.s.l was outside of the 95% confidence interval of other altitudinal gradient had significantly higher species richness than that of other altitudinal gradient trees on farmland.
Figure 3. Species accumulation (rarefaction) curves and 95% confidence intervals for trees on farmland.
6.1. Similarity indices
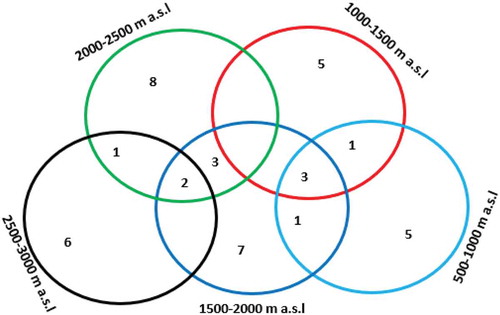
Woody species planted and retained on farmlands along altitudinal gradients are remnants of the natural vegetation which once covered the area. Most of the woody species planted by farmers are native to the area. Hence, similarities of woody species composition are expected along the five altitudinal gradients which were summarized by Sorensen’s similarity index (Table ; Figure ). Based on the presence and absence of woody species in the sampled plots, the highest (42.11%) woody species was observed between 1000–1500 m a.s.l and 500–1000 m a.s.l altitudinal gradients while the lowest (16%) woody species was observed between the 2500–3000 m a.s.l and 1500–2000 m a.s.l altitudinal gradients ().
Table 8. Sorensen’s similarity index of woody species on farmlands along the altitudinal gradient of Western zone Tigray, Northern Ethiopia
Figure 4. Similarity species of woody species on farmlands along an altitudinal gradient of Western zone Tigray, Northern Ethiopia.
7. Conclusion
The scattered trees on the indigenous agriculture landscape of the semi-arid area of Northern Ethiopia are not only for agricultural crop production and soil & water conservation but also can play a significant role in the conservation and maintain of native woody species. However, the average tree density, species richness, Shannon diversity and evenness index are 19 tree ha−1, 3.08, 0.82 and 0.76, respectively, which suggests that the significant potential of these production systems conserve biodiversity. Moreover, the presence of woody species in these landscapes may favour the survival of other organisms and hence contribute to wider conservation of biological diversity. The trees in the agricultural landscapes can also satisfy farmers’ need for wood products and other uses. By using agroforestry, they might also indirectly contribute to the conservation of biodiversity through lessening the pressure that otherwise could be exerted on protected forests. Diverse woody plant species are found scattered on farmland. Species richness, diversity, and density on farmland were higher in the 1500–2000 m a.s.l. Species evenness and basal area were higher in 2000–2500 and 2500–3000 m a.s.l altitudinal gradient. However, illegal exploitations and unmanaged grazing have threatened the system. Hence, this calls for an integrated action to control the problem.
Cover Image
Author: Source
Supplemental Material
Download MS Word (47.3 KB)Acknowledgements
The authors are grateful to the Western Zone of Tigray and Humera Agricultural Research Center, for support during data collection and with laboratory facilities to this work. We are grateful to the two anonymous referees for constructive comments on an earlier version of this manuscript.
Additional information
Funding
Notes on contributors
Yikunoamlak Gebrewahid
Yikunoamlak Gebrewahid working at Mekelle Agricultural Research Center, Tigray Agricultural Research Institute (TARI) since 2012 until know as Forestry and Agroforestry researcher, and Forestry and Agroforestry team leader under Natural Resources Research Core Process. I had Bsc in General Forestry from Wondogenet college of forestry and natural resources, Hawassa, Ethiopia and Msc in Dryland Agroforestry and land rehabilitation from Mekelle University, Mekelle, Ethiopia. I am in charge of providing research, training and consultancy for farmers, wood processors and exporters in Tigray for improving forest production and agroforestry quality. Moreover, I am conducting different researches in the area of Forest ecology, tree-crop-soil interaction, wood processing and suitable site selection for selected species.
Related Research Data
References
- Acharya, B. K., Chettri, B., & Vijayan, L. (2011). Distribution pattern of trees along an elevation gradient of Eastern Himalaya, India. Acta Oecologica, 37(4), 329–30. doi:10.1016/j.actao.2011.03.005
- Begon, M., Townsend, C. R. H., John, L., Colin, R. T., & John, L. H. (2006). Ecology: From individuals to ecosystems. Australia: Blackwell Publishers Hoboken.
- Bein, E., Habte, B., Jaber, A., Birnie, A., & Tengnäs, B. (1996). Useful trees and shrubs in Eritrea: Identification, propagation, and management for agricultural and pastoral communities. Technical Handbook (12). ICRAF Project (pp. 422). Nairobi, Kenya: World Agroforestry Centre, Eastern Africa Region.
- Bekele-Tesemma, A. (2007). Useful trees and shrubs of Ethiopia: Identification, propagation, and management for 17 agroclimatic zones. RELMA in ICRAF Project (pp. 552). Nirobi, Kenya: World Agroforestry Centre, Eastern Africa Region. doi:10.1094/PDIS-91-4-0467B
- Birhane, E. (2002). Actual and potential contribution of Enclosures to Enhance biodiversity in dry lands of eastern Tigray with particular in woody plants (Msc Thesis). Sweden: Swedish University of Agriculture (SLU).
- Chimsah, F., Nyarko, G., Yidana, J., Abubakari, A., Mahunu, G., Abagale, F., & Quainoo, A. (2013). Diversity of tree species in cultivated and fallow fields within Shea Parklands of Ghana. Journal of Biodiversity and Environmental Sciences, 3(2), 1–9.
- CSA (Central Statistical Agency). (2007). Agricultural sample survey Report on Area and Production - Tigray Region. Version 1.1. doi:10.1094/PDIS-91-4-0467B
- Curtis, J. T., & McIntosh, R. P. (1951). An upland forest continuum in the prairie‐forest border region of Wisconsin. Ecology, 32(3), 476–496. doi:10.2307/1931725
- Desalegn, W., & Beierkuhnlein, C. (2010). Plant species and growth form richness along altitudinal gradients in the southwest Ethiopian highlands. Journal of Vegetation Science, 21(4), 617–626.
- Endale, Y., Derero, A., Argaw, M., & Muthuri, C. (2016). Farmland tree species diversity and spatial distribution pattern in semi-arid East Shewa, Ethiopia. Forests, Trees and Livelihoods, 26(3), 199–214. doi: 10.1080/14728028.2016.1266971.
- FAO (Food for Agricultural Organization). (2015). Global forest resources assessment. Rome. Retrieved from http://www.fao.org/3/a-i4808e
- Fifanou, V. G., Ousmane, C., Gauthier, B., & Brice, S. (2011). Traditional agroforestry systems and biodiversity conservation in Benin (West Africa). Agroforestry System, 82(1), 1–13. doi:10.1007/s10457-011-9377-4
- Froumsia, M., Zapfack, L., Mapongmetsem, P. M., & Nkongmeneck, B.-A. (2012). Woody species composition, structure and diversity of vegetation of Kalfou forest reserve, Cameroon. Journal of Ecology and the Natural Environment, 4(13), 333–343. doi:10.5897/JENE12.047
- Gardner, T. A., Barlow, J., Chazdon, R., Ewers, R. M., Harvey, C. A., Peres, C. A., & Sodhi, N. S. (2009). Prospects for tropical forest biodiversity in a human‐modified world. Ecology Letters, 12(6), 561–582. doi:10.1111/ele.2009.12.issue-6
- Gebre-Egziabher, T. B. (1991). Diversity of ethiopian flora. In J. M. M. Engels, J. G. Hawkes, & M. Worede (Eds.), Plant genetic resources of ethiopia (pp. 75-81). Cambridge: Cambridge University Press.
- Gebrehiwot, K. (2004). Dryland agro-forestry strategy for Ethiopia. Paper presented at the dryland agroforestry workshope. World Agroforestry Centre-ICRAF (pp. 1–20), Nairobi, Kenya.
- Gebrewahid, Y., Gebre-Egziabhier, T. B., Teka, K., & Birhane, E. (2018). Carbon stock potential of scattered trees on farmland along an altitudinal gradient in Tigray, Northern Ethiopia. Ecological Processes, 7(1), 40. doi:10.1186/s13717-018-0152-6
- Gebrewahid, Y., Teka, K., Gebre-Egziabhier, T. B., Tewolde-Berhan, S., Birhane, E., Eyasu, G., & Meresa, E. (2019). Dispersed trees on smallholder farms enhance soil fertility in semi-arid Ethiopia. Ecological Processes, 8(1), 38. doi:10.1186/s13717-019-0190-8
- Hairiah, K., Sitompul, S. M., Noordwijk, M., & Palm, C. (2001). Methods for sampling carbon stocks above and below ground (pp. 10–15). Bogor, Indonesia: International centre for research in agroforestry. Southeast Asian Regional Research Programme.
- Harvey, C. A., & Haber, W. A. (1999). Remnant trees and the conservation of biodiversity in Costa Rican pastures. Agroforestry Systems, 44(1), 37–68. doi:10.1023/A:1006122211692
- Hedberg, O. (1964). Features of afroalpine plant ecology. Acta Phytogeographica Suecica, 49, 1–144.
- Jama, B., & Zeila, A. (2005). Agroforestry in the dry lands of eastern Africa: A call to action (ICRAF Working Paper – No. 1) World Agroforestry: Nairobi.
- Kassa, H., Gebrehiwet, K., & Yamoah, C. (2010). Balanites aegyptiaca, a potential tree for parkland agroforestry systems with sorghum in Northern Ethiopia. Journal of Soil Science and Environmental Management, 1(6), 107–114.
- Kindt, R., Noordin, Q., Njui, A., & Ruigu, S. (2005). Biodiversity conservation through agroforestry: Managing tree species diversity within a network of community-based, nongovernmental, governmental and research organizations in western Kenya. Paper presented at the 15th Annual Conference of the Eastern Africa Environmental Network on Networking for Biodiversity, Nairobi, Kenya.
- Lamprecht, H. (1989). Silviculture in the tropics. Tropical forest ecosystems and their tree species-possibilities and methods for their long-term utilization (English ed., pp. 296). Germany: Nature.
- Magurran, A. (1988). Ecological diversity and its measurement. Princeton: Princeton University Press.
- Magurran, A. (2004). Measuring biological diversity. Oxford, UK: Blackwell Publishing.
- McNeely, J. A., & Schroth, G. (2006). Agroforestry and biodiversity conservation–Traditional practices, present dynamics, and lessons for the future. Biodiversity & Conservation, 15(2), 549–554. doi:10.1007/s10531-005-2087-3
- MEF (Ministry of Environment and Forest). (2015). Study of cause of deforestation and forest degradation in Ethiopia and the identification and prioritization of strategic options to address those. Ministry of Environment and Forest. Addis Ababa, Ethiopia.
- Menassie, G., & Masresha, F. (1996). Plant communities of the afroalpine vegetation of Sanetti plateau, Bale mountains, Ethiopia. Sinet, 19(1), 65–86.
- Meshesha, B. W., Tsegay, B. A., & Telake, B. B. (2015). Survey on composition of perennial vegetation in Sesa Mariam monastery, Northwestern Ethiopia. BMC Research Notes, 8(1), 622. doi:10.1186/s13104-015-1562-5
- Molla, A., & Kewessa, G. (2015). Woody species diversity in traditional agroforestry practices of Dellomenna district, Southeastern Ethiopia: Implication for maintaining native woody species. International Journal of Biodiversity, 2015, 1–13. doi:10.1155/2015/643031
- Nikiema, A. (2005). Agroforestry parkland species diversity: Uses and management in semi-arid West-Africa (Burkina Faso) (PhD thesis). Wageningen University, Wageningen, The Netherlands.
- Philip, M. S. (1994). Measuring trees and forests (pp. 324). Wallingford, UK: CAB international.
- Ponce-Hernandez, R., Koohafkan, P., & Antoine, J. (2004). Assessing carbon stocks and modelling win-win scenarios of carbon sequestration through land-use changes (Vol. 1, pp. 157). Rome: Food & Agriculture Organization.
- Raunkiaer, C. (1934). The life forms of plants and statistical plant geography. London: Oxford University Press.
- Shannon, C., & Weaver, W. (1963). The measurement theory of communication. Urbana: University of Illinois Press.
- Shibru, S., & Balcha, G. (2004). Composition, structure and regeneration status of woody species in Dindin natural forest, Southeast Ethiopia: An implication for conservation. Ethiopian Journal of Biological Sciences, 1(3), 15–35.
- Tadesse, W., & Feyera, S. (2008). Sustainable management and promotion of forest coffee in Bale, Ethiopia. Bale Eco-Region Sustainable Management program, SOS Sahel/FARM-Africa, p 24.
- Teklay, T. (2004). Organic inputs from agroforestry trees on farms for improving soil quality and crop productivity in Ethiopia (PhD thesis). Sweden: Swedish University of Agricultural Science.
- Vetaas, O. R, & Grytnes, J.-A. (2002). Distribution of vascular plant species richness and endemic richness along the himalayan elevation gradient in Nepal. Global Ecology and Biogeography, 11(4), 291–301. doi: 10.1046/j.1466-822x.2002.00297.x
- Wassie, A., Teketay, D., & Powell, N. (2005). Church forests in north Gonder administrative zone, northern Ethiopia. Forests, Trees and Livelihoods, 15(4), 349–373. doi:10.1080/14728028.2005.9752536
- Zomer, R. J, Trabucco, A, Coe, R, Place, F, van Noordwijk, M, & Xu, J. C. (2014). Trees on farms: an update and reanalysis of agroforestry’s global extent and socio-ecological characteristics. Working Paper 179. Bogor, Indonesia: World Agroforestry Centre (ICRAF) Southeast Asia Regional Program. doi: 10.5716/WP14064.PDF
Table A1. Basal area (m2 ha−1), density (ha−1), relative density (RD %), relative frequency (Rf %), relative dominance (Rd %) and Importance Value Index (IVI) of individual woody plants from 2500 to 3000 m a.s.l
Table A2. Basal area (m2 ha−1), density (ha−1), relative density (RD %), relative frequency (Rf %), relative dominance (Rd %) and Importance Value Index (IVI) of individual woody plants from 2000 to 2500 m a.s.l
Table A3. Basal area (m2 ha−1), density (ha−1), relative density (RD %), relative frequency (Rf %), relative dominance (Rd %) and Importance Value Index (IVI) of individual woody plants from 1500 to 2000 m a.s.l
Table A4. Basal area (m2 ha−1), density (ha−1), relative density (RD %), relative frequency (Rf %), relative dominance (Rd %) and Importance Value Index (IVI) of individual woody plants from 1000 to 1500 m a.s.l
Table A5. Basal area (m2 ha−1), density (ha−1), relative density (RD %), relative frequency (Rf %), relative dominance (Rd %) and Importance Value Index (IVI) of individual woody plants 500–1000 m a.s.l
Table 6. The occurrence and absence of tree species along altitudinal gradient