
 ?Mathematical formulae have been encoded as MathML and are displayed in this HTML version using MathJax in order to improve their display. Uncheck the box to turn MathJax off. This feature requires Javascript. Click on a formula to zoom.
Abstract
Land-use land-cover change due to government policies and strategies to support the livelihood of the community became common practices in the agricultural landscape of Debrekidan in Tigray region, Ethiopia. Regardless of the land-use change happened in this landscape, study on physicochemical and microbial soil properties across the land uses is notably scant and little is known on how farmers could manage their land. The objective of this study was, therefore, to investigate the impact of land-use change on physical, chemical and microbial soil properties. A total of 86 composite soil samples from a depth of 20 cm were collected from four land uses: area closure, grazing land, rain fed and irrigated agricultural lands. Soil parameters mainly investigated were soil texture, pH, EC, organic carbon (OC), total nitrogen (TN), available P, K, and rhizobia population. The analysis of variance indicated that land use had a significant effect on OC, TN and pH at (p < 0.05). Higher OC and TN were found in grassland, whereas, higher pH was found in irrigated land. Higher rhizobia population densities were found in grassland whereas lower rhizobia population were in rain fed cultivated land. Generally, the agricultural landscape is characterized by low OC, TN and rhizobia population; and optimum phosphorous and potassium. Therefore, farmers of the watershed and other similar areas have to use soil management options that enhance soil OC, nitrogen and rhizobia populations.
PUBLIC INTEREST STATEMENT
The local communities in the agricultural landscape of Debrekidan in the Tigray region, Ethiopia had been changed the land uses following the regional governmental policies and strategies. However, the impact of these land-use changes on soil chemical, physical and microbial properties is not known and ultimately farmers are not aware of managing their land uses. To address this issue, soils of the agricultural landscape were collected and analyzed for the main soil parameters following the standard soil laboratory procedures. The study indicated that there is a deficiency of organic matter, nitrogen and rhizobia population; and optimum availability of phosphorous and potassium. Hence, the local community in collaboration with the local government needs to implement soil management options that increase soil organic matter, nitrogen and rhizobia population across the agricultural landscape of Debrekidan.
Competing interest
No conflicts of interests were declared.
1. Introduction
Land-use land cover (LULC) change is one of the key drivers of global environmental degradation (Fearnside, Citation2000; Kolb & Galicia, Citation2018) affected by a range of factors: environmental and biophysical; demographic and social variables; operating across space and time (Kolb, Mas, & Galicia, Citation2013). The transformation of forestland to agricultural land to meet global economy and land availability speeded up land-use dynamics (Lambin & Meyfroidt, Citation2011). Population growth, poverty and the peoples’ response to economic opportunities, as facilitated by institutional or political factors drive global LULC changes (Lambin et al., Citation2001). The formulation of policies and strategies that promote intensification of agricultural lands is becoming by now among the principal drivers of LULC changes (Schmook & Vance, Citation2009; Tadesse, Zavaleta, Shennan, & FitzSimmons, Citation2014). LULC change is a complex process in East Africa in which the natural vegetation has changed to farmland, grazing land, human settlements and urban centers; that led to a massive deforestation, loss of biodiversity and land degradation (Maitima et al., Citation2009).
Ethiopia, one of the east African countries, has experienced a similar history in LULC change processes. The rapid population growth together with the unwise utilization of natural resources have led to the conversion of forest, bush, and grassland to croplands and settlement area (Urgesa, Abegaz, Bahir, & Antille, Citation2016). The extensive LULC change happening now in Ethiopia is attributed to many causes such as drought, resettlement, land tenure system and governmental policies and strategies (Reid et al., Citation2000; Urgesa et al., Citation2016). The Agricultural Development Led Industrialization strategy, adopted by the current Ethiopian government, has set out agricultural intensification as a major pillar to increase food production and to achieve food security at each household level. In view of that, the Growth and Transformation Plan implemented in the last 7 years has led to LULC changes due to agricultural landscape intensification (FDRE, Citation2010) undertaken in the country. Currently, this strategy becomes the major driver of LULC changes throughout the country. The LULC changes induced by government policies and strategies have now at least partially been taken up by the farming communities (Nyssen, Poesen, & Deckers, Citation2009). Substantial agricultural technologies have been introduced to intensify the agricultural landscapes of the country ranging from mountain development to low land irrigation development.
Ethiopia has been faced to so many environmental challenges due to natural and manmade calamities. The human and livestock pressure on land, and the overexploitation of natural resources have been resulted in many forms of land degradation such as deforestation, erosion, loss of biodiversity, desertification and salinization (Berry, Citation2003; Hurni et al., Citation2010). The overall results of these forms of land degradation led to climate change and unsustainable land management (Gashaw, Bantider, & Silassie, Citation2014; WGEA, Citation2013). The study conducted by Muluneh et al. (Citation2017) indicated that forest and woodland coverage declined, the annual rainfall decreased and the temperature increased in Ethiopian Central rift valley. Moreover, the length of growing period became short in the Northern part of Ethiopia (Araya et al., Citation2012). The projected climate change especially in arid and semi-arid areas of our country is predicted to have a negative impact on crop productivity (Muluneh, Biazin, Stroosnijder, Bewket, & Keesstra, Citation2015). The projected climate change of Ethiopia by the coming 30 years, in general, indicated that there will be much more extreme events of climate variability. Some of the extreme events of climate variables that have predicted to have imposed on future agricultural productivity in Ethiopia are drought, temperature increment and shortening of length of growing period (H. Reid, Faulkner, & Weiser, Citation2013).
Tigray region is one of the dryland areas of the country faced successive drought and food insecurity (Eyasu, Citation2005). A number of agricultural technologies that intensify the agricultural landscapes of the region have been introduced to tackle food insecurity and environmental degradation. The agricultural landscape of Debrekidan in Hawzen district is an exemplary landscape on which distinct LULC and agricultural intensification had been carried out since the last two decades following the regional government policy and strategy. The regional government policy and strategy set out to enclose the degraded hillsides for soil and vegetation restoration, to introduce grassland management, to introduce and expand irrigation and to introduce improved crop varieties and chemical fertilizers (BoFED, Citation2010). Accordingly, area closure on the degraded hillside, grazing land management on the bare mid and flat land and irrigation activities on the rain fed cultivated land parts of the agricultural landscape of Debrekidan are the main LULC shifts implemented in the last two decades, that could alter biological, chemical and physical soil properties.
However, the LULC shifts and the intensification of the agricultural landscape which is driven by the government policies have either a positive or negative impact on physicochemical and microbial soil properties (Bezabih, Aticho, Mossisa, & Dume, Citation2016; Culman et al., Citation2010; Köhl, Oehl, & van der Heijden, Citation2014; Matson, Parton, Power, & Swift, Citation1997). It is hypothesized that the land-use change happened in the past two decades due to the agricultural landscape intensification arising from the government policies and strategies support distinct level of physical, chemical and biological soil properties.
Regardless of the LULC changes happened in the past two decades, the physicochemical and microbial soil properties variation across the typical land uses of the agricultural landscape of the area are notably scant and little is known on how farmers could better ensure the maintenance of soil biological communities and long-term fertility of the soil.
Given the importance of this agricultural landscape in supporting the livelihood of the local communities, it is needed to understand the impact of the existing land LULC change on physicochemical and microbial soil properties across the agricultural landscape of the district so as to enable small-scale farmers maintaining the optimum level of both biological and physicochemical soil properties, and enhance agricultural productivity in a sustainable way. This study will have also a contribution towards achieving soil-related sustainable development goals of the United Nations (UN) in order to achieve land degradation neutrality by 2030 (Cerdà et al., Citation2018). Therefore, this study will play its own role in making our world more sustainable. The main objective of this study was to understand the impact of the existing land use on soil physicochemical properties and soil biological communities, and to inform the local communities and regional officials on how to maintain the level of soil biology and fertility in Debrekidan district and beyond.
2. Materials and methods
2.1. Site description
This study was undertaken in the agricultural landscape of Debrekidan in Hawzen district, Eastern zone of Tigray, Ethiopia. This watershed was selected and delineated for this study purpose because the LULC change implemented within the last two decades represents larger area in Hawzen and surrounding district. Moreover, it is the watershed where operational research program sponsored by the IrishAID project is implemented. Geographically, Hawzen district extends from 13° 10ʹ 13ʹ’ to 14°47ʹ 39”N latitude and from 39°11ʹ 39ʹ’ to 39°34ʹ 47”E longitude.
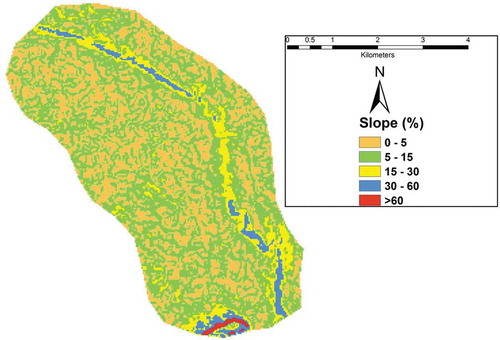
The area is characterized by undulated topography with elevation varies from 2,100 to 2,400 m above sea level. The elevated land mainly composed of sandstone is situated in southeast, northeast and east, and relatively the flat and lower elevation is situated in the west central part of the watershed (Figure ). The watershed has been classified into five categories based on slope, and ranged from flat or level land to very steep slope (Figure ). Drainage is well developed and originated from the elevated part in the east and flows towards the west.
Figure 1. Slope map of the study area.
Hawzen district owns a bimodal rainfall pattern with relatively smallest amount of rainfall in the month of April (locally called, “Belg”) and sufficient amount of rainfall (main rain season) showers in months of July, August and September. Hawzen district receives an annual rainfall ranging from 580 mm to 750 mm (Yirga, Teferi, & Kasaye, Citation2011). According to the 2017 Ethiopian National Metrological agency (NMA) report, the mean annual temperature of Hawzen District is 22.9°C, whereas the mean monthly temperature ranges from 19.9°C to 25.6°C.
The dominant soil type in the district is mainly a Cambisol (WRB, Citation2006). Parent martial of the district is mainly a sandstone which is highly fractured and in some cases with a primary porosity. The sandstone nature of the parent material within the area enables to have shallow groundwater potential used for irrigation (Nedaw, Citation2010).
The farming system in the study area is mixed type, which involves livestock husbandry and crop production simultaneously (Yirga et al., Citation2011). They also irrigate and produce market-oriented vegetables such as onion, cabbage, tomato, potato and others during the dry season using groundwater obtained from private and communal hand dug wells. The dominant rain fed crops grown in the area are Teff (Eragrostis), Barely, wheat, beans, finger millet and maize. The community use traditional ox plowing usually up to 20 cm depth to prepare the land for both irrigated and rain fed cop production.
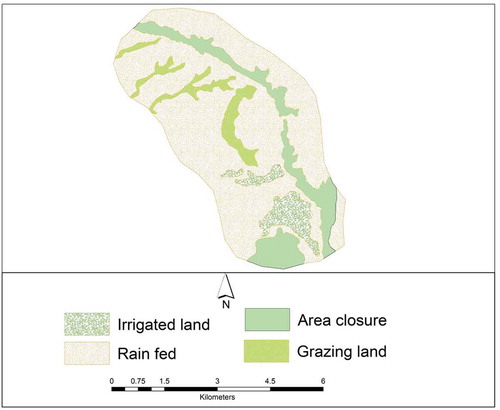
According to the elder community members, before the watershed management innervations, there was no area closure and the hillside was much degraded with no vegetation cover, the existing grassland was bare land and irrigation was also unknown in the watershed. Currently, the agricultural landscape of Debrekidan encompasses four mainland LULC types: grazing land, irrigated land, area closure and rain fed cultivated land (Figures and ). These LULC types are formed after the integrated watershed management interventions implemented within the last two decades following the regional government policies and strategies.
Figure 2. Land-use land-cover map of the study area.
2.1.1. Grazing land
An area of the land left for growing grasses and used for animal feeding by means of cut and curry system during the rainy season. After crop harvest they usually allow their animals to graze on. It covers 181 ha (6.4%) of the total watershed (Figure ). There is high organic matter accumulation on this grazing land obtained from grass residues and animal dung left on the land. This accumulation of organic matter could have an impact on organic carbon (OC) and total nitrogen (TN) availability.
2.1.2. Irrigated land
An area of the land prepared for growing irrigated crops such as maize, onion, tomato, potato, carrot and other vegetables during the dry season using ground water obtained from private and communal hand dug wells and cereals during the rainy season. The irrigated land covers an area of 174 ha (6.2%) of the total study area (Figure ). The local community cultivate here at least three times per year. The intensive cultivation of the land and the frequent application of chemical fertilizers could have in effect on the soil physical, chemical and microbial soil properties.
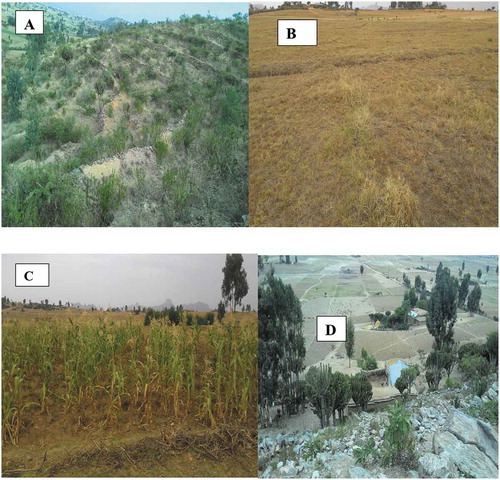
Figure 3. Photograph showing major land uses: (a) area closure, (b) Grazing land, (c) Irrigation and (d) Rain fed cultivated land.
2.1.3. Area closure
An area of the land consists of grasses, shrubs and bushes usually not exceeding 3 m in height, with a canopy cover >30% (Fikir et al., Citation2009). This land-use type covers an area of 405 ha (14.3%) of the total watershed (Figure ). The land and vegetation restoration taking place in this land-cover type can influence on the physical, chemical and microbial soil properties.
2.1.4. Rain fed cultivated land
An area of land prepared for growing rain fed crops such as barely, wheat, beans and millet. This category includes areas currently under crop, fallow and land under preparation. The rain fed cultivated land covers 20,798 ha (73%) of the total study area. This land-use type covers a large percentage proportion of the land in the agricultural landscape of Debrekidan (Figure ). The community uses chemical fertilizer to grow rain fed crops and can also affect the soil properties of this land-use type.
2.2. Methodology
2.2.1. Field survey and soil sampling design
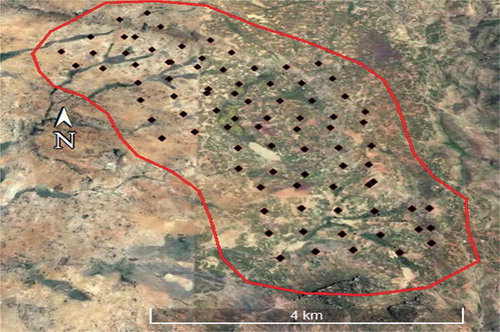
In order to identify the major land-use types in the agricultural landscape of Debrekidan, a two-day reconnaissance survey was conducted with full participation of the local communities. A focus group discussion (n = 8) that involves community leaders, elders and agricultural extension workers was made to identify the major land-use types in the agricultural landscape of Debrekidan. In addition, transect walk to observe the land uses was conducted and a consensus reached. Accordingly, four major land use/cover types (Figures and ) namely: area closure, grazing land, irrigated cultivated land and rain fed cultivated land were identified. Then, an area of 2,839 ha landscape was delineated in Google earth and created a polygon layer for study. Grid sampling, one of the soil sampling strategies which delivers more in-depth information about the spatial distribution of a soil (Burt, Citation2014; Carter, Citation1993) was used for this study. Fishnet tool of the ArcGIS 10.2 software was used to generate a regularly spaced (500 m) grid of sampling points inside the polygon layer. However, to obtain a representative soil sample from each land uses, some intuitive sampling (Burt, Citation2014) was used at the ground, and some pre-defined sampling points were moved from their original position to the nearest representative land-use type.
A composite soil sample, composed of six sub-samples collected at a distance of 15 m radius around the center of sampling point, was collected from each sampling location (Figure ). The coordinates of each composite soil sampling points were recorded using a global positioning system at an accuracy of ±3 m. Sampling depth was decided based on the depth of soil mixing for land preparation and depth of majority of root crops (20 cm) growing or potentially to be grown in the agricultural landscape (Jones, Citation2001). Soil samples were collected using a hand auger and the collected sub-samples were put in a clean plastic tray, crushed, mixed thoroughly, and transferred 1 kg composite soil sample to plastic sampling bag. A total of 86 (7 composite soil sample from area closure, 12 composite soil samples from grazing land, 10 composite soil sample from irrigation, 57 composite soil samples from rain fed cultivated land) soil samples were collected across the landscape. Finally, all soil samples were transported to Mekelle soil, plant and water sample analytical laboratory for analysis. In addition, another composite soil sample composed of six sub-samples was collected from each land-use types for microbial examination and transferred to microbiology laboratory found in Mekelle Soil Research Center.
Figure 4. Soil sampling location.
Soil samples were analyzed for physicochemical soil properties (texture, pH, electrical conductivity (EC), OC), TN), available phosphorous (Ava.P), cation exchange capacity (CEC), exchangeable potassium, sodium, calcium and magnesium) and microbial soil properties for rhizobia population densities.
2.2.2. Physicochemical and microbial soil laboratory analysis
To determine the textural class of the soil, soil samples were dispersed using hexametaphosphate solution and measured by hydrometer method following the procedure outlined in USDA (Citation1972). pH and EC were determined based on the ratio of 1:2.5 extract from soil: H2O suspension (Houba, Van der Lee, Novozamsky, & Walinga, Citation1989) and measured using pH meter and EC meter, respectively. OC was determined by Walkley and Black method (Schnitzer, Citation1982). TN was determined by Kjeldal digestion (Kjeldahl, Citation1883). Available phosphorus was determined by the Olsen method (Olsen, Citation1954b). CEC and exchangeable bases (Ca, Mg, K and Na) were determined after leaching soil by ammonium acetate (1N NH4OAc) at pH 7.0. CEC was estimated titrimetrically by distillation of ammonium that was displaced by sodium from NaCl solution (Chapman, Citation1965). Exchangeable Ca and Mg were measured using atomic absorption spectrophotometer, whereas Na and K were measured by flame photometer (Chapman, Citation1965).
Assessment of rhizobia populations in the soil was conducted following the physicochemical properties. Serial dilutions were made to count the number of rhizobia following the procedure outlined in Howieson and Dilworth (Citation2016). A series of 10−4, 10−5 and 10−6 were used in this study to determine the colony-forming unit per plate or number of viable cells per gram of soil. In this study spread, plate count method was used (Howieson & Dilworth, Citation2016). 1 ml of each serial dilutions (10−4, 10−5 and 10−6) was inoculated on the surface of the culture medium in petri dishes, and each of them were replicated three times and then aseptically spread the added aliquot over the culture medium with a sterilised L-shaped glass spreader. After inoculation and absorption of the inoculums into the agar, the plates were placed in an incubator at 28 ± 2°C, inverted and allowed to grow for a period of two to 8 days (Howieson & Dilworth, Citation2016). After 2–8 days of the incubation period, the number of colonies was counted between 30 and 300 CFU (Colony Forming Units) per plate to give statistical robustness (Howieson & Dilworth, Citation2016). Accordingly, the number of colony-forming unit per plate per millilitres was calculated using equation 1.
where CFU = Colony-forming unit per millilitres
Ave. = average number of colonies of three plates
CF = Correction factor (to correct for the 0.1 ml used)
D = Dilution of the suspension (e.g. 10−4, 10−5, 10−6 etc.)
2.2.3. Data analysis
Descriptive statistical analysis (such as minimum, maximum, mean, coefficient of variation (CV), standard deviation, etc.) was done to describe the physicochemical soil properties in the agricultural landscape of Debrekidan. One-way analysis of variance (ANOVA) was used to determine the influence of land-use change on soil properties. The least significant difference comparison test was carried out to point out the statistically different means (p < 0.05). Both Statistical Package for Social Sciences (SPSS) version 19, 2010, and Microsoft Excel software were used for descriptive and ANOVA analysis. As the descriptive and ANOVA statistical approaches overlook spatial variability among observations (Nanos, Grigoratos, Martín, & Samara, Citation2015; Nourzadeh, Hashemy, Rodriguez Martin, Bahrami, & Moshashaei, Citation2013), geo-statistical techniques have been used to analyze spatial distribution of soil properties (Goovaerts, Citation1997; López-Granados, Jurado-Expósito, Pena-Barragan, & García-Torres, Citation2005). Geostatistics has been widely used to estimate and map soil properties across spaces. Kriging is one of the exact methods of geostatistics (Lam, Citation1983) used widely in many disciplines including soils (Goovaerts, Citation1997; Li & Heap, Citation2011). Among the kriging algorithms, ordinary kriging that is suitable spatial prediction models for geo-statistical analysis of environmental variables (Hengl, Citation2007), such as soil properties (Bernardi et al., Citation2017; Goovaerts; Nezami & Alipour, Citation2012; Walter, McBratney, & Douaoui, Citation2001) were used to predict soil properties over the agricultural landscape in ArcGIS 10.2 environment. Finally, the generated raster layers of each soil parameter were further reclassified in spatial analyst tools of the ArcGIS 10.2 software using different soil parameter rating (Horneck, Ellsworth, Hopkins, Sullivan, & Stevens, Citation2007; Marx, Hart, & Stevens, Citation1996; Tekalign, Haque, & Aduayi, Citation1991).
3. Results and discussion
3.1. Physicochemical soil properties
The descriptive statistical analysis of soil physicochemical properties across the four land-use types of the agricultural landscape of Debrekidan is presented in Tables and . Irrigated land, rain fed and area closure had higher mean values (57.4%, 63.64%, and 62.85%, respectively) for sand percentage and lower mean values (17.6% 14.98% and 12.85%, respectively) for clay percentage. The higher mean value of sand percentage in these three land uses indicates that there is a higher proportion of sand and low proportion of clay in soils of the agricultural landscape of Debrekidan. The soil textural class analysis result revealed that sandy-loam soils dominated the irrigated land, rein fed and area closure. However, the grassland is characterized by loamy soils. The live mulch obtained from the grasses and straw mulch obtained from grass residues conserve loam soils by reducing runoff initiation and preventing runoff generation (Keesstra et al., Citation2019) as compared to the other land-use types. The abandonment of rain fed cultivated land for the purpose of grass regeneration can also contribute to sediment accumulation in this land-use type (Cerdà et al., Citation2018). Moreover, the grassland is situated at the lower flat part of the watershed where alluvial deposition takes place, and has also a relatively higher proportion of organic matter coming from grass residues and cattle waste. The alluvial deposition together with the accumulation of organic matter makes the grassland to have loam textural soils (Plante, Conant, Stewart, Paustian, & Six, Citation2006).
Table 1. Descriptive statistics of soil properties across irrigation and rain fed land uses types
Table 2. Descriptive statistics of soil properties across grassland and area closure land uses types
A higher mean value for pH was found relatively in irrigated land (7.27), while the rest three land-use types had similar lower pH values (6.5). The irrigated land is the most intensively cultivated land where the communities grow market-oriented cash crops such as onion, tomato, potato, maize, and other vegetables three times per year using groundwater of the hand dug well. The higher pH of the irrigated land-use type is therefore due to the intensive irrigation practices undertaken using the groundwater (Ahmed, Inoue, & Moritani, Citation2010; Beltrán, Citation1999; Malash, Flowers, & Ragab, Citation2008). According to the assessment made by Nata, Bheemalingeswara, and Asmelash (Citation2009), there were some hand dug wells which had salinity symptoms, and the gradual application of this saline irrigation water can increase the pH of the soil in irrigated agriculture and ultimately can cause soil salinity in the irrigated land of the Debrekidan watershed.
Mean of soil OC content in grassland (2.35%) was almost two times higher than that found in irrigated land, rain fed cultivated land and area closure (1.16%, 1.05%, 1.56%, respectively), and the mean of TN content in grassland (0.02%) was also two times higher that found in irrigated land, rain fed cultivated land and area closure (0.01%). This result is in line with the finding of Zhang et al. (Citation2019) that grasslands have contribution to OC and TN accumulation in arid areas than woodlands and shrubland. Sienkiewicz et al. (Citation2017) have also supported this study and indicated that fallow land has ability to modify TN and OC concentrations in soil. The high content of OC and TN in the grassland is attributed to the accumulation of high organic matter obtained from grass residues and remains of animal waste materials (Franzluebbers & Stuedemann, Citation2009; Manley, Schuman, Reeder, & Hart, Citation1995; Yimer, Ledin, & Abdelkadir, Citation2007) in almost throughout the year.
Following the grassland, area closure had a higher mean value (1.56%) of OC than the irrigated (1.16%) and rain fed (1.05%) cultivated lands. Whereas, the area closure had a similar mean value of TN (0.01%) with the irrigated and rain fed cultivated land. The restoration of soil and natural vegetation in the degraded hillside contributed more for soil OC accumulation in the area closure (Ali et al., Citation2017). However, the similarity in TN in these land-use types could be due to the nitrogen content of the biomass available in the area closure (Sienkiewicz et al. (Citation2017).
Ava.P was higher mean value in irrigated land (13.49 ppm) and rain fed cultivated land (10.79 ppm) than in grassland (9.31 ppm) and area closure (9.81). The higher phosphorous availability in irrigated land and rain fed cultivated land could be due to the frequent application of organic fertilizer (compost and manure) and inorganic fertilizer (DAP) used for crop cultivation (Buresh, Smithson, & Hellums, Citation1997; Eghball, Citation2002; Tran & N’dayegamiye, Citation1995). A higher mean value of exchangeable potassium was obtained in rain fed cultivated land (302.5 ppm) followed by grassland (274.05 ppm), whereas higher mean value of exchangeable sodium was observed in grassland (593.8 ppm) followed by rain fed (587.68 ppm). Similar mean values of calcium and magnesium were seen in all the land-use types.
The CV values (Tables and ) for all soil properties ranged from 6% to 156% in irrigated land, from 9% to 97% in rain fed, 3% to 88% in grassland and from 4.9% to 163% in area closure. These values indicated that the observed soil parameters had weak to strong variability in both land-use types (Nielsen & Bouma, Citation1985). According to the classification system set by Nielsen and Bouma (Citation1985), pH in all land-use types, and EC in grassland had weak variability (CV<10%), and the exchangeable sodium and potassium in irrigated land and area closure had strong variability (CV>100%). Otherwise, all the rest measured soil parameters fall under moderate variability (CV = 10% to 100%).
The wide range of variations for majority of the soil properties across the agricultural landscape of Debrekidan is associated with the different management practices carried out by the watershed community. Similar findings have been reported by Di Virgilio, Monti, and Venturi (Citation2007) and Fu, Tunney, and Zhang (Citation2010) at various scales.
The ANOVA (Table ) indicated that land use had a significant effect on OC, TN and pH at p < 0.05. Comparisons of means among different land use revealed that soils in grassland contained more soil OC and TN than irrigated land; rain fed cultivated land and area closure. The mean comparison also indicated that soils in irrigated land have higher pH values than the other land-use types. The results are in line with the finding of Ali et al. (Citation2017), who found a higher pH in arable land and higher organic matter in pasture and forestland. Gelaw, Singh, and Lal (Citation2015), who studied the impact of land use on soil properties in Tigray, also found that open pasture had significantly higher soil OC and TN than rain fed cultivation, agroforestry and irrigation.
Table 3. Analysis of variance (ANOVA) results of soils parameters under four land-use types
A standard geo-statistical analysis was also carried out to describe the spatial patterns of the main soil properties (OC, TN, phosphorous and potassium) across the agricultural landscape of Debrekidan. The map of these soil properties obtained by using the ordinary kriging methods of interpolation is presented in Figure . The map indicated that the agricultural landscape of Debrekidan is dominated by low (0.5–1.5%) OC (Tekalign, Citation1991). Areas with medium (1.5–3.0%) value of OC are covered a small portion in the central and eastern part of the landscape (Figure ). Areas, where there is a medium organic matter, are spatially occupied by grazing land and area closure. This is due to the accumulation of organic matter coming from the grasses and foliage residues in the grazing land and area closure (Schuman, Janzen, & Herrick, Citation2002; Smith, Citation2008).
However, according to the rating set by Tekalign (Citation1991) the agricultural landscape of Debrekidan is dominated by medium (0.01–0.12%) TN). Areas with low (<0.01%) TN are covered a relatively small portion of the land in the northern part of the landscape (Figure ). This is due to the accumulation of cattle waste materials such as cow dung and urine in the grassland and area closure land-use types (Muñoz, Kelling, Rylant, & Zhu, Citation2008; Paul & Beauchamp, Citation1994).
Figure 5. Spatial distribution of OC, TN, Available P and Exchangeable K.
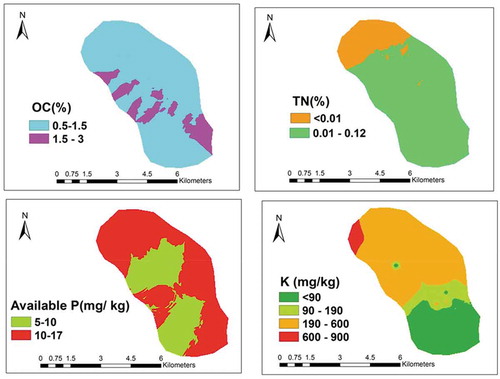
According to Olsen (Citation1954a) rating, the agricultural landscape of Debrekidan is dominated by high (10–17 mg kg−1) Ava.P, whereas, relatively small portion of the land in central and lower part of the agricultural landscape has medium (5–10 mg kg−1) Ava.P. Spatially, the medium Ava.P found around the land-use types of area closure and grazing. This indicates that there is relatively lower level of Ava.P in the grazing land and area closure than in rained and irrigated agriculture. This could be due to the frequent accumulation of phosphorous residues coming from the frequent application of phosphorous chemical fertilizer by the communities to grow rained and irrigated crops (Welsh, Tenuta, Flaten, Thiessen-Martens, & Entz, Citation2009). Generally, the agricultural landscape of Debrekidan is dominated with optimum (190–600 mg/kg) potassium (Figure ) as per the rate recommended by Jones (Citation2002). As a watershed, the interpolated soil map depicted in Figure indicated that there is a deficiency of OC and TN but there is an optimum level of phosphorous and potassium.
3.2. Microbial soil properties
Rhizobial population density was varied across the agricultural land-use types in Debrekidan. The rhizobial population density ranged from 3 × 10⁶ to 1.36 × 10⁸ g−1 of soil, which is obtained from rain field and grassland at 10−4 and 10−5 serial dilution series (Tables and ) respectively, measured by the plate count method.
Table 4. Soil Rhizobia population densities in irrigation and rain fed land-use types
Table 5. Soil Rhizobia population densities in grassland and area closure land-use types
The rhizobial population varied among farms due to different farming systems, and various rhizobial population densities were also obtained from tenfold serial dilution series. As indicated in Tables and , the higher rhizobia population densities (1.36 x 10⁸ cells g−1 of soil) were obtained from grassland comparing to the remaining different farming units, in this farmland the rhizobial population density decreased as the dilution series increases from 10−4 to 10−6 and the rhizobia population ranges 3 × 10⁶ to 3 × 10⁷ g−1 of soil, similar trends were observed in both farmlands (Tables and ). This indicates that the presence of indigenous rhizobia strains in the field due to an isolated area from disturbance and closed area.
A significantly lower rhizobia population density of 3 × 10⁶ was observed in rain field farm unit as compared to the other farms (Tables and ). This lowering of rhizobial population might be due to the deposition of chemical fertilizers in the rain field. Soil pH of the study site was ranging from 3.21 to 7.99 in all investigated soils; therefore, it is unlikely to have markedly affected the survival and multiplication of rhizobia. It is known that the survival of rhizobia can be affected at soil pH <5.5, with severe reductions in numbers at pH < 4.5 (Martyniuk & Oroń, Citation2008). The density of indigenous rhizobia able to nodulate a particular legume species can vary from 10 to 107 g−1soil and may be attributed to the cropping history of the soil (Allito, Citation2015). The difference in soil organic matter and clay content, and nutrient condition might also explain the higher rhizobial population density in the study area. It is possible to conclude that Ethiopian soils are harboured with sufficient number of rhizobial population (Slattery, Pearce, & Slattery, Citation2004). Rain field soils with long cropping history of legume crops harboured a lower number of rhizobial population g−1 soils of (3 × 10⁶). Relatively, higher number of rhizobia was estimated in grassland soils which were 1.36 × 10⁸ g−1soils with no history of cropping legumes.
4. Conclusion
Currently, the agricultural landscape of Debrekidan has four major land-use types namely: area closure, grazing land, rain fed and irrigated cultivated lands. These land uses are created within the last two decades by government policies and strategies to improve the food security of the local communities. The LULC change happened with in the last two decades brought soil physical, chemical and biological variations across the land uses of the agricultural landscape of Debrekidan. The grassland is characterized by loam soil texture, and the irrigated land, rein fed and area closure are characterized by sandy loam soil texture. The intensive irrigation activities using the groundwater caused the irrigated land to raise the pH of the soil. Higher OC, TN and rhizobia population were found in grass land-use type. The interpolated map for the selected soil properties indicated thatthe agricultural landscape of Debrkidan is characterized by low soil OC, TN and rhizobia populations, but optimum phosphorous and potassium. Farmers of the local communities in collaboration with the regional and district governmental and non-governmental organizations should design land management strategies for each distinct land uses types. Best land management options that enhance soil organic matter, nitrogen and rhizobia population in rain fed and irrigated agricultural land; and reduce pH of the soil in the irrigated agricultural lands should be given a priority.
Additional information
Funding
Notes on contributors
Gebrejewergs Aredehey
Gebrejewergs Aredehey, the first author of this article, is a lecturer of watershed management at Department of Land Resources Management and Environmental Protection (LaRMEP), College of Dry land Agriculture and Natural Resources, Mekelle University, Ethiopia. Gebrejewergs Aredehey is also doing a research on soil characterization in the agricultural landscape of Tigray region.
Gebremedhn Berhe Zenebe
Gebremedhin Berhe Zenebe, the second author of this article, is a researcher and center director at Mekelle Soil Research Center of the Tigray Agricultural Research Institute (TARI). He is doing a research on soil resources survey and mapping.
Aklil Gebremedhn
Aklil Gebremedhn, the third author of this article, is a researcher at Mekelle Soil Research Center of the Tigray Agricultural Research Institute (TARI). He is doing a research on soil micro-biology.
References
- Ahmed, B. O., Inoue, M., & Moritani, S. (2010). Effect of saline water irrigation and manure application on the available water content, soil salinity, and growth of wheat. Agricultural Water Management, 97(1), 165–18. doi:10.1016/j.agwat.2009.09.001
- Ali, S., Hayat, R., Begum, F., Bohannan, B., Inebert, L., & Meyer, K. (2017). Variation in soil physical, chemical and microbial parameters under different Land uses in Bagrot Valley, Gilgit, Pakistan. Journal of the Chemical Society of Pakistan, 39(1), 97–107.
- Allito, B. B. (2015). Soil population and phenotypic characterization of soybean (Glycin max) and haricot bean (Phaseolus vulgaris) nodulating rhizobia at Hawassa and Ziway. Scholarly Journal of Agricultural Science, 5(1), 30–38.
- Araya, A., Stroosnijder, L., Habtu, S., Keesstra, S. D., Berhe, M., & Hadgu, K. M. (2012). Risk assessment by sowing date for barley (Hordeum vulgare) in northern Ethiopia. Agricultural and Forest Meteorology, 154, 30–37. doi:10.1016/j.agrformet.2011.11.001
- Beltrán, J. M. (1999). Irrigation with saline water: Benefits and environmental impact. Agricultural Water Management, 40(2–3), 183–194. doi:10.1016/S0378-3774(98)00120-6
- Bernardi, A., Bettiol, G. M., Mazzuco, G. G., Esteves, S. N., Oliveira, P., & Pezzopane, J. M. (2017). Spatial variability of soil fertility in an integrated crop livestock forest system. Advances in Animal Biosciences: Precision Agriculture (ECPA), 8(2), 590–593. doi:10.1017/S2040470017001145
- Berry, L. (2003). Land degradation in Ethiopia: Its impact and extent. In L. Berry, J. Olson, & D. Campbell (Eds.), Assessing the extent, cost and impact of land degradation at the national level: Findings and lessons learned from seven pilot case studies (pp. 11), World Bank, USA.
- Bezabih, B., Aticho, A., Mossisa, T., & Dume, B. (2016). The effect of land management practices on soil physical and chemical properties in Gojeb Sub-river Basin of Dedo District, Southwest Ethiopia. Journal of Soil Science and Environmental Management, 7(10), 154–165. doi:10.5897/JSSEM2016.0574
- BoFED. (2010). Growth and transformation plan. Mekelle, Ethiopia: BoFED.
- Buresh, R. J., Smithson, P. C., & Hellums, D. T. (1997). Building soil phosphorus capital in Africa. USA: Soil Science Society of America and American Society of Agronomy.
- Burt, R. (2014). Soil survey field and laboratory methods manual. Washington DC: United States Department of Agriculture, Natural Resources Conservation Service, National Soil Survey Center, Natural Resources Conservation Service, Kellog Soil Survey Laboratory.
- Carter, M. R. (1993). Soil sampling and methods of analysis. Florida: CRC Press.
- Cerdà, A., Rodrigo-Comino, J., Novara, A., Brevik, E., Vaezi, A., Pulido, M., … Keesstra, S. D. (2018). Long-term impact of rainfed agricultural land abandonment on soil erosion in the Western Mediterranean basin. Progress in Physical Geography: Earth and Environment, 42(2), 202–219. doi:10.1177/0309133318758521
- Chapman, H. (1965). Cation exchange capacity by ammonium saturation method: Methods of soil analysis, Part 2. Madison: American Society of Agronomy.
- Culman, S. W., Young-Mathews, A., Hollander, A. D., Ferris, H., Sánchez-Moreno, S., O’Geen, A. T., & Jackson, L. E. (2010). Biodiversity is associated with indicators of soil ecosystem functions over a landscape gradient of agricultural intensification. Landscape Ecology, 25(9), 1333–1348. doi:10.1007/s10980-010-9511-0
- Di Virgilio, N., Monti, A., & Venturi, G. (2007). Spatial variability of switchgrass (Panicum virgatum L.) yield as related to soil parameters in a small field. Field Crops Research, 101(2), 232–239. doi:10.1016/j.fcr.2006.11.009
- Eghball, B. (2002). Soil properties as influenced by phosphorus-and nitrogen-based manure and compost applications. Agronomy Journal, 94(1), 128–135. doi:10.2134/agronj2002.0128
- Eyasu, Y. (2005). Development and management of irrigated lands in Tigray. Ethiopia: Balkema.
- FDRE, M. (2010). Growth and transformation plan (2010/11-2014/15). Addis Ababa
- Fearnside, P. M. (2000). Global warming and tropical land-use change: Greenhouse gas emissions from biomass burning, decomposition and soils in forest conversion, shifting cultivation and secondary vegetation. Climatic Change, 46(1–2), 115–158. doi:10.1023/A:1005569915357
- Fikir, A., Nurhussen, T., Nyssen, J., Atkilt, G., Amanuel, Z., Mintesinot, B., … Poesend, J. (2009). The impacts of watershed management on land use and land cover dynamics in Eastern Tigray (Ethiopia). Resources, Conservation and Recycling, 53, 192–198. doi:10.1016/j.resconrec.2008.11.007
- Franzluebbers, A., & Stuedemann, J. (2009). Soil-profile organic carbon and total nitrogen during 12 years of pasture management in the Southern Piedmont USA. Agriculture, Ecosystems & Environment, 129(1–3), 28–36. doi:10.1016/j.agee.2008.06.013
- Fu, W., Tunney, H., & Zhang, C. (2010). Spatial variation of soil nutrients in a dairy farm and its implications for site-specific fertilizer application. Soil and Tillage Research, 106(2), 185–193. doi:10.1016/j.still.2009.12.001
- Gashaw, T., Bantider, A., & Silassie, H. G. (2014). Land degradation in Ethiopia: Causes, impacts and rehabilitation techniques. Journal of Environment and Earth Science, 4(9), 98–104.
- Gelaw, A. M., Singh, B. R., & Lal, R. (2015). Organic carbon and nitrogen associated with soil aggregates and particle sizes under different land uses in Tigray, Northern Ethiopia. Land Degradation & Development, 26(7), 690–700. doi:10.1002/ldr.v26.7
- Goovaerts, P. (1997). Geostatistics for natural resources evaluation. New York: Oxford University Press.
- Hengl, T. (2007). A practical guide to geostatistical mapping of environmental variables. Italy: European Communities.
- Horneck, D. A., Ellsworth, J. W., Hopkins, B. G., Sullivan, D. M., & Stevens, R. G. (2007). Managing salt-affected soils for crop production. USA: Oregon Stae University Extension Service.
- Houba, V., Van der Lee, J., Novozamsky, I., & Walinga, I. (1989). Soil and plant analysis. Part, 5, 4–10.
- Howieson, J., & Dilworth, M. (2016). Working with rhizobia. Canberra: Australian Centre for International Agricultural Research.
- Hurni, H., Solomon, A., Amare, B., Berhanu, D., Ludi, E., Portner, B., … Gete, Z. (2010). Land degradation and sustainable land management in the highlands of Ethiopia. In H. Hurni & U. Wiesmann (Eds.), with an international group of co-editors. Global change and sustainable development: A synthesis of regional experiences from research partnerships (Vol. 5, pp. 187–201). Georaphica Bernensia, Bern, Switzerland.
- Jones, J. B., Jr. (2001). Laboratory guide for conducting soil tests and plant analysis. Florida: CRC press.
- Jones, J. B., Jr. (2002). Agronomic handbook: Management of crops, soils and their fertility (pp. 482). Boca Raton, FL, USA: CRC Press LLC.
- Keesstra, R.-C., Novara, J., Giménez-Morera, A., Pulido, A., Di Prima, M., & Cerdà, A. (2019). Straw mulch as a sustainable solution to decrease runoff and erosion in glyphosate-treated clementine plantations in Eastern Spain. An assessment using rainfall simulation experiments. Catena, 174, 95–103. doi:10.1016/j.catena.2018.11.007
- Kjeldahl, C. (1883). A new method for the determination of nitrogen in organic matter. Z Anal Chemistry, 22(p), 366. doi:10.1007/BF01338151
- Köhl, L., Oehl, F., & van der Heijden, M. G. (2014). Agricultural practices indirectly influence plant productivity and ecosystem services through effects on soil biota. Ecological Applications, 24(7), 1842–1853. doi:10.1890/13-1821.1
- Kolb, M., & Galicia, L. (2018). Scenarios and story lines: Drivers of land use change in southern Mexico. Environment, Development and Sustainability, 20(2), 681–702. doi:10.1007/s10668-016-9905-5
- Kolb, M., Mas, J.-F., & Galicia, L. (2013). Evaluating drivers of land-use change and transition potential models in a complex landscape in Southern Mexico. International Journal of Geographical Information Science, 27(9), 1804–1827. doi:10.1080/13658816.2013.770517
- Lam, -N. S.-N. (1983). Spatial interpolation methods: A review. The American Cartographer, 10(2), 129–150.
- Lambin, E. F., & Meyfroidt, P. (2011). Global land use change, economic globalization, and the looming land scarcity. Proceedings of the National Academy of Sciences, 108(9), 3465–3472. doi:10.1073/pnas.1100480108
- Lambin, E. F., Turner, B. L., Geist, H. J., Agbola, S. B., Angelsen, A., Bruce, J. W., … Folke, C. (2001). The causes of land-use and land-cover change: Moving beyond the myths. Global Environmental Change, 11(4), 261–269. doi:10.1016/S0959-3780(01)00007-3
- Li, J., & Heap, A. D. (2011). A review of comparative studies of spatial interpolation methods in environmental sciences: Performance and impact factors. Ecological Informatics, 6(3–4), 228–241.
- López-Granados, F., Jurado-Expósito, M., Pena-Barragan, J., & García-Torres, L. (2005). Using geostatistical and remote sensing approaches for mapping soil properties. European Journal of Agronomy, 23(3), 279–289.
- Maitima, J. M., Mugatha, S. M., Reid, R. S., Gachimbi, L. N., Majule, A., Lyaruu, H., … Mugisha, S. (2009). The linkages between land use change, land degradation and biodiversity across East Africa. African Journal of Environmental Science and Technology, 3(10), 310–325.
- Malash, N. M., Flowers, T. J., & Ragab, R. (2008). Effect of irrigation methods, management and salinity of irrigation water on tomato yield, soil moisture and salinity distribution. Irrigation Science, 26(4), 313–323. doi:10.1007/s00271-007-0095-7
- Manley, J. T., Schuman, G. E., Reeder, J. D., & Hart, R. H. (1995). Rangeland soil carbon and nitrogen responses to grazing. Journal of Soil and Water Conservation, 50(3), 294–298.
- Martyniuk, S., & Oroń, J. (2008). Populations of rhizobia in some Polish soils not planted with legumes. Ekologija, 54(3), 165–168. doi:10.2478/V10055-008-0025-x
- Marx, E., Hart, J. M., & Stevens, R. G. (1996). Soil test interpretation guide. USA: Oregon State University Extension Service.
- Matson, P. A., Parton, W. J., Power, A., & Swift, M. (1997). Agricultural intensification and ecosystem properties. Science, 277(5325), 504–509. doi:10.1126/science.277.5325.504
- Muluneh, A., Biazin, B., Stroosnijder, L., Bewket, W., & Keesstra, S. (2015). Impact of predicted changes in rainfall and atmospheric carbon dioxide on maize and wheat yields in the Central Rift Valley of Ethiopia. Regional Environmental Change, 15(6), 1105–1119. doi:10.1007/s10113-014-0685-x
- Muluneh, A., van Loon, E., Bewket, W., Keesstra, S., Stroosnijder, L., & Burka, A. (2017). Effects of long-term deforestation and remnant forests on rainfall and temperature in the Central Rift Valley of Ethiopia. Forest Ecosystems, 4(1), 23. doi:10.1186/s40663-017-0109-8
- Muñoz, G. R., Kelling, K. A., Rylant, K. E., & Zhu, J. (2008). Field evaluation of nitrogen availability from fresh and composted manure. Journal of Environment Quality, 37(3), 944–955. doi:10.2134/jeq2007.0219
- Nanos, N., Grigoratos, T., Martín, J. A. R., & Samara, C. (2015). Scale-dependent correlations between soil heavy metals and As around four coal-fired power plants of northern Greece. Stochastic Environmental Research and Risk Assessment, 29(6), 1531–1543. doi:10.1007/s00477-014-0991-3
- Nata, T., Bheemalingeswara, K., & Asmelash, B. (2009). Groundwater suitability for irrigation: A case study from Debre Kidane Watershed, Eastern Tigray, Ethiopia. Momona Ethiopian Journal of Science, 1(1), 36–58.
- Nedaw, D. (2010). Water balance and groundwater quality of Koraro Area, Tigray, Northern Ethiopia. Momona Ethiopian Journal of Science, 2(2), 110–127. doi:10.4314/mejs.v2i2.57678
- Nezami, M. T., & Alipour, Z. T. (2012). Preparing of the soil salinity map using geostatistics method in the Qazvin Plain. Journal of Soil Science and Environmental Management, 3(2), 36–41.
- Nielsen, D. R., & Bouma, J. (1985). Soil spatial variability. Proceedings of a workshop of the ISSS and the SSSA. 30 November–1 December 1984. (pp. 0016–7223). Las Vegas, USA: Pudoc, Wageningen.
- Nourzadeh, M., Hashemy, S. M., Rodriguez Martin, J. A., Bahrami, H. A., & Moshashaei, S. (2013). Using fuzzy clustering algorithms to describe the distribution of trace elements in arable calcareous soils in northwest Iran. Archives of Agronomy and Soil Science, 59(3), 435–448. doi:10.1080/03650340.2011.636356
- Nyssen, J., Poesen, J., & Deckers, J. (2009). Land degradation and soil and water conservation in tropical highlands. Soil and Tillage Research, 103(2), 197–202. doi:10.1016/j.still.2008.08.002
- Olsen, S. R. (1954a). Estimation of available phosphorus in soils by extraction with sodium bicarbonate. Washington DC. USA: US Department of Agriculture.
- Olsen, S. R. (1954b). Estimation of available phosphorus in soils by extraction with sodium bicarbonate. Washington: United States Department Of Agriculture.
- Paul, J. W., & Beauchamp, E. G. (1994). Short-term nitrogen dynamics in soil amended with fresh and composted cattle manures. Canadian Journal of Soil Science, 74(2), 147–155. doi:10.4141/cjss94-022
- Plante, A. F., Conant, R. T., Stewart, C. E., Paustian, K., & Six, J. (2006). Impact of soil texture on the distribution of soil organic matter in physical and chemical fractions. Soil Science Society of America Journal, 70(1), 287–296. doi:10.2136/sssaj2004.0363
- Reid, H., Faulkner, L., & Weiser, A. (2013). The role of community based natural resource management in climate change adaptation in Ethiopia. IIED Climate Change Working Paper No. 6, UK.
- Reid, R. S., Kruska, R. L., Muthui, N., Taye, A., Wotton, S., Wilson, C. J., & Mulatu, W. (2000). Land-use and land-cover dynamics in response to changes in climatic, biological and socio-political forces: The case of southwestern Ethiopia. Landscape Ecology, 15(4), 339–355. doi:10.1023/A:1008177712995
- Schmook, B., & Vance, C. (2009). Agricultural policy, market barriers, and deforestation: The case of Mexico’s southern Yucatán. World Development, 37(5), 1015–1025. doi:10.1016/j.worlddev.2008.09.006
- Schnitzer, M. (1982). Total carbon, organic matter, and carbon. Methods of Soil Analysis. Part, 2, 539–577.
- Schuman, G. E., Janzen, H. H., & Herrick, J. E. (2002). Soil carbon dynamics and potential carbon sequestration by rangelands. Environmental Pollution, 116(3), 391–396. doi:10.1016/S0269-7491(01)00215-9
- Sienkiewicz, S., Zarczynski, P., Krzebietke, S., Wierzbowska, J., Mackiewicz-Walec, E., & Jankowski, K. (2017). Effect of land conservation on content of organic carbon and total nitrogen in soil. Fresenius Environmental Bulletin, 26(11), 6517–6524.
- Slattery, J., Pearce, D., & Slattery, W. (2004). Effects of resident rhizobial communities and soil type on the effective nodulation of pulse legumes. Soil Biology and Biochemistry, 36(8), 1339–1346. doi:10.1016/j.soilbio.2004.04.015
- Smith, P. (2008). Land use change and soil organic carbon dynamics. Nutrient Cycling in Agroecosystems, 81(2), 169–178. doi:10.1007/s10705-007-9138-y
- Tadesse, G., Zavaleta, E., Shennan, C., & FitzSimmons, M. (2014). Prospects for forest-based ecosystem services in forest-coffee mosaics as forest loss continues in southwestern Ethiopia. Applied Geography, 50, 144–151. doi:10.1016/j.apgeog.2014.03.004
- Tekalign. (1991). Soil, plant, water, fertilizer, animal manure and compost analysis. Working document No. 13. Addis Ababa: International Livestock Research Center for Africa.
- Tekalign, T., Haque, I., & Aduayi, E. (1991). Soil, plant, water, fertilizer, animal manure and compost analysis. Working document(13)
- Tran, T., & N’dayegamiye, A. (1995). Long-term effects of fertilizers and manure application on the forms and availability of soil phosphorus. Canadian Journal of Soil Science, 75(3), 281–285. doi:10.4141/cjss95-040
- Urgesa, A. A., Abegaz, A., Bahir, A. L., & Antille, D. L. (2016). Population growth and other factors affecting land-use and land cover changes in north-eastern Wollega, Ethiopia. Tropical Agriculture, 93(4), 298–311.
- USDA. (1972). Soil survey laboratory methods and procedures for collecting soil samples. Washington, DC: US Department of Agriculture, Natural Resources Conservation Service.
- Walter, C., McBratney, A. B., & Douaoui, A. (2001). Spatial prediction of topsoil salinity in the Chelif Valley, Algeria, using local ordinary kriging with local variograms versus whole-area variogram. Australian Journal of Soil Research, 39, 259–272. doi:10.1071/SR99114
- Welsh, C., Tenuta, M., Flaten, D. N., Thiessen-Martens, J. R., & Entz, M. H. (2009). High yielding organic crop management decreases plant-available but not recalcitrant soil phosphorus. Agronomy Journal, 101(5), 1027–1035. doi:10.2134/agronj2009.0043
- WGEA. (2013). Land use and land management practices in environmental perspective. Morocco: SAI of Morocco.
- WRB, I. W. G. (2006). World reference base for soil resources 2006. World soil resources reports no. 103,132.
- Yimer, F., Ledin, S., & Abdelkadir, A. (2007). Changes in soil organic carbon and total nitrogen contents in three adjacent land use types in the Bale Mountains, south-eastern highlands of Ethiopia. Forest Ecology and Management, 242(2–3), 337–342. doi:10.1016/j.foreco.2007.01.087
- Yirga, G., Teferi, M., & Kasaye, M. (2011). Survey of medicinal plants used to treat human ailments in Hawzen district, Northern Ethiopia. International Journal of Biodiversity and Conservation, 3(13), 709–714.
- Zhang, P., Zhang, Y., Jia, J., Cui, Y., Wang, X., Zhang, X., & Wang, Y. (2019). Revegetation pattern affecting accumulation of organic carbon and total nitrogen in reclaimed mine soils. PeerJ Preprints.