
 ?Mathematical formulae have been encoded as MathML and are displayed in this HTML version using MathJax in order to improve their display. Uncheck the box to turn MathJax off. This feature requires Javascript. Click on a formula to zoom.
Abstract
The study was conducted in four zones (Sidama, Gedeo, Gamo Goffa and Wolayta) of South Nation Nationalities and Peoples Region (SNNPR) with the objective to assess coffee production constraints and opportunities at major coffee growing districts (Wereda) of the region. Two districts from each zone and two peasant associations from each district were selected for the study using multistage sampling technique. Total sample sizes of 161 households were interviewed to generate both qualitative and quantitative data. Data were analyzed by using SPSS software and descriptive statistics were implemented. The study indicated that about 98.1% of the respondents produce coffee as a major crop followed by maize (75.2%) and ˝enset˝ (68.3%). Coffee was identified as a primary source of cash in all assessed areas except Gamo Goffa where banana ranked first among cash crops. The most important constraints identified in coffee production system were clustered in to two major categories as biotic and abiotic factors that can be considered as agronomic and environmental. Among the biotic factors diseases, insect pests, weed species and vertebrate animals were identified as the most important ones. Recurrent drought, frost, fluctuating rainfall pattern, high humidity, high temperature, low moisture, hail, storm, wind and reduced soil fertility were among abiotic factors affecting coffee production that could cause as much as 70% yield loss. Immense opportunities for the production, marketing and processing of coffee in the studied areas were also identified. The existence of all weather road, convenient topography, fertile land, relatively good climatic condition, water bodies for irrigation, convenient government policy and support from agricultural offices were some of the opportunities discovered. Thus, based on the information obtained, it is possible for farmers (producers) to improve coffee production and productivity by solving the constraints and using possible opportunities in the study areas and locations with similar agroecologies.
PUBLIC INTEREST STATEMENT
Coffee consisted of 55% of the total expert earning and about 20% of the population depends on coffee for their lively hoods. But its production and productivity was affected by different factors: among which diseases, insect pests, weed species, recurrent drought, frost, fluctuating rainfall pattern, heavy rain, high humidity, high temperature, low moisture, hail, storm, wind and reduced soil fertility were identified as the most important ones. Despite the constraints immense opportunities were observed. The existence of all weather roads, convenient topography, land, relatively favorable weather, water irrigation and convenient government policy, and support from agricultural offices were some of the opportunities that can be used as an advantage for the improvement of coffee production. Thus it is possible to improve coffee production and productivity by solving the constraints and using possible opportunities in the study areas and locations with similar agro ecologies.
Competing Interests
The authors declare no competing interests.
1. Introduction
Ethiopia is the center of origin for highland coffea (Coffea arabica L), which is one of the most valuable cash crops in the country. It represents the major agricultural export crop, providing 20–25% of the foreign exchange earnings (ECFF, Citation2015). The coffee sector contributes about 4–5% to the country’s Gross Domestic Product (GDP) and creates hundreds of thousands of local job opportunities (EBI, Citation2014).
In Ethiopia, 764863.16 ha of land was allocated for coffee production and 494574.36 tones were obtained with average productivity of 0.64 tones ha‑1 in 2018/19 Meher Season from which 30% of the total production belongs to South Nation Nationalities and Peoples Regional State (SNNPR) (Central Statistical Agency [CSA], Citation2019). From top 25 coffee producing districts in Ethiopia, Oromia dominates with 18 coffee producing districts and the remaining top coffee producing districts are located in South Nations, Nationalities and Peoples Regional State (James et al., Citation2015).
Ethiopian coffee sector has bright prospects (Jose, Citation2012). The country has suitable altitude, optimum temperature, sufficient labor and fertile soil. It can sustainably produce and supply fine specialty coffee with potential of producing all coffee types of the various world coffee growing origins. Other opportunities of coffee production in Ethiopia are: high national and international demand for the product, increasing interest of private sector with high investment potential, high support by both regional and federal governments (Berhanu, Citation2017). Coffee, the backbone of Ethiopia’s economy, is the most important export commodity. During 2017/18 marketing year alone Ethiopia registered a record almost 917 million US dollars from coffee exports (United States Department of Agriculture [USDA], Citation2019).
In Ethiopia, coffee grows at various altitudes, ranging from 550 to 2,750 m above sea level. However, Arabica best thrives and produced between altitudes of 1,300 and 1,800 masl, annual rainfall amount ranging from 1,500 to 2,500 mm with ideal minimum and maximum air temperature of 15 and 30° C, respectively (MOA, Citation2013). Despite very high variability and large number of varieties released in the country most of the farmers still using their land races. Moreover, officially released varieties are also location specific. The average green coffee bean yield per hectare per year is 0.7 t ha−1 which is bay far lower than the world average and the average of Brazil 0.8 and 1.3 t ha−1, respectively (FAOStat, Citation2012). The total area coverage of coffee in Sidama, Gedeo, Wolayata and Gamo Goffa were 73030.04, 38487.25, 11913.82 and 5889.58 ha, respectively. The yield obtained per annum in Sidama, Gedeo, Wolayata and Gamo Goffa, respectively, were 50433.47, 21120.96, 5573.32 and 2634.27 tones with the average productivity of 0.64 t ha−1, which is still lower than the world average (Central Statistical Agency [CSA], Citation2016). This might be attributed to different physical, biological and manmade factors; one of which is the lack of high yielding varieties at the farmers’ hand. Biological and institutional factors also play greater role in coffee production. Diseases, insect pest, poor access to market information, lack of physical infrastructure, lack of improved coffee variety and poor extensions services were the major constraints of coffee production (Fekede & Gosa, Citation2015).
In addition, poor management practices, low soil fertility and poor pricing are considered as major constraints of coffee production. The changes in climatic conditions are also predicted to profoundly influence the population dynamics and the status of agricultural insect pests and diseases development. The increase in temperature has a strong and direct influence on insect development, reproduction and survival (Ward & Masters, Citation2007).
Coffee diseases cause considerable losses when not treated. According to Cerda et al. (Citation2017), 57% yield loss was observed by the infection of disease causing organisms on coffee crop. Jima et al. (Citation2017) also reported that the most economically important pathogenic coffee diseases are coffee berry disease (CBD), coffee wilt disease (CWD) and coffee leaf rust (CLR), and physiological disorder like coffee branch die back is caused by pseudomonas syringe and non-pathogenic agents. Similarly, CBD and branch dieback were causing high yield loss of coffee production. In the same way, insect pests such as Anthestia bug and coffee blotch miner are the major ones causing considerable damage. The assessment carried out in Eastern Ethiopia indicated that diseases and insect pests are causing considerable crop losses. CBD is major disease observed while CWD was considered as minor on few farmers’ coffee farms. Similarly, major insect pest that affects coffee production in Eastern Ethiopia were coffee stem borer and coffee berry borer. On the other hand, insect pests such as coffee trips, green scale and coffee cushion scale were reported as important coffee production constraints in the country (Fekede & Gosa, Citation2015).
A lot of coffee productions, processing and marketing problems assessments were made in Ethiopia. But they are not able to cover all coffee producing areas in the country in general and southern Ethiopia in particular. Thus this activity was carried out to cover untouched coffee producing areas of the southern Ethiopia and came up with possible solutions for the problems and recommendations for the opportunities. Hence agronomic, socio economical and environmental challenges and opportunity in coffee growing areas of Southern Regions of Ethiopia need to be studied, gap identified, documented for further utilization and recommendation of appropriate solutions. Thus this paper was aimed to compile the results obtained through the assessment of agronomic and social economic problems of coffee production at major growing districts of Sidama, Gedeo, Wolayta and Gamo Goffa Zones of SNNPR.
2. Materials and methods
2.1. Descriptions of the study area
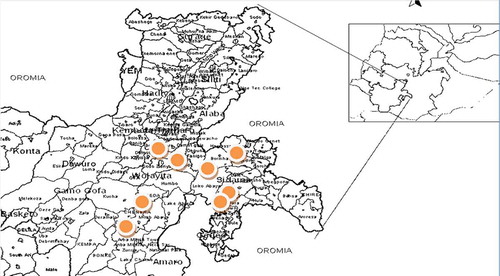
Field survey was conducted in four zones of the region: Sidama, Gedeo, Wolayta and Gamo Goffa. Sidama, Gedeo, Wolata and Gamo Goffa are located 285, 365, 385 and 515 km, respectively. The zone centers are Hawassa, Dilla, Sodo and Arbaminch, respectively (Figure ).
Figure 1. The study areas of coffee in southern Ethiopia (Yellow spotted areas are the place where the study was conducted
2.2. Sample size and sampling techniques
The study employed multi-stage sampling method. Districts and kebeles (PAs) were selected purposively in collaboration with zonal and district agricultural and natural resource management office based on coffee production potential. Accordingly, Dale and Loka Abaya from Sidama, Dilla Zuria and Wonago from Gedeo, Sodo Zuria and Humbo from Wolayata and Arbaminch Zuria and Mirab Abaya from Gamo Goffa were selected. The districts were selected from higher (1,800–2,000 masl) and lower altitude of coffee growing districts (1,200–1,800 masl). The kebeles (PAs) from each district selected purposively (Table ). About 10 farmers from each PAs and a total of 161 households were selected from all districts by simple random sampling method.
2.3. Data sources, method of data collection and data analysis
2.3.1. Data source
The study utilized both primary and secondary data sources. Primary data was conducted by using structured questioner and GPS supported field observation in the form of survey.
2.3.2. Method of data collection
The questioner was pre tested and validated before the inception of actual work. The secondary data was collected from unpublished and published documents of zonal and district agricultural and natural resource management offices. General information of the respondents like sex, age, marital status, educational level, family size and number of family members engaged in agriculture; crops grown in the study area; coffee production system like varieties produced and experience of implementing improved practices, area covered by coffee crop, age of coffee trees own by individual farmers; coffee production problems like biotic factors such as disease, insect pests, vertebrate animals, common and invasive weeds, abiotic (environmental factors) such as drought, rainfall, soil fertility, wind, flooding, etc.; technical constraints and their management techniques were collected. Agro meteorological data was obtained from the nearby station of Ethiopian meteorological agency. Disease, insect pest identification and weed identification were made by collaborative work of farmers and experts from office of agriculture. Some data were collected from secondary sources to strengthening the observation.
2. Data analysis
Data were analyzed by using SPSS software version 12 developed by Morgan et al. (Citation2004). Descriptive statistics such as mean, Mode, Median, frequency distribution and percentage were employed to understand socio-economic situation, constraints and opportunities of coffee production in the studied areas based on the data type.
Mode is the value that appears in the data more frequently.
Median is the most middle value when the data is arranged in descending or ascending order.
Frequency is the number of times that each data appear in the observation.
Percent is the proportion of a given observation divided by a total number of observations and expressed in hundredth.
3. Results and discussion
3.1. General information of the respondents
3.1.1. Area studied
As shown in Table , the study was conducted in Sidama, Gedeo, Gamo Goffa and Wolayta Zones. In Southern Ethiopia, they are known in coffee production, processing and marketing. In Sidama, 73030.04 hectares of land was covered by coffee with the total production of 50454.44 tones of clean coffee and productivity of 0.89 t ha−1. Gedeo produces a total of 24121.0 t ha−1 clean coffee on 38487.3 hectares of land with the productivity of 0.63 t ha−1. Wolayta and Gamo Goffa allocated 11913.8 and 5889.6 hectares of land for coffee production, respectively. From these areas of land about 8207.6 tonnes of clean coffee with the average productivity of 0.46 t ha−1 was obtained (Central Statistical Agency [CSA], Citation2018).
Table 1. Description of the assessed areas
3.1.2. Sex, age, marital status and educational level
About 95% of the responding farmers were male and most of them were married (97.5%). This value slightly varied with the location. In Sidama, Gedeo, Wolayta and Gamo Goffa, 95%, 97.6%, 92.5% and 95% of the respondents, respectively, were male. All the respondents in Sidama and Wolayta but 97.6% and 92.4% in Gedeo and Gamo Goffa, respectively, were married. The respondents were found with the age ranges 20–70 years. Nonetheless the higher proportion of the respondents was included in the age range of 30–40 years (Table ), which is under the cluster of working age group (OECD, Citation2020). In the same way, about 95.7% of the respondents were educated. This indicated that majority of coffee producers in the study area were educated which in turn could help to boost production and productivity of coffee. The value of educational level varied with the location (Table ) as Sidama and Wolayta zones comprised the highest proportion of educated person above grade 8 (37.5%) followed by Gedeo. This might be the contribution of construction and expansion of educational institutes in the region. Education is very important factor which helps farmers to understand and implement the information received from any direction (Jima et al., Citation2017).
Table 2. Sex, age and marital status composition of the respondents across locations
Table 3. Educational level of the respondents across locations
3.1.3. Family size of the respondents
Family size of the respondents ranged from 7.2 to 9.1 with the higher family size in Sidama (9.1) followed by Gedeo (8.2). Gedeo and Wolayta had almost the same average family size of 8.2 and 8.1, respectively. The family size of Gamo Goffa was a bit lower than the other locations. On average the family size per family of coffee producing areas of Gamo Goffa was 7.2, which were by two units lower than Sidama and by one unit lower than Gedeo and Wolayta Zones (Table ). These values are higher than the average house hold family size of the country, 4.6 persons per family (United nations [UN], Citation2017; Demographic and Health Survey [DHS], Citation2017). However, in the present finding the family size recorded is higher than the family sizes reported from Wolayta, 5–7 per family (Tesfatsion (Citation2016), and from Sidama the average household size of 5.87 per family (reported by Nigatu & Barbara, Citation2011). Similar study was conducted by Jima et al. (Citation2017) in Oromia region of Aris Zone reported a family size of 2–18 with mean and standard deviation of 7.96 and 3.13, respectively (Jima et al., Citation2017).
Table 4. Average family size of the respondents
3.1.4 Family members engaged in agriculture
In all assessed locations, all family member engaged in agricultural activity either as full time or as part time. In all locations, two of the family members were fully engaged on agricultural activity, which accounts for 55%, 58.5%, 50% and 70% for Sidama, Gedeo, Wolayta and Gamo Goffa zones, respectively. Whilst the rest of the family members with the exception of under aged kids (less than 5 years old) engaged in agriculture as part time work. Under this cluster in Sidama, three of the family members (25%); in Gedeo, Wolayta and Gamo Goffa zones two of the family members with the proportion of 22%, 12.5% and 15% engaged in agricultural activities as a part time work (Table ). This maximized the use of family labour in agricultural activity and reduces labour cost that perhaps would have encored employed with higher price which has great impact on coffee production. Susana (Citation2006) reported that the comparative advantage of smallholder families for labour intensive production is unremunerated family labour and family labour is an important source of manpower in agriculture. While small coffee plantations are able to cope with the scarcity of agricultural labour by a substitution of family labour, medium and large coffee plantations are facing distinct problems to fetch manpower resources, putting the viability of the sector at stake (Akarsha & Hartmann, Citation2009).
Table 5. Proportion of family members engaged in agriculture as full time and part time
3.2. Major crops grown in coffee-based farming system
A number of annual and perennial crops are produced for cash and family consumption in assessed areas. Among which, avocado, banana, bull heart (Annona escumous), cabbage, carrot, cassava, Chat, chick pea, common bean, Enset, ginger, kale, kororima, maize, mango, Papaya, peach, pepper, potato, sugar cane, sweet potato, taro, teff, tomato and yam are the most common ones produced in the assessed areas. Although the range of diversity of the crops produced varies with the agroecological condition, the farming system can be seen as diversified production system (Table ). Similar observation was made in Oromia which is the neighboring region of the study area where sampled respondents stated that coffee was intercropped with different annual crops such as Maize (69.8%), Sorghum (20.7%), Potato, Onion, Hot Pepper, Groundnut, Sweet Potato, Teff and Tomato were accounted for the remained percent (Jima et al., Citation2017). Fikadu et al. (Citation2015) also indicated major crops produced intercropped with coffee in Sidama, Wolayta and Gamo Goffa zones.
Table 6. Major crops produced in Sidama, Gedeo, Wolayta and Gamo Goffa zones
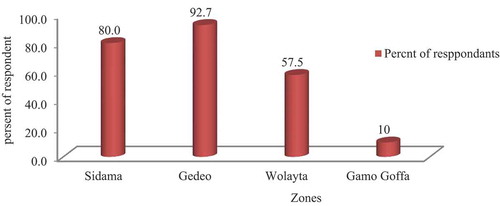
Most of the crops produced in the assessed areas were used for home consumption with very few exceptions. In Gamo Goffa, most of the farmers (60%) produced banana (Ba1) as a source of cash followed by coffee (Co1) (10%) from which they could earn about 7,200 birr per house hold (CSA, Citation2016, Alemu, Citation2017). Unlike Gamo Goffa, coffee stands the primary source of cash in, Sidama, Gedeo and Wolayta accounting for 80%, 92.7% and 57.5% of the total interviewed farmers respectively. Small proportion of farmers used khat (ch1), maize (Ma1), avocado (AV1), common bean (CB1), pigeon pea (Pp1), taro (Ta1), teff (Te1), cotton (Cot1), mango (Man1) and sweet potato (Sp1) as primary sources of cash (Figures –). The finding also confirmed the report made by Worako et al. (Citation2015) that 94.32% of household income of Sidama belongs to coffee. Wolassa (Citation2013) who stated that coffee has been the major source of income for the rural households in the coffee producing regions of Sidama. Gurmu et al. (Citation2015) reported that the primary source of income in Sidama, Wolayta and Gamo Goffa was crop production that accounts for 83.3% of the total production.
Figure 2. Crops used as a primary source of cash in Sidama
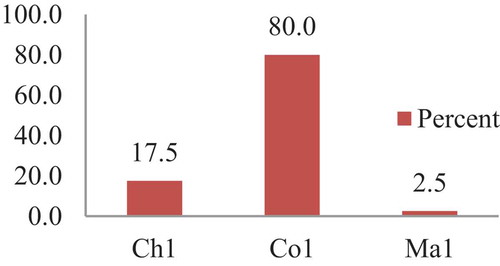
Figure 3. Crops used as a primary source of cash in Gedeo.
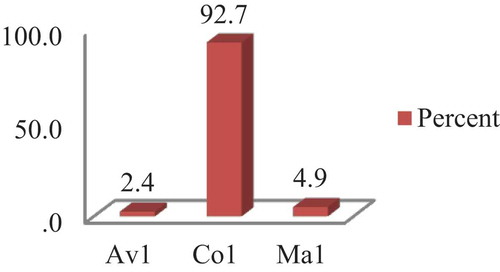
Figure 4. Crops used as a primary source of cash in Wolayta
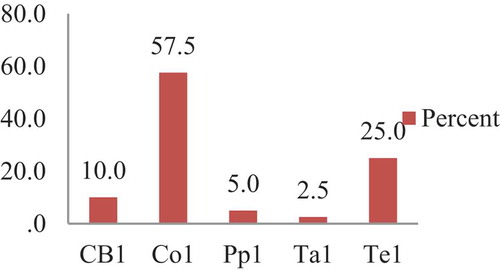
Figure 5. Crops used as a primary source of cash in Gamo Goffa
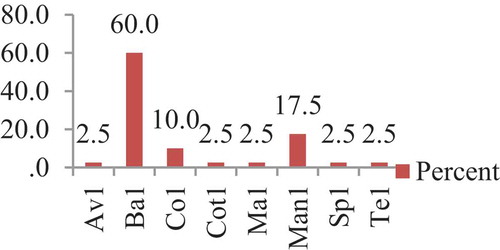
Figure 6. Percent of respondents that produces coffee as a primary source of cash
3.3. Coffee production
3.3.1. Composition of coffee varieties and improved agronomic practices implemented
The assessment result indicated that about 95%, 53%, 100% and 70% of the respondents in Sidama, Gedeo, Wolayta and Gamo Goffa, respectively, produce improved coffee varieties. However, a great proportion (66%) of farmers was producing both improved and local varieties with the range of 40% in Gamo Goffa to 98% in Wolayta (Table ). This might be due to the peculiar behavior of local varieties. The local coffee variety development strategy (Bayetta Belachew & Labouisse, Citation2006) identified coffee varieties that can be known by their natural resistance to major diseases, high yielding performance and peculiar quality and typicity (Desse Nure, Citation2008). Lack of seed of improved varieties is one of the most important problems in coffee production. Unlike other crops, there is no any public and/or private sectors responsible to produce and market coffee seeds. Moreover, there is no national coffee seed standard and certification scheme (Taye, Citation2013).
Table 7. Proportion of farmers (%) producing improved, local and both coffee varieties (N = 161)
Most frequently produced coffee varieties were 74,110 and 74,112 with the mean number of 612, 625 and 150 trees per house hold in Sidama, Gedeo and Wolayta, respectively (Figure ). In Gamo Goffa, the name of improved varieties either expected to be changed in to other local or the varieties were not introduced to the area. The mean number of trees of the so called improved varieties in Gamo Goffa was 52.5 head−1. The bean yields improved varieties in average was 3.7, 4.48, 3.11 and 2.0 t ha−1 in Sidama, Gedeo, Wolayta and Gamo Goffa, respectively (Table ). Yield variation might be due to the difference in agroecological condition of respected locations and variation of the type of coffee varieties produced and management differences provided.
Table 8. Improved varieties performance
In line with this, all respondents confirmed that they were producing locally known coffee varieties in their farm lands. But the performance and the yield was completely lower than the yield obtained from improved varieties (Table ). The number of trees of local varieties planted per head on average was 590.8, 622.5, 89.1 and 41.37 in Sidama, Gedeo, Wolayta and Gamo Goffa, respectively. The average performance of local varieties in Sidama, Gedeo, Wolayta and Gamo Goffa, respectively, was 2.2, 3.42, 1.55 and 1.52 t ha−1 (Table ) which are significantly lower than improved varieties to the respective locations.
Figure 7. Mean number of improved coffee trees produced per head: top left Sidama, top right Gedeo, bottom left Wolayta and bottom right Gamo Goffa Zones
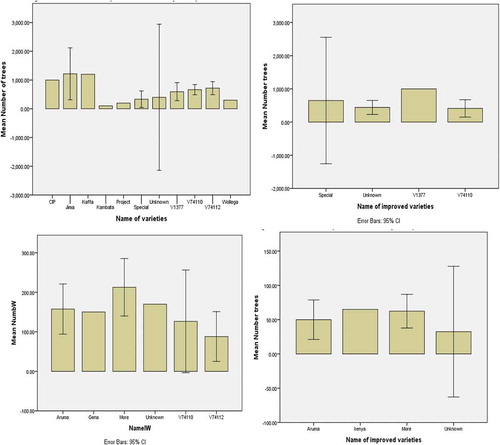
Table 9. Local coffee varieties produced in Sidama, Gedeo, Wolayta and Gamo Goffa
3.3.2. Implementing improved practices
The production and productivity of farmers’ variety and cultivars can be improved by using improved agronomic and best management practices (Taye, Citation2014). Most of the farmers responded that they were using combination of improved practice such as compost preparation and application (Co), mulching (Mu), intercropping (Ic), pit preparation 2 months before transplanting (Pi), correct spacing (Sp), row planting (Rp), appropriate shade tree planting (Sh), stumping and on time weeding. But a great deal of farmers in Gedeo (26.8%), Wolayta (17.5%) and Gamo Goffa (62.5%) were not using improved practices for their coffee production (Table ). This might be the lack of awareness creation works and information on improved practices that are employed to improve the production and productivities of coffee in the area. The opposite was observed in case of Sidama where combinations of practices were employed. Experience of Sidama farmers can widely be practices in the rest of coffee producing areas of the region.
Table 10. Proportion of farmers using improved practice in Sidama, Gedeo, Wolayta and Gamo Goffa
The farmers developed 3–14 years of experience on implementation of improved practices. Among the improved practices intercropping with compatible crops is the most important one. Taye (Citation2013) showed on his paper that coffee is intercropped with other companion crops or leguminous shade trees in complex agro forestry systems as low-cost production options to diversify food and cash security. In spite of the presence of improved technologies in the country, the lack of information restrains the farmers from using them. The assessment made in Uganda indicated that 30% of the farmers had no or little information with regard to improved coffee varieties (Mukadasi, Citation2019).
In the studied areas, the use of both organic and mineral fertilizers is either nil or very limited to some production systems (e.g., large commercial plantations). Evidence from decades of research in the country indicates that nutrient inputs (from both organic and inorganic sources) can boost productivity and quality of coffee if used in appropriate balance and rates (Solomon, Citation2014). However, in Gedeo, Wolayta and Gamo Goffa most of the time there was no tradition of application of inorganic fertilizers (Table ).
Table 11. Mean number of years during which improved practices employed in Sidam, Gedeo, Wolayta and Gamo Goffa
In all the investigated zones, no one is using any pesticide except unknown doses of Diconyl and Octave, and unknown herbicide and fungicide provided by the then coffee improvement project (CIP) before 28 years in one of Sidama districts. Since then coffee disease and insect pests were managed only by using cultural practices. This indicates Ethiopian coffee produced and delivered to the world market is organic as it’s free of any chemicals for disease, insect and weed management. Similar reports were made by Taye and Tesfaye (Citation2002).
3.3.3. Irrigation, source of water and method of application
Proportion of farmers using both full and supplementary irrigation varies with location, source and availability of water, and rainfall pattern. In Sidama, no one was applying full irrigation for coffee production but about 25% of the farmers responded that they were using supplementary irrigation from rain water harvesting pond, flood and river for seedling development, stabilizing longer dry period and supplement younger trees which otherwise dried up due to low moisture stressed duration. Using watering can for irrigation was reported as the most common method of supplementary irrigation as it was frequently used in coffee nursery followed by flooding. Very few farmers (2.5%) were using water pump (Table ). The use of supplementary and full irrigation most of the time depended on the source and sustainability of water sources. For example, Abiyot and Zemede (Citation2014) reported that houses located close to perennial streams usually have their gardens situated at the back side and adjacent to the water way for ease of irrigation.
Table 12. Proportion of farmers using either full or supplementary irrigations
Similarly, supplementary irrigated coffee production system was implemented in Gedeo. Most of the farmers (87.8%) were rainfall dependent as the area receives about 1129 mm (mill meter) of rainfall per annum (https://en.climate-data.org) which is the optimum amount that coffee requires for normal growth and yield (Coste, Citation1992). However, 12.2% of the farmers were using supplementary irrigation sourced from rain water harvest and rivers. The water was applied by using can irrigation method, drip irrigation (plastic water bottle) and water pumping system for seedling development so as to supplement younger trees and coffee trees during very dry period (Table ).
In Wolayta, unlike Sidama and Gedeo, only 7.5% and 47.5% of the respondents confirmed the implementation of both full and supplementary irrigation for coffee production, respectively. The common sources of water for irrigation were river and rain water harvesting ponds for seedling development, irrigating the whole field during longer dry period and supplementing younger trees (Table ). In Gamo Goffa, 100% of the respondents confirmed that coffee crop was produced by using both full (62.5%) and supplementary (40%) irrigations. Most of the water was obtained from the nearby rivers and the crops were irrigated during seedling development by using flooding and motor pumping.
As a whole, in the investigated areas, practices of using irrigation for coffee production was lower which might be one of the most important causes for lower coffee yield (Table ). If applied it could be possible to obtain higher yield as reported by united. The report stated that the development of drip irrigation and low-pressure pivots has made it possible to regularly achieve high crop yields (UN (United Nation), Citation2008).
Table 13. Proportion of farmers using either full or supplementary irrigations for their coffee production (All Zones N = 161)
In the presence of low moisture stress, some of moisture conservation methods like mulching, shading, terracing, trenching and micro basins either alone or in integrated way were implemented. Among which the most commonly used moisture conservation methods were combination of mulching and shading (47.5%) followed by mulching alone. But 7.5% of the respondents were not using any of the moisture conservation methods (Table ). Applying intensive agronomic practices such as irrigation, pruning, mulching and maintenance of shade at optimum level alleviate the problem of low moisture stress (Belete, Citation2014)
Table 14. Moisture conservation method, type of coffee sold, harvesting method, processing and storage (n = 161)
As shown in Table , most of the farmers (47.5%) used to sell freshly harvested and dried beans. But only 2.5% of the farmers responded that they were selling dried coffee beans. Other 50% of the farmers used to sell freshly harvested, dried and pulped coffee depend on the urgency of the need of income. Harvesting was carried out by one by one hand picking of ripped beans (57%) followed by combination of hand picking, sweeping from branches and collecting from ground (20%). As far as processing and storage were concerned, about 77% of the respondents were using raised bed lined with polyethylene sheet for drying coffee beans and store in Jute sack (62.5%) followed by bamboo basket (20.8%).
3.4. Coffee production problems
Coffee production problems are those factors that negatively affecting production and productivity of coffee. The problems could be seen as biotic, abiotic and technical in their very nature. Biotic factors included disease, insect pests, weeds and vertebrate animals. Abiotica factors were highly related to the agroclimatic condition such as recurrent drought, high rain, low moisture stress, high incidence of sun rise, frost and others. Those factors listed as technical challenges were lack of improved varieties, lack of remedies for coffee disease and insect pests, and weak linkage with the central market.
3.4.1. Biotic factors
3.4.1.1. Coffee diseases
Bacterial blight of coffee (BBC), CBD, CWD, coffee leaf blight (CLB), CLR, coffee stem drying disease (SD), leaf drier (LD) and leaf spot (LS) are most common diseases in the investigated areas. According to the respondent farmers, the most important coffee diseases challenging the production were CBD, CWD, BBC and stem drying diseases. They occur as a complex in combination or as a single incidence (Table ). About 35% of the total farmers reacted that they were challenged by CBD followed by the CWD (17.6%) and complex occurrence of both CBD and CWD (10.9%). But 9.2% of the respondents were not suffering from any coffee diseases.
Table 15. Disease incidence and distribution across locations
The distribution and effects of the diseases on the performance of coffee varied with the environments. Wider distribution and complex of coffee diseases were found in Sidama followed by Gedeo. In Wolayata, there was comparably higher CBD and CWD and their complex. Unlike other zones, coffee disease pressure was lower in Gamo Goffa as 73% the respondents confirmed that there is no any coffee disease problem. But about 13% of the farmers responded that presence of CBD and 14% confirmed the presence of CWD, CSC, DB, LS and their complex (Table ). According to Teferi and Belachew (Citation2018), these are common diseases in Sidama and Gedeo Zones. They indicated that coffee suffers from a range of diseases including CBD, CWD and CLR caused by Colletotrichum kahawae, Gibberella xylarioides and Hemileia vastatrix, respectively. BBC and coffee thread blight which is caused by Pseudomonas syringae pv garcae van Hall and Corticium koleroga, respectively, becomes an emerging constraint in Sidama and Gedeo Zones. Kumulachew et al. (Citation2016) reported about 30% of national average crop losses to total harvestable coffee yield due to CBD. Similar report was also written by Holger and Omondi (Citation2010) that CLR incidences in Ethiopia were present in all regions. CBD was presented mostly in Bonga (40.0%) and Yayu (26.3%), but less frequent in Harenna (18.6%) and Berhane-Kontir (6.0%).
3.4.1.1.1. Farmers’ disease management practices
Even if different integrated method could be used to control the disease, coffee production system in Ethiopia would not allow the use of chemical. So that farmers were using cultural methods to manage it and other diseases.
Among which application of ash, mulching, cutting infested tree and burning (CUBU), uprooting the infested tree and burning (UPBU), farm tools disinfection by fire, planting resistant varieties were frequently used methods. However, most of the farmers (24.1%) stated that they had no idea of managing CBD in their coffee field. Equal proportion of farmers was controlling by using uprooting infested tree and burning in a place away from coffee farm. But very few farmers were using combination of cultural practices to manage CBD (Table ). In the same manner, BBC was said to be managed by using cultural methods like cutting and burning the infected trees/tree parts, disinfecting farm tools, pruning infested branches, cleaning farm tools and uprooting infected trees followed by burning the uprooted trees. Among the management options most frequently uprooting and burning (45.5%) implemented to control/prevent BBC followed by farm tools disinfection and cleaning (18%) each. Uprooting and burning was still considered as the best method of managing CWD in Sidama, Gedeo, Wolayta and Gamo Goffa Zones according to 55.7% of the respondents of interviewed areas. But still 24.6% of the farmers had no idea of managing the disease. Dieback was also mentioned as one of the most important disease in Sidama, Gedeo, Gamo Goffa and Wolayta. According to the interviewed farmers, 42.9% of the farmers implemented UPBU and 14.3% were using CUBU to manage the disease.
Table 16. Farmers practice to control/manage coffee berry disease (CBD)
Other diseases like LS, leaf rust (LR), leaf blight (LB), coffee stem canker (CSC) were considered as minor diseases that could easily be controlled by using mulching, composting and field sanitation. But most of the farmers had no knowhow of controlling the diseases (Table ). It was reported that using resistant varieties for CBD (Gimase et al., Citation2019), disinfect machetes after cutting every diseased coffee tree, dig out all parts of diseased coffee tree and burn it at the spot (Zinabu et al., Citation2017).
3.4.1.2. Important insect and pests of coffee
The most common insect pests affixing coffee in investigated areas were anthestia bug, black ant, cut worm, leaf minor, fruit fly, mealy bug (white and black), red ant, spider, stem borer, termite, weevil and unknown insects. Among which stem borer was the most important and common insect pests in all investigated location with some exception as it was supper stated in Wolayta by termite. The distribution of insects varies with locations as anthestia bug was commonly found in Sidama, Gedeo and Wolayta; mealy bug was common for Sidama and Wolayta; and termite, black ant and weevil were common for Wolayta and Gamo Goffa zones. But most of the farmers (35.3% and 87.8%) in Sidama and Gedeo respectively reported that insect pest was no more a problem on coffee production. Unlike Gedeo in Sidama Stem borer was reported as the most devastating insect pest followed by Mealy bug (17.6%) and cut warm (13.7%). Similar results were reported by Fekadu et al. (Citation2016) as coffee berry borer was found the leading pest examined during their study conducted Gedeo Zone. Even if they were not as devastating as coffee diseases, insect pest caused higher proportion of crop damage/yield loss (Table ). On average about 14% of coffee yield loss was caused by the infestation of a crop by insect pests (Figure 8). Losses due to coffee pests are estimated to be 13% worldwide (Nyambo & Masaba, Citation1997) while in Ethiopia yield loss due to some insect pests such as Anthestia bug was reported to be 9% (Girma et al., Citation2008). Similarly, coffee blotch leaf minor was found to cause severe defoliation of coffee plant. However, Esayas and Chemeda (Citation2007) reported that it never causes considerably yield loss.
Figure 8. Yield loss (%) due to important insect pests
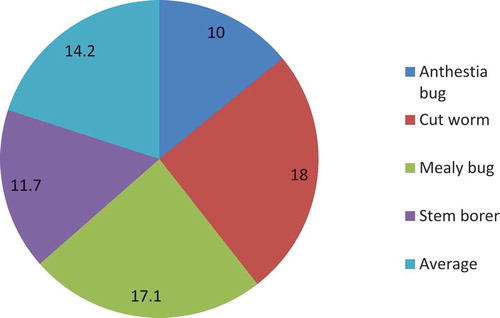
Table 17. The most important insect pests investigated in Sidama (Dale and Loka Abaya), Gedeo (Dilla Zuria and Wonago), Wolayta (Sodo Zuria and Humbo) and Gamo Goffa (Arbaminch Zuria and Mirab Abaya) Zones
3.4.1.3. Invasive and common weeds
3.4.1.3.1. Invasive weeds
No more invasive weeds were observed in the coffee fields of Sidama, Gedeo, Wolayta and Gamo Goffa Zones. But two devastating and widely spreading types of invasive weeds were found in the study areas: except parthenium and oxalis (Table ). Among the respondents, 40.4% confirmed their existence while the rest replied that there was no any invasive weed in coffee production system. Parthenium weed was first reported from Ethiopia at Dire-Dawa, Harerge, eastern Ethiopia in 1988. A second major center of infestation was subsequently found near Dese, Welo, North Eastern Ethiopia. Parthenium weed seeds were believed to be imported from subtropical North America as a contaminant of grain food aid during the 1980s famine, and distributed with the grain (Matthew, Citation2015). Oxalis is a perennial ground cover which originated from Southern America and grows in both full sun and shade if the area receives adequate moisture. The plants themselves do not spread far by stolen or rhizomes, but seed of O. corniculata have evidently been carried long distances by human agency, either deliberately or accidentally. As a perennial weed and the presence of underground stolen made it difficult to manage in farm fields. In Ethiopia, it was found in the cereal fields, but currently the weed affects coffee farm lands too. It reduces crop vigour and yields, act as an alternative host to diseases rusts, compete for nutrients and light with crops and Labour intensive (Center for agriculture and biodiversity international [CABI], Citation2018).
Table 18. Invasive weeds proportion in the study areas
3.4.1.3.2. Weeds
Weeds have great harmful impact on the production system, yield and quality of coffee. It was observed that most of the surveyed weeds disturb harvesting, suppress seedling growth, reduce yield, dry soil and harbor disease causing organisms and insect pests. But most of them can easily be managed by frequent cultivation, exposing seed bank to sun by implementing offseason ploughing, mowing and hand weeding. As shown in Table , some of common weeds in the coffee farm and their relative composition. The most important common weeds identified in the coffee farms of selected districts of Sidama, Gedeo, Wolayta and Gamo Goffa Zones were Cyperus spp (20%), Ajaratum (17%), Commelena (15%), Nicandira (11%) and others (36%). Nyabundi and Kimemia (Citation1998) reported Digitaria abbisinica (Couch grass), Commelina benghalensis (Wondering Jew), Cyperus rotundus L.(Nut grass), Cynondon dactylon (Stargrass), Pennisetum clandestinum (Kikuyu grass) as some of common weeds reducing production and productivities of coffee. Coffee Research Foundation (CRF, Citation2003) also stated that the yield losses due to weed effects can be over 50%. Thus they must be managed appropriately whenever they appear in the field.
Table 19. Common weed types in coffee farms combined over locations (Sidama, Gedeo, Wolayta and Gamo Goffa)
Despite the presence of many options to manage coffee weeds, farmers were using common practices to control their negative effects. The most important management lists were frequent cultivation and hand weeding, exposing seed bank to open sun through hoeing and uprooting the weed and burring so as to minimize seed bank (Table ). Habtamu (Citation2015) has reported that the most commonly practiced weed control methods include manual, mechanical cultivation and use of herbicides or integrated weed management (IWM) depending on the availability and farming system.
Table 20. Common weeds, their effect and management options
3.4.1.4. Vertebrate pests on coffee
Vertebrate pests were not common on coffee production in selected areas of Sidama, Gedeo, Wolayata and Gamo Goffa with some exceptions. The pest type and devastation status varied with location. Among vertebrate pests coffee bean eating birds were the most important one in Gamo Goffa (52.5%) followed by Wolayta (22%) and Sidama (10%). In Gedeo, as the response of the farmers, the most important vertebrate pest was ape (16%) followed by monkey (8%) and Columbus monkey (8%). In Sidama, Gedeo, Wolayta and Gamo Goffa, 90%, 64%, 78%, 47.5% of the respondents, respectively, indicated that there was no any problem of vertebrate pests affecting the production of coffee (Table ). Unlike other crops, the damage caused by vertebrate pests on the yield and performance of coffee can said to be very minimum. They are also can be managed easily by chasing them away (Table ). Parvatha (Citation2010) also has shown that birds viz. small green barbet and red whiskered Babul (pycnonotus jocosus) cause economic damage to coffee. These birds feed only on ripened coffee berries. They punctured the pericurp and siphoned sweet contents and dropped the husk and seeds on the ground. Monkeys also cause economic damage to coffee by feeding on sweet, succulent and palatable stem tissue of young plants. Both birds and monkeys can easily be scared by using trained dogs.
Table 21. Vertebrate animals that affect the production of coffee, damage caused by them and management options
3.4.2. Abiotic factors affecting coffee production
The most important abiotic factors affecting the production and productivity of coffee at the surveyed areas were drought, reduced soil fertility, heavy rain, snow and frost which cause singly and/or in combination, great devastation such as flower abortion, fruit quality reduction, wilting, enhanced alternate bearing, aggravate berry disease and others (Table ). Other abiotic problems like wind, high temperature, low moisture stress, moisture shortage especially at flowering stage were considered as important but cause minor effect on coffee production (Table ). The same result was reported by Ngasoh et al. (Citation2019). They indicated that abiotic stresses on plants like temperature, flooding, drought and salinity affect crop production heavily, as they cause stunted growth, affects plant metabolism and thus reducing crop yield by as much as 70%. But can be managed by using different methods like mulching, composting, providing irrigation, etc. (Table ). The same result was reported by Arun-Chinnappa et al., Citation2017; Hassanuzzaman et al., Citation2010; Hassanuzzaman et al., Citation2013 ; Wahid et al., Citation2007. Abiotic stresses can be managed by genetically improving the genes and transcription factors, or by employing cultural practices which includes modification and adjustment of planting time and crop density in the field so as to contain the effect of these abiotic stresses. Another method is to apply phyto-hormones, signaling and trace elements, applying osmo-protectants (Wahid et al., Citation2007; Hassanuzzaman et al., 2010), modifying planting time and adjusting the compactness of plants cultivated to evade stress situations (Arun-Chinnappa et al., Citation2017; Mirza et al., Citation2013).
Table 22. Abiotic factors damaging coffee production, effect and cropping mechanism
3.5. Intervention areas for further improvement of coffee production
Supply of improved, early maturing and disease resistant varieties were considered the critical point of intervention in which the famers believe to improve coffee production and productivity followed by provision of technical trainings (Table ). About 14.5% of the farmers considered the provision/on time supply of improved farm tools believed to improve coffee production in the interviewed areas. But few of the requested farmers (2.8%) needed chemicals for disease and insect pest control.
Table 23. Points for further improvement/intervention areas
Despite the presence of different problems in the course of the production of coffee in the studied areas, there exist varieties of opportunities (Table ). The presence of all weather road, convenient topography, fertile land, good climatic conditions, good government policy, support from agricultural office, irrigation cannel, presence of market access, presence of NGOs for support, safe market, sufficient labour, sufficient land, sufficient rainfall, sufficient water for irrigation and village crossing rivers were mentioned as some of opportunities that can be used for further improvement of production and productivity of coffee in the studied areas. Jima et al. (Citation2017) have conducted the same study in Arsi Zone, Oromia regional state and came up with the most important opportunities that can be utilize in the future so as to boost coffee productivity. The mentioned construction of rural road, proximate to Agricultural Research Center and availability of coffee plantation enterprise in the area were among major opportunities for coffee production. They also indicated that developing of improved coffee varieties, enhancing extension services to improve farmers’ skill and knowledge on coffee production system, improving coffee marketing condition, and enhancing infrastructural and institutional facilities were among important factors to improve coffee production and productivity, and thereby improving livelihoods of coffee producers in the study area.
Table 24. Opportunities of coffee production at the interviewed areas
4. Summary and conclusion
Lack of improved cultivars, unavailability of improved production technologies, physiological problems like die back and minimum or no use of agricultural inputs by small holder is also important factors for low coffee yield. Moreover, Ethiopian coffee is inferior in yield to other producers, which is mainly because of backward cultivation and harvesting system.
Effective supply of agricultural inputs, such as planting improved varieties, fertilizers, insecticides, at affordable prices, should be encouraged. However, the use of both organic and mineral fertilizers is either nil or very limited to some production systems (e.g., large commercial plantations). Evidence from decades of research in the country indicates that nutrient inputs (from both organic and inorganic sources) can boost productivity and quality of coffee if used in appropriate balance and rates.
CBD still cause significant crop losses on susceptible landraces although the magnitudes vary from place to place and from time to time. Thus phytosanitary measures such as regular field monitoring, uprooting and burning and/or burring infected plant should be taken seriously in to account as there was no any scientifically approved measures so as to manage most of coffee diseases. Strong efforts should continue to aware and sensitize and intensively train coffee farmers and extension workers about the diseases and their management through practical training.
It can be recommended that testing the adaptability of improved coffee verities that tolerate major disease and drought, generation of new varieties for the areas, enhancing extension services to improve farmers’ skill and knowledge on coffee production system and risk alleviating mechanisms, testing soil fertility and developing soil fertility mechanisms, establishment of market places in the vicinities of producers, strengthening and/or establishment seed producing institutions found to be vital to motivate coffee producers and increase coffee production and productivity in the study area and areas with similar situations.
In general solving biotic (disease, insect pest, weed and vertebrate animals), abiotic (drought. soil fertility reduction, frost, heavy rain, etc.) problems and by exploiting production, infrastructural and technical opportunities, the production and productivity of coffee can be improved alarmingly in the study areas and areas with similar agroecological conditions.
Correction
This article has been republished with minor changes. These changes do not impact the academic content of the article.
Declaration
I declare that the manuscript is mine and I am the principal investigator and one of the authors.
Acknowledgements
The author would like to thank South Agricultural Research Institute (SARI) and Hawassa University for the support of this research.
Additional information
Funding
Notes on contributors

Tesfaye Tadesse
Tesfaye Tadesse is a researcher in South Agricultural Research Institute (SARI) Hawassa Agricultural Research Center, Crop research process, Hawassa, Ethiopia. He has conducted several research activities related to root and tuber crops, and coffee improvement. In the course of the research, he is able to release more than 10 root crop varieties and coffee management options. He has also an experience in collaborating research with national and international projects. He has an interest in conducting research and research management. More than 25 papers were published by him.
References
- Abiyot, B., & Zemede, A. (2014, March, 14-15). The role of home gardens for conservation and sustainable utilization of plant biodiversity of Ethiopia. In: Coffee Production, Variety and Trading ways to maximize Ethiopia’s benefits, pp. 81–35 (A. Girma & T. Wube eds.). Proceedings of 24th annual conference of the biological society of ethiopia.
- Akarsha, B. M., & Hartmann, M. (2009). Emerging challenges for farm labour in the indian coffee sector biophysical and socio-economic frame conditions for the sustainable management of natural resources, Retrieved March 25, 2018 from http://www.tropentag.de/2009/abstracts/linksha-1rtmann_ c79x3tES.pdf
- Alemu, M. M. (2017). Banana as a cash crop and its food security and socioeconomic contribution: The case of Southern Ethiopia, Arba Minch. Journal of Environmental Protection, 8(3), 319–329.
- Arun-Chinnappa, K. S., Ranawake, L., & Seneweera, S. (2017). Impacts and management of temperature and water stress in crop plants. In P. S. Minhas (Ed.), Abiotic stress management for resilient agriculture (pp. 221–233). Springer.
- Belachew, B., & Labouisse, J. P. (2006, September 11-15). Arabica coffee (Coffea arabica L.) local landrace development strategy in its center of origin and diversity. In: Proceedings of the 21st international conference on coffee science (ASIC), (pp. 818–826).
- Belete, Y. (2014, March 14-15). Physical quality of Arabica coffee bean genotypes. In: Coffee Production, Variety and Trading ways to maximize Ethiopia’s benefits, pp. 108–125 (A. Girma & T. Wube eds.), Proceedings of 24th annual conference of the biological society of ethiopia.
- Berhanu, T. (2017). Ethiopian coffee sector strategy and future prospects, Coffee Tea and Spices Extension Director, ECTDMA, Addis Ababa, Ethiopia. Retrieved August 1, 2019 from. www.afca.coffee
- CABI (Center for agriculture and biodiversity international) (2018). Invasive species compendium: Detailed coverage of invasive species threatening livelihoods and the environment worldwide. CABI, International. Retrieved June 2019 from. https://www.cabi.org/isc/datasheet/38157
- Cerda, R., Avelino, J., Gary, C., Tixier, P., Lechevallier, E., & Allinne, C. (2017). Primary and Secondary Yield Losses Caused by Pests and Diseases: Assessment and Modelling in Coffee. PLoS ONE, 12(1), e0169133. https://doi.org/10.1371/journal.pone.0169133
- Coste, R. (1992). Coffee: The Plant and the Product (pp.328p). Macmillan.
- CRF (Coffee Research Foundation) (2003). Weed control in coffee. Coffee Research Foundation, Kenya technical circular no. 502
- CSA (Central Statistical Agency) (2016). Agricultural sample survey (pp.121p): report on area and production of major crops of private peasant holdings for ˝meher˝ season of 2016/17. Addis Ababa, Ethiopia: Central statistical Agency.
- CSA (Central Statistical Agency) (2018). Agricultural sample survey: report on area and production of major crops of private peasant holdings for meher season of 2017/18 57. Addis Ababa, Ethiopia: Central statistical Agency.
- CSA (Central Statistical Agency) (2019). Agricultural sample survey: report on area and production of major crops of private peasant holdings for meher season of 2018/19. 58. Addis Ababa, Ethiopia: Central statistical Agency.
- DHS (Demographic and Health Survey) (2017). Federal democratic republic of ethiopia, 2016 demographic and health survey (pp. 551), Central Statistical Agency.
- EBI (Ethiopian Biodiversity Institute). (2014). Ethiopia’s Fifth National Report to the Convention on Biological Diversity. Addis Ababa, Ethiopia. 86p.
- ECFF (Environment and Coffee Forest Forum). (2015). Coffee production system in . Addis Ababa, Ethiopia. Retrieved from https://www.naturskyddsforeningen.se/node/36761
- Esayas, M., & Chemeda, A. (2007, September 11-15). Preliminary studies on sources of resistance in Coffea arabica L. to coffee leaf miner, Leucoptera caffeina Washboum. pp. 1334–1337. In: International Conference of Coffee Science, 21st, Montpellier. ASIC, Paris.
- FAOStat (Food and Agricultural Organization of United Nations Statistics Division). (2012). Crop production. Retrieved from http://faostat.fao.org/site/567/default.aspx#ancor
- Fekadu, G., Maryo, M., & Benti, G. (2016). The prevalence and impact of coffee arthropod pests in the gedeo indigenous agro forestry systems, Southern Ethiopia. International Journal of Biodiversity and Conservation, 8(10), 233–243.
- Fekadu, G., Shimelis, H., & Mark, D. L. (2015). Diagnostic assessment of sweetpotato production in ethiopia: Constraints, post-harvest handling and farmers’ preferences, research on crops, 16(1), 104-115.
- Fekede, G. T., & Gosa, A. G. (2015). Opportunities and constraints of coffee production in West Hararghe, Ethiopia. Journal of Agricultural Economics and Rural Development, 2(4), 054–059.
- Gimase, J. M., Wilson, M. T., Chripine, O., 3, & John, M. I. (2019). Evaluation of coffee berry disease resistance (Colletotrichum kahawae) in F2 populations derived from Arabica coffee varieties Rume Sudan and SL 28. Journal of Plant Breeding and Crop Science, 11(9), 225–233.
- Girma, A., Bayetta, B., Tesfaye, S., Endale, T., & Taye, K. (2008, August 14-17). Coffeee diversity and knowledge. Addis Ababa, Ethiopia: Ethiopian institute of agricultural research. In: Proceedings on four decades of coffee research and development in ethiopia (G. Adugna, B. Bellachew, T. Shimber, E. Taye, & T. Kufa, eds.), A National Workshop, Ghion Hotel, Addis Ababa, Ethiopia (pp. 505–510).
- Gurmu, F., Shimelis, H., & Laing, M. D. (2015). Diagnostic assessment of sweet potato production in Ethiopia: Constraints, post-harvest handling and farmers’ preferences. Research on Crops, 16(1), 104–115.
- Habtamu, D. (2015). Review on effect of weed on coffee quality yield and its control measures in Southwestern Ethiopia. International Journal of Research Studies in Agricultural Sciences (IJRSAS), 4 (10): 7–16.
- Hassanuzzaman, M., Hossain, M. A., & Fujita, M. (2010). Physiological and biochemical mechanisms of nitric oxide induced abiotic stress tolerance in plants. American Journal of Plant Physiology, 5(6), 295-324.
- Hassanuzzaman, M., Hossain, M. A., & Fujita, M. (2015). ˝Physiological and biochemical mechanisms of nitric oxide induced abiotic stress tolerance in plants. American Journal of Plant Physiology, 5(6),294–324.
- Holger, H., & Omondi, C. O. (2010). A review of three major fungal diseases of Coffea arabica L. In the Rainforests of Ethiopia and Progress in Breeding for Resistance in Kenya. Journal of Advanced Research, 2(2), 109–120.
- James, W., Tim, S., & Leulsegged, K. (2015). Woreda level crop production ranking in Ethiopia. International food policy research institute (IFPRI) (p. 43).
- Jima, D., Melka, T., Angasu, B., Alemu, G., Zewdu, A., & Amin, M. (2017). Constraints and opportunities of coffee production in arsi zone. The Case of Chole and Gololcha Districts, European Journal of Business and Management, 9(10), 8–17.
- Jose, D. (2012). Ethiopian coffee: Challenges and opportunities. Ethiopian coffee export conference. Retrieved March 2018 from. http://www.ico.org/news/1211-ethiopia.pdf
- Kufa, T., & Shimber, T. (2002). Organic coffee production: Hope for small-scale farmers in Ethiopia. In Proceedings of the 19th International Conference on Coffee Science (ASIC) (pp. 1246-1252), May 14th-18th, 2001, Trieste, Italy.
- Kumlachew, A., Adugna, G., Fikre, L., & Muleta, D. (2016). Current status of coffee berry disease (colletotrichum kahawae waller & bridge) in ethiopia. Archives Of Phytopathology and Plant Protection, 49(17-18), 421-433. doi: 10.1080/03235408.2016.1228736
- Matthew, C. (2015). The introduction of parthenium weed into Ethiopia (pp. 228p): Case study from R. Wittenberg & C. MJW, eds. Invasive Alien Species: A Toolkit of Best Prevention and Management Practices. Wallingford, UK: CAB International.
- Mirza, H., Nahar, K., & Fujita, M. (2013). Extreme temperature responses, oxidative stress and antioxidant defense in plants, abiotic stress - plant responses and applications in agriculture, Kourosh Vahdati and Charles Leslie, Intech Retrieved September 2019 from 10.5772/54833.
- MOA (Ministry of Agriculture). (2013). Plant variety release, protection and seed quality control directorate, Crop varieties register, (16), 330. Addis Ababa, Ethiopia.
- Morgan, A., Nancy, L. L., Gene, W. G., & Karen, C. B. (2004). SPSS introductory statisticsuse and interpretation (2nd Ed). 224p. Mahwah, New Jersey: Lawrence Erlbaum Associates.
- Mukadasi, B. (2019). Relational effects of land resource degradation and rural poverty levels in Busoga Region, Eastern Uganda. International Journal of Environment, Agriculture and Biotechnology (IJEAB), 4, 1054–1062.
- Ngasoh, F. G., Jandong, E. A., Dauda, P. A., & Ismaila, R. (2019). The influence of climate variation on abiotic plant stress: A Review. International Journal of Environment, Agriculture and Biotechnology (IJEAB), 4(4), 1153–1160.
- Nigatu, R. G., & Barbara, J. S. (2011). Household food insecurity and hunger among households in Sidama district, southern Ethiopia. Public Health Nutrition, 15(7), 1276–1283.
- Nure, D. (2008, August 14-17). Mapping quality profiles of Ethiopian coffee by origin. In: Coffee Diversity and Knowledge, pp. 317–327 (G. Adugna, B. Belachew, T. Shimber, E. Taye, & T. Kufa, eds.). Proceedings of a National Workshop on Four Decades of Coffee Research and Development in Ethiopia, Addis Ababa, EIAR, Ethiopia.
- Nyabundi, K. W., & Kimemia, J. K. (1998). Difficult Weed in Kenya Coffee. Kenya Coffee, 63, 2747–2751.
- Nyambo, T. B., & Masaba,, (1997). Integrated pest management in coffee: Needs, limitations and opportunities. In: Association Scientifique International du Café 17th international conference on coffee science in Kenya (International Scientific Colloquium on coffee ed.). pp. 629–638. International Institute of Biological Control. Nairobi, Kenya.
- OECD (2020), Working age population (indicator). Retrieved 03 March 2020 from. 10.1787/d339918b-en.
- Parvatha, P. R. (2010). Insect, mite and vertebrate pests and their management in horticultural crops (pp. 383p). Scientific publishers.
- Solomon, B., (2014). The role of nutrient inputs in specialty and conventional coffee production systems in ethiopia: balancing productivity with niche market requirements coffee production, Variety and Trading ways to maximize Ethiopia’s benefits Proceedings of a National Conference Biological Society of Ethiopia Co-hosted by Dilla University March 14-15, 2014 pp.29-45.
- Susana, L. C. (2006). Feminization of agriculture: Trends and Driving Forces (pp. 25p), World bank background paper for the world development report 2008, version 1.
- Taye, K. (2013, November 28-30). The status of science and technology of coffee production in Ethiopia. In: Proceedings of the Workshop on the State of Agricultural Science and Technology in Ethiopia, pp. 201–218 (B. Gebrekidan, S. Debela, S. Berure, T. Bezuneh, S. Hailemariam, & G. Zeleke, eds.). International Livestock Research Institute (JLIRI), Addis Ababa, Ethiopia.
- Taye, K. (2014, March 14-15). Sustainability of coffee environments and genetic resources in Ethiopia (pp. 11–27). In: A. Girma & T. Wube (eds.). Proceedings of 24th annual conference of the biological society of ethiopia, coffee production, variety and trading -ways to maximize Ethiopia’s benefits, Dilla,
- Teferi, D., & Belachew, K. (2018). A review of coffee diseases research in Ethiopia. International Journal of Agriculture and Bioscience, 7(2), 65–70.
- Tesfatsion, D. (2016). A qualitative study on internal migrants in ethiopia: Causes, experiences, perceptions, challenges and future life orientations. Journal of Social Economics, 3(2), 54–72.
- UN (United Nation) (2008). Measuring Sustainable Development (pp. 124p). Report of the Joint Unece/Oecd/Eurostat Working Group on Statistics for Sustainable Development United Nations.
- UN (United nations) (2017). United Nations, Department of Economic and Social Affairs, Population Division (2017). Household Size and Composition around the World 2017 (pp. 36p) Data Booklet (ST/ESA/SER.A/405).
- USDA (United States Department of Agriculture) (2019). Coffee annual report (pp. 6p) GAIN (Global Agricultural Information Network) USDA foreign Agricultural Service report Number: ET1904.
- Wahid, A., Gelani, S., & Ashraf, M. (2007). Heat tolerance in plants; An Overview. Journal of Environmental and Experimental Botany, 61(3), 199–223.
- Ward, N. L., & Masters, G. J. (2007). Linking climate change and species invasion: An illustration using insect herbivores. Global Change Biology, 13,(8), 1605–1615.
- Wolassa, L. K. (2013). Sidama economy. Retrived June 2018 from http://www.srdforum.net/10.html
- Worako, T. K., Dereje, M., & Minten, B. (2015). Coffee income, food security and diet diversity of small holder coffee growers in Ethiopia (pp. 39p). EDRI working paper 15, Addis Ababa: Ethiopian development research institute.
- Zinabu, W., Tefera, A., Yared, S., Gezahagn, T., & Tadesse, T. (2017). A review on coffee farming, production potential and constraints in Gedeo Zone, Southern Ethiopia. Journal of Natural Sciences Research, 7(23), 1–9.